
Patch 4.3.3
Explore Tellius Patch 4.3.3: Enhanced Vizpad controls, improved anomaly detection, and performance optimizations for a smoother analytics experience.
The improvements and fixes implemented in 4.3.3 show our commitment to continually enhancing the user experience and functionality of our platform. Each of these updates has been carefully crafted to address specific user needs and make your interactions more efficient and intuitive.
🚀 New feature
System date reference for columns in a Business View
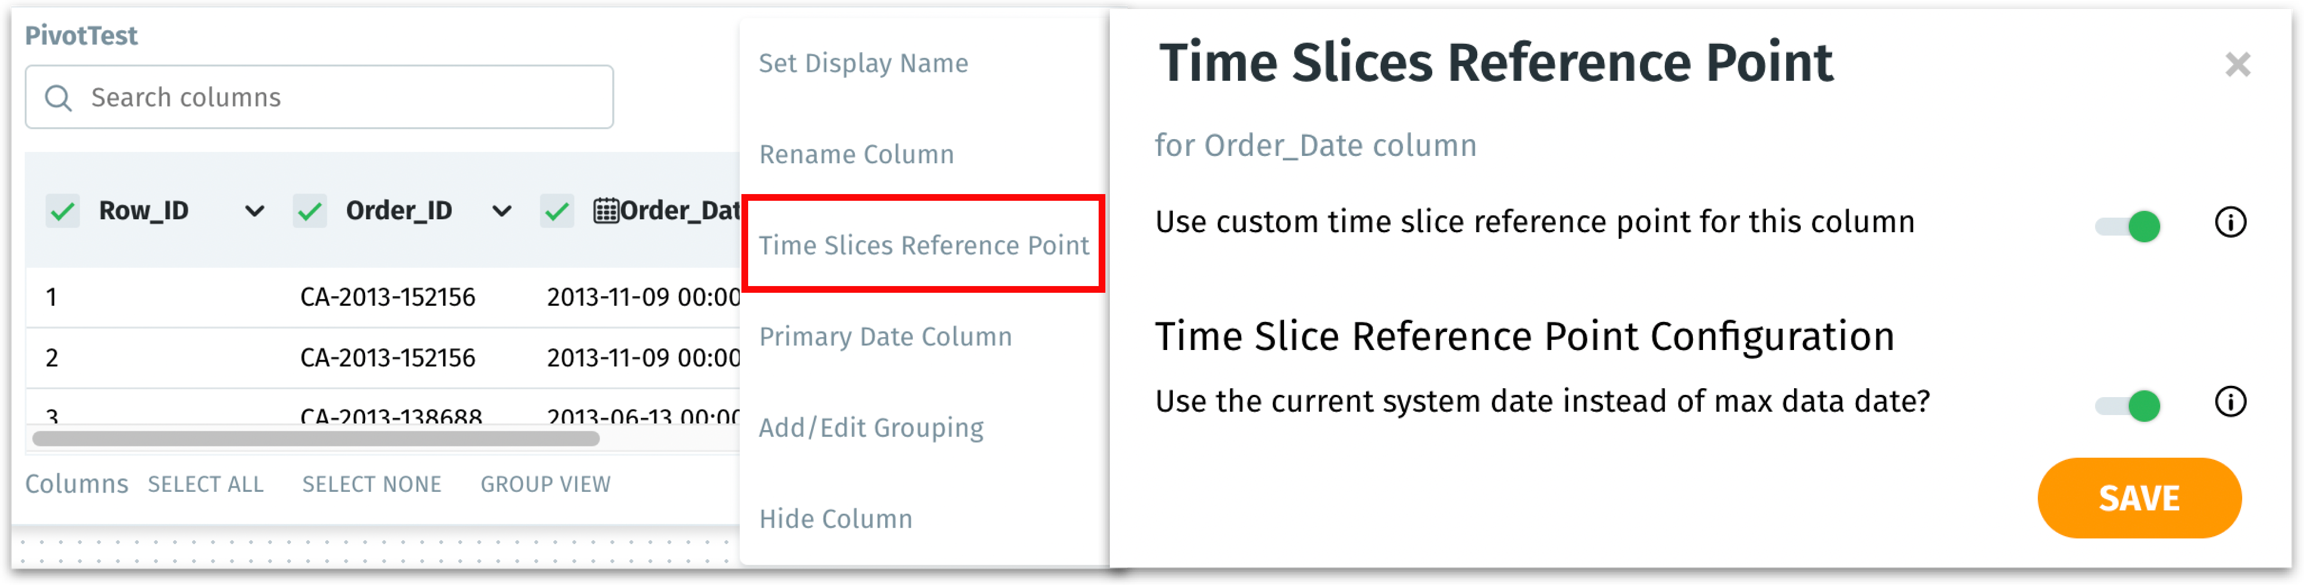
We've upgraded Business Views with an advanced date reference feature, offering users control over their time-based queries. Previously, when users activated the “Use the current system date” toggle, the reference point applied universally to all Business Views across the instance, which could be challenging for datasets ending in a specific year with no subsequent data. To address this, we now allow users to set the current system date for specific columns within a Business View, providing granular control over date columns.
For example, users can now apply the current system date to specific columns like “Delivered date”, while other columns retain their maximum dates as per the Business View data. This feature is particularly beneficial for executing time-bound queries, such as “Show me delivered orders in the last 3 weeks.” It ensures that your data analysis is not only more accurate but also perfectly aligned with the specific requirements of your business timelines and needs.
📈 Enhancements
Multi-dimensional analysis for pivot table subtotals
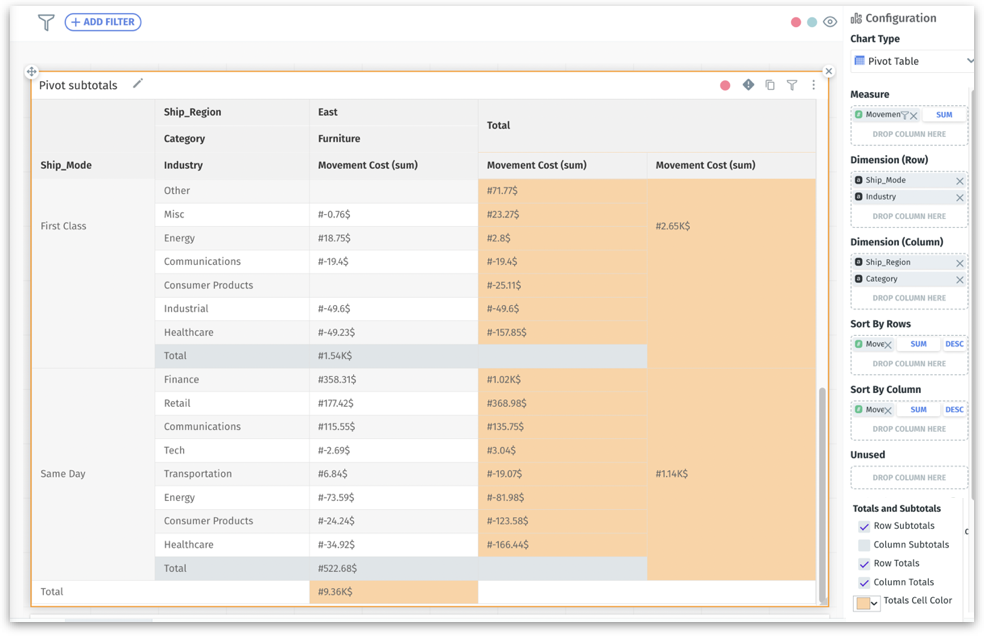
Instead of showing subtotals only at the end of a pivot table, they will now appear at each dimension level for a clearer understanding of data at various hierarchy levels. Subtotals will also be displayed in shade of grey to easily differentiate subtotals from banded rows. Moreover, subtotals can now be generated for every possible combination of row and column dimensions. This means users can see aggregated data not just for individual dimensions but also for how these dimensions interact with each other across the table.
Consider a pivot table configured with "Category", "Sub Category", and "Brand" in the row dimensions, and "Year of Sales", "Payment Type" in the column dimensions. Previously, the pivot table would display subtotals at the end of the table for:
Each "Category"
Each combination of "Category" + "Sub Category"
Each combination of "Category" + "Sub Category" + "Brand"
And for column dimensions, it would show subtotals for:
Each "Year of Sale"
Each combination of "Year of Sale" + "Payment Type"
In addition to the above, the pivot table now also calculates and displays subtotals for more detailed combinations, such as:
"Category" + "Year of Sale" + "Payment Type"
"Category" + "Sub Category" + "Year of Sale" + "Payment Type"
"Category" + "Sub Category" + "Brand" + "Year of Sale" + "Payment Type"
Now, pivot tables are capable of dissecting and displaying multi-dimensional data in an intuitive format. For instance, if you're looking to understand how different "Brands" within a "Category" and "Sub Category" perform across "Years of Sale" and "Payment Types", the pivot table can show you specific subtotals for these combinations.
Axis labeling for charts in Tellius Assistant
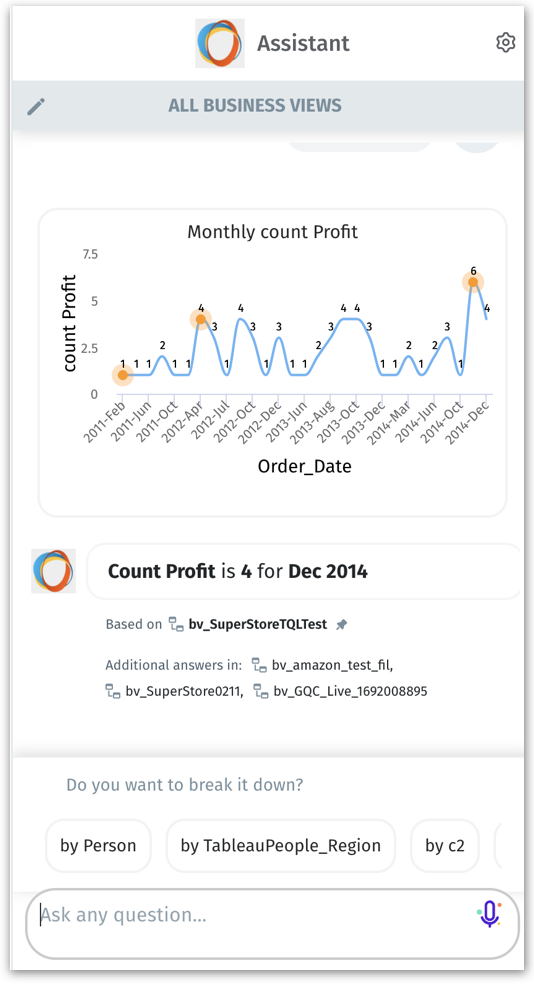
We've added y-axis and x-axis labels to the charts in Tellius Assistant. This improvement not only adds clarity to the visual data representation but also makes it easier for users to understand and interpret the charts more effectively.
Static header in Feed
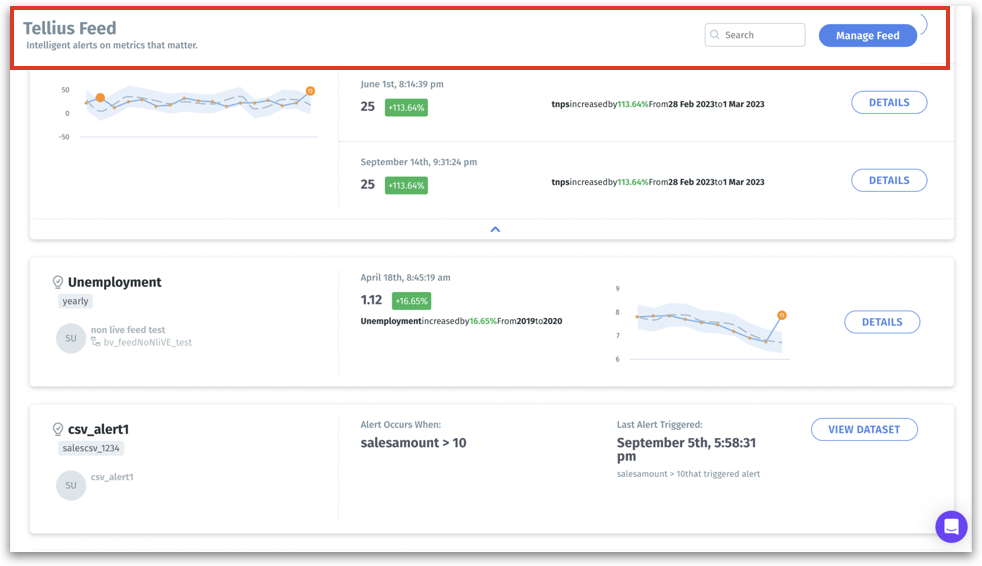
To enhance the user experience on the Feed page, we have made the header of Feed static. Users no longer need to scroll to the top of the page to search for a required Feed, manage existing Feeds, or create a new one. This makes navigating and interacting with the feed page more convenient.
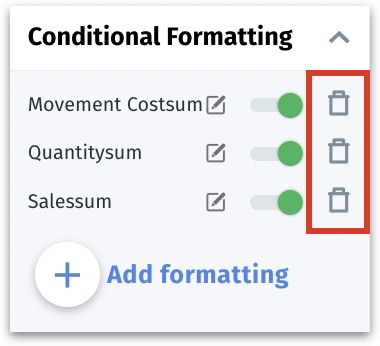
Deleting conditional formatting in tables
In Vizpads, while applying conditional formatting and setting up conditions for all types of tables (including pivot and detailed), a delete option has been included for every added condition. This enhancement allows users to effortlessly delete any required condition.
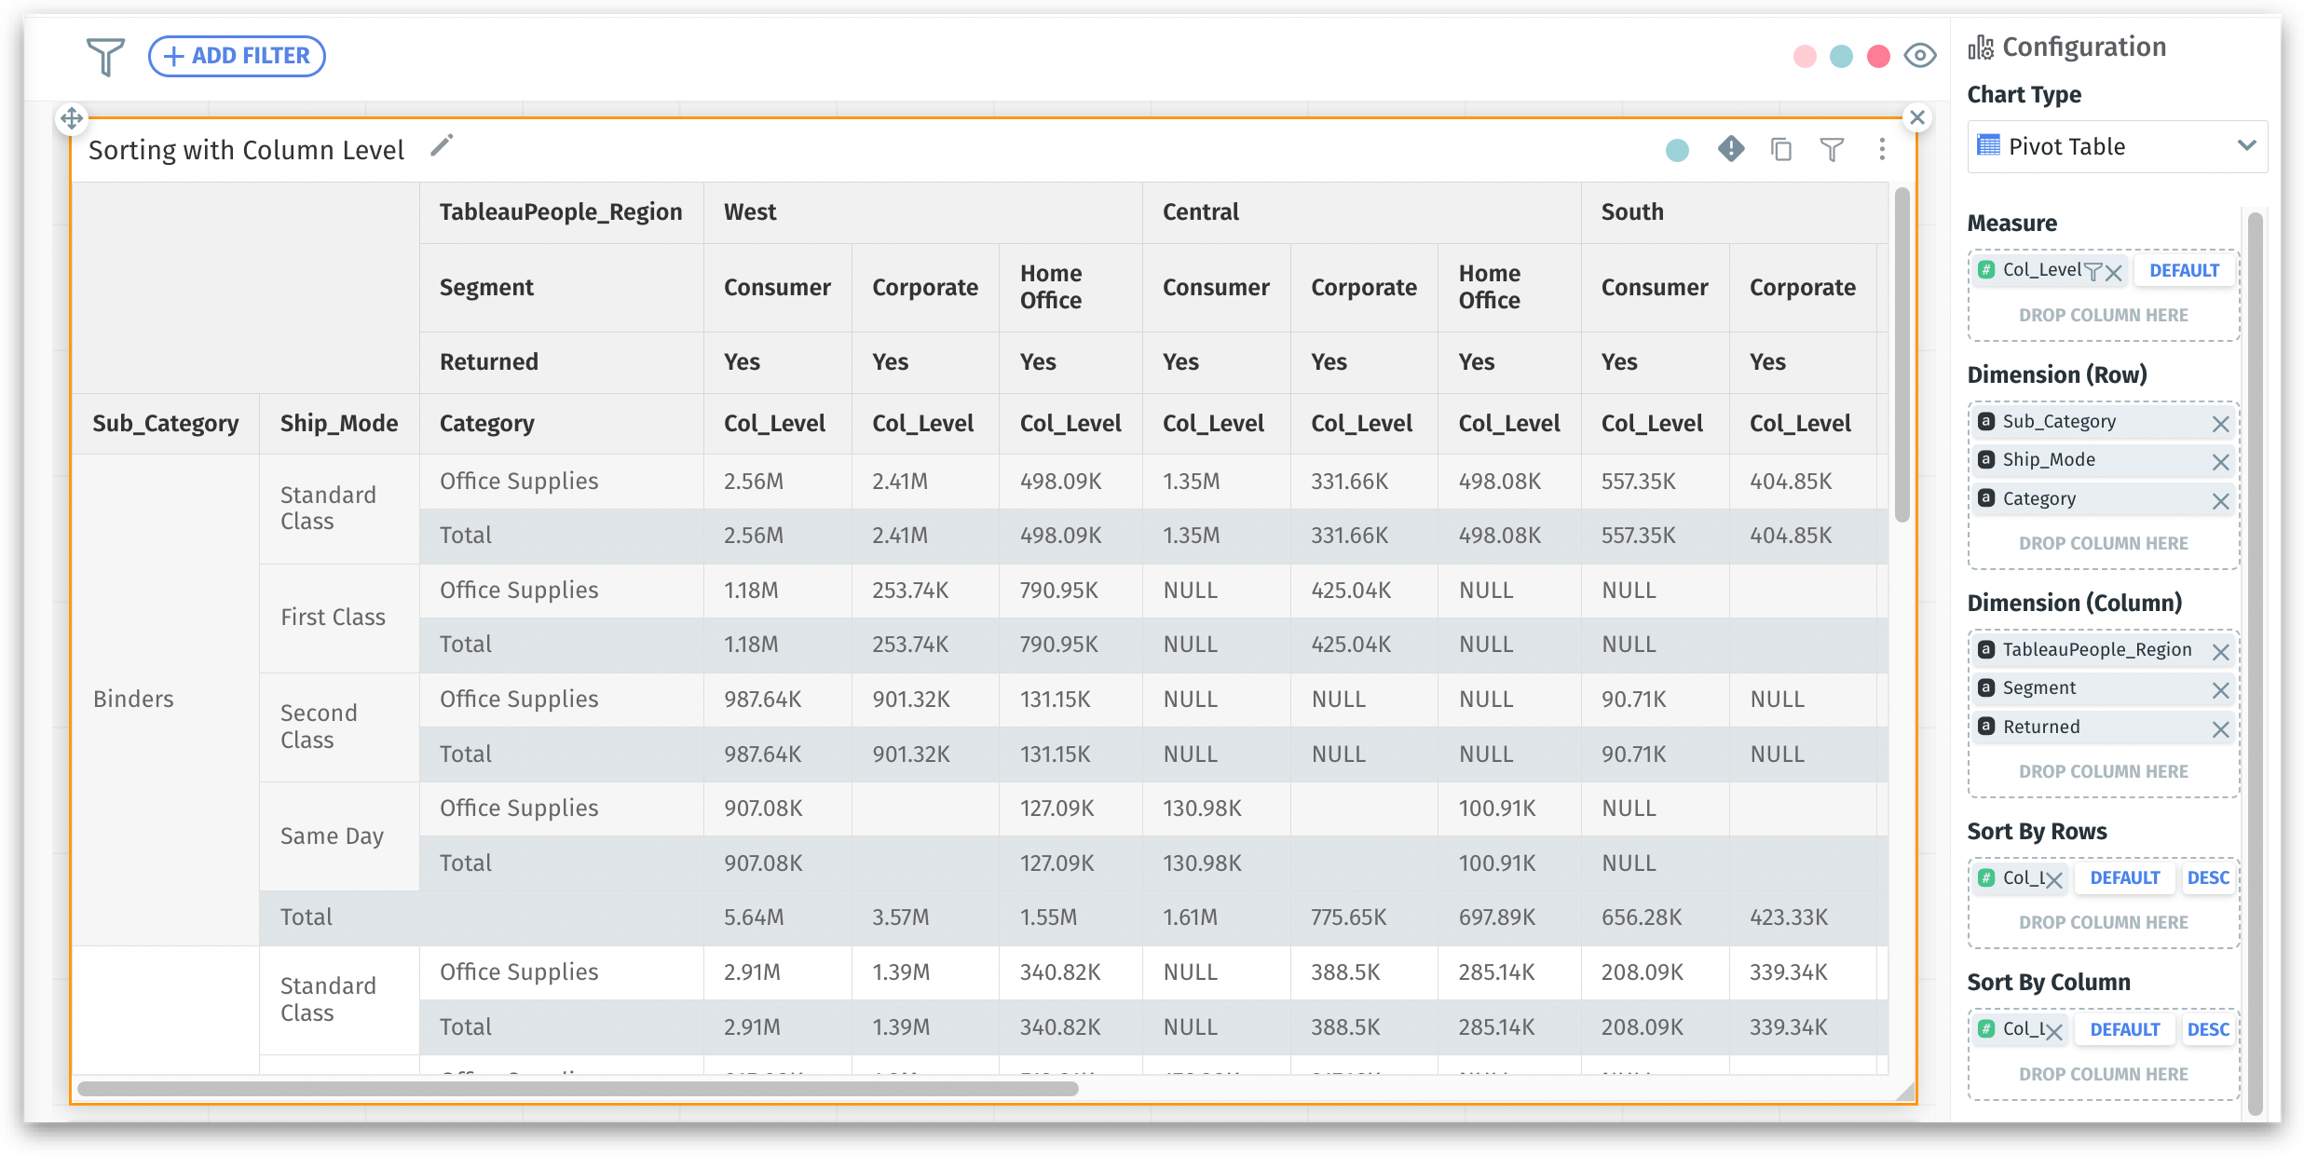
Multi-sorting of pivot tables
In Vizpads, users were able to sort only the first dimension in rows or columns of pivot tables based on the “Sort by” column. The secondary and subsequent dimensions were automatically sorted alphabetically.
Now, when totals or subtotals are enabled in Pivot Tables, all dimensions—primary, secondary, tertiary—will be sorted according to the user-defined “Sort by” column.
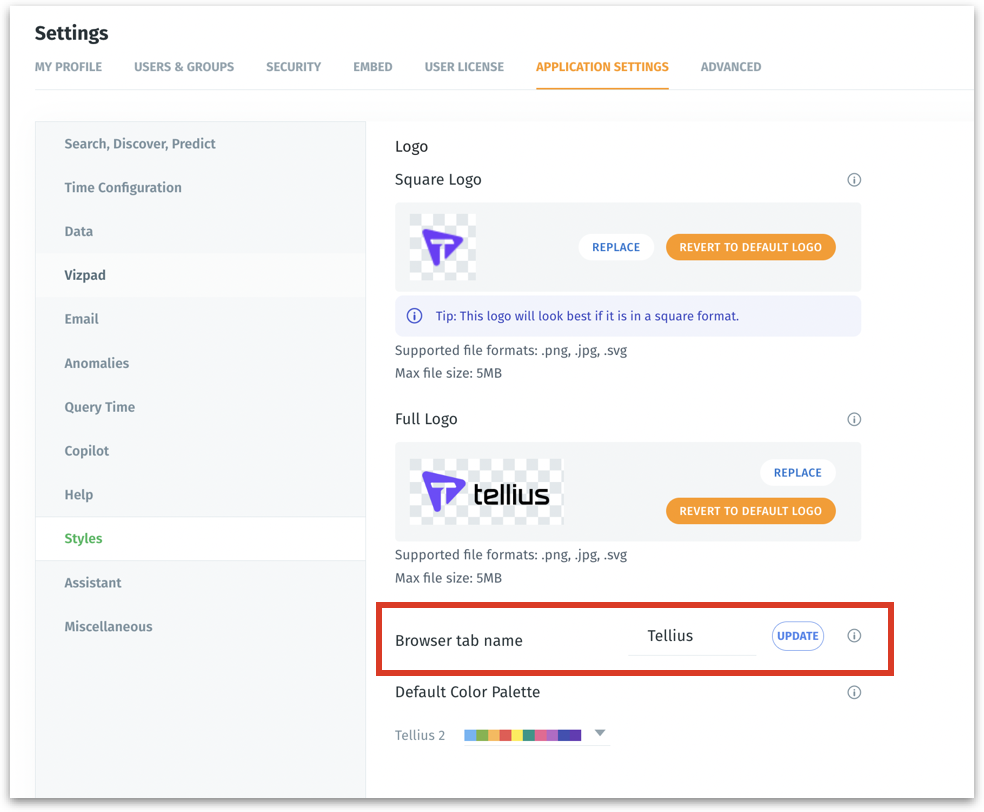
Customizing the display name in browser tabs
We've introduced a new customization feature that allows users to configure the title displayed on the browser tab according to their branding needs. In addition to updating the logo and color scheme, users now have the flexibility to change it to their preferred name under Settings → Application Settings → Styles. By default, the browser tab will display "Tellius".
Removal of mandatory column field in pivot tables
We have lifted the restriction that required a mandatory field in the Dimension (Column) bucket for creating a pivot table. Users can now create pivot tables with just row dimensions and measures, offering greater flexibility in table configuration.
Efficient publishing of datasets
During the “Publish” step of a Dataset, Tellius is now optimized to checkpoint transformed data only when necessary. This refinement not only improves the overall performance of the dataset publishing process but also contributes to better resource management and faster processing times.
🛠️ Minor fixes
Resolved an issue where metadata updates were not properly flowing from the parent dataset to the single-sourced scripted dataset after transformations and refreshes.
Addressed the audit log rotation strategy, ensuring logs now rotate daily as per the updated strategy.
Fixed the issue where enabling “Include Nulls” in Application Settings was not reflected in search results, ensuring more accurate data retrieval.
Resolved the issue where newly created users assigned to specific user groups (in addition to the default group) did not retain these assignments.
In Tellius Assitant, corrected the automatic pinning of the Business View selected from suggestions, streamlining the selection process.
In Help Tellius Learn feature of Search, the issue with updating learning for dimension values has been fixed.
Resolved the issue with outer join not functioning in Redshift Live connections, ensuring accurate data merging operations.
In Data module, fixed a bug where Python transformations were failing on data containing date/time columns before “1900”.
The issue with Trend Insights when a dimension with an empty string value was chosen as a contributor has been fixed.
Fixed format issues with market share-related queries; the term “market share” can now be specified after the metric.
In live datasets, resolved an issue where user-applied dimension/measure preferences were overridden with default values during refresh.
Addressed time comparison search queries that were giving the same values for both periods in case of preceding time filters, ensuring accurate temporal comparisons.
In Notifications, the issue with updating “Indexing” background jobs has been resolved.
Corrected a mismatch in local time and filter time in absolute/percentage change date columns, ensuring accurate time-based data analysis.
Fixed an issue where Trend Insights and Absolute/Percentage Change aggregations were failing for calculated columns with statements including the term “case”.
The sorting issues when using “Top N Filter” in stacked bar charts have been addressed.
Resolved issues where “Top N Filters” with row-level policies were not reflected in Vizpad charts.
Fixed the display issue in the Help Us Learn of Search, ensuring the correct Display Names appear for each column instead of the original column names.
In marketshare-related search queries, addressed a problem where aggregation keywords were incorrectly recognized as column names.
Enhanced the search functionality to reflect updates in learnings immediately after updating definitions (in Help Tellius Learn), ensuring real-time accuracy in search results.
Fixed the issue with the display of transformation nodes in the Metadata page when switching from the Data tab.
The issue with changes made in the Metadata page not being reflected in the Trend Analysis created from Search has been fixed.
Corrected a live query support issue on Databricks sources where the year-week value was used instead of the actual year value, ensuring more accurate query results.
Tellius now accurately captures and reflects the identity of the actual user making updates to the Business View, resolving the previous issue of attributing changes to the Business View owner.
Improved permanent data storage by checking and clearing any intermediate checkpoints in the Dataset lineage (in addition to the latest published state).
Resolved an issue in scripted datasets where the presence of missing columns required the validity of old SQL scripts, now enabling smoother data management.
In Vizpads, resolved the issue where the dropdown control filter was not functioning when resized to its smallest dimension of 1x1.
Last updated
Was this helpful?