> For the complete documentation index, see [llms.txt](https://help.tellius.com/llms.txt). Markdown versions of documentation pages are available by appending `.md` to page URLs; this page is available as [Markdown](https://help.tellius.com/6.0/vizpads-explore/explainable-ai-charts.md).
# Explainable AI charts
The explainable AI charts in Vizpads offer users a detailed view of how machine learning models derive their predictions. This bridges the gap between black-box AI predictions and tangible, understandable factors that influence each outcome.
{% hint style="danger" %}
Please note that explainable AI charts are exclusively available in Vizpads and are not part of the Search module.
{% endhint %}
### **Components of Explainable AI charts**
1. This chart presents a visual representation of the influencing factors for a machine learning model's prediction.
* **Prediction**: Shows the predicted outcome of the machine learning model. It gives a snapshot of what will occur based on the data and factors.
* **Accuracy**: Displays the accuracy percentage of the model's prediction. It helps gauge the reliability of the AI's insights
* **Factors**: Lists down the factors affecting the prediction, ranked by their importance.
* **Values:** Each factor comes with a value. A positive value indicates the factor positively impacts the prediction, while a negative value means it hampers it.
{% hint style="info" %}
The column used for prediction will be displayed at the top (next to **Prediction** and **Accuracy).**
{% endhint %}
Explainable AI chart
2. To access a detailed breakdown of the prediction, click on any row within the chart.
3. Upon selection, the left panel will update to display a list of contributing factors along with their respective values, offering a clear insight into the prediction's reasons.
By understanding the influencing factors, users can get a clear insight into the 'why' behind every AI prediction and make informed decisions.
### **How to create a new explainable AI chart?**
1. Navigate to **Explore -> Create new Vizpad** or open an existing Vizpad.
2. Click on **Add Chart -> Explainable AI**.
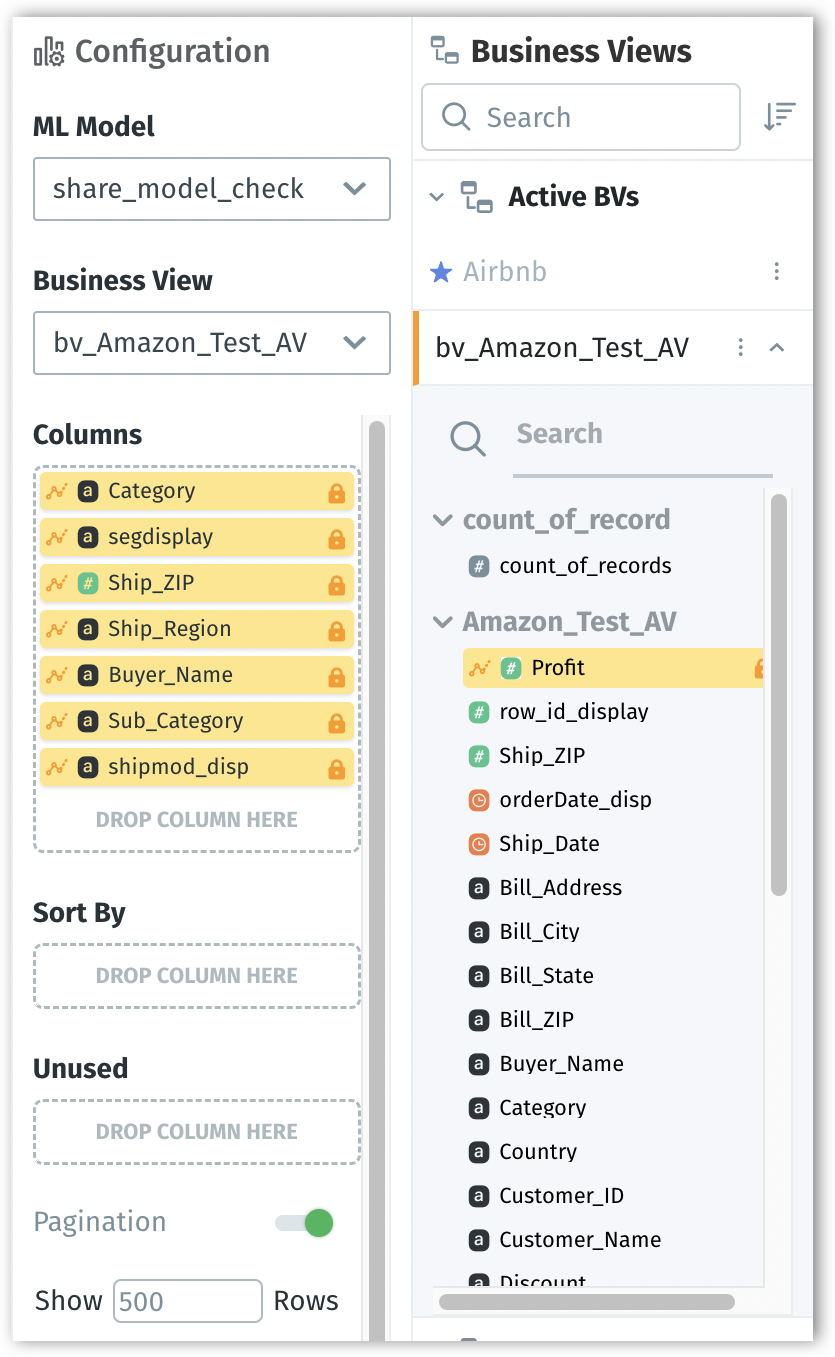
3. In the **Configuration** pane on the right, choose the required **ML Model**. This model determines the predictions and factors shown in the Explainable AI Chart.
Configuration of explainable AI chart
1. From that model, select the required **Business View** from a list of Business Views used by the ML-Model.
2. The target columns selected for prediction and accuracy will be auto-populated under **Columns**, and highlighted in yellow with a lock sign displayed adjacent to each column name.
3. **Sort by**: Double-click the columns by which the chart needs to be sorted or drag and drop the required columns under the **Sort by** field.
4. **Unused:** The columns that cannot be used for the chart but are selected will be listed here.
5. Enable **Pagination** if you want data to be displayed on separate pages. Provide the required number to be shown per page in the **Show Rows** field.
### **Factors Sorting**
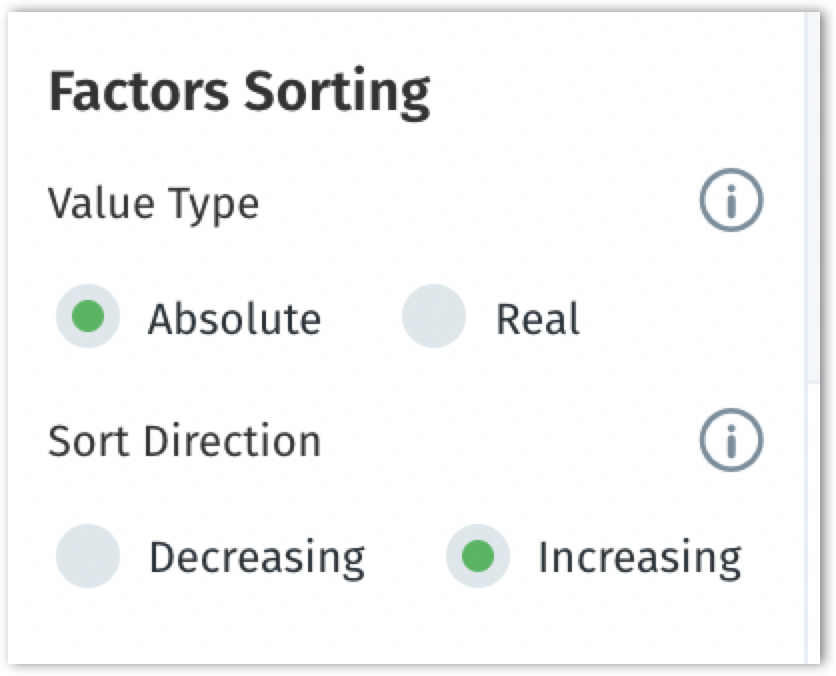
The "**Factors Sorting**" section allows users to customize the order in which these factors are displayed, based on their values. By toggling between these options, users can gain a clearer understanding of which factors play a dominant role in AI's predictions and how they relate to each other in magnitude and direction.
Factors sorting section
#### **1. Value Type:**
* **Absolute**: When you select this option, the factors will be sorted based on their absolute values. It ignores whether the influence of a factor is positive or negative. This mode focuses solely on the magnitude or strength of the influence, not its direction. For example, if you have factors with values of -10, 5, and -8, they'll be sorted as 10, 8, and 5 in absolute sorting.
* **Real**: In this mode, factors are sorted by their genuine values, including their positive or negative influence. This mode gives you a holistic view by considering both the magnitude and the direction of the influence. Continuing with the previous example, they would be sorted as 5, -8, and -10 in real sorting.
#### **2. Sort Direction:**
The "Sort Direction" determines the order (ascending or descending) in which the factors are presented.
* **Decreasing**: When selected, the factors will be displayed from the highest to the lowest value, based on the chosen value type (either **Absolute** or **Real**).
* **Increasing**: Opposite to the decreasing option, factors are listed from the smallest (or most negative) to the largest (or most positive) based on the selected value type.
---
# Agent Instructions
This documentation is published with GitBook. GitBook is the documentation platform designed so that both humans and AI agents can read, navigate, and reason over technical content effectively. Learn more at gitbook.com.
## Querying This Documentation
If you need additional information that is not directly available in this page, you can query the documentation dynamically by asking a question.
Perform an HTTP GET request on the current page URL with the `ask` query parameter, and the optional `goal` query parameter:
```
GET https://help.tellius.com/6.0/vizpads-explore/explainable-ai-charts.md?ask=&goal=
```
`ask` is the immediate question: it should be specific, self-contained, and written in natural language.
`goal` is optional and describes the broader end goal you are ultimately trying to accomplish on behalf of the user. GitBook uses it to tailor the answer towards what is most useful for that goal.
The response will contain a direct answer to the question and relevant excerpts and sources from the documentation.
Use this mechanism when the answer is not explicitly present in the current page, you need clarification or additional context, or you want to retrieve related documentation sections.