> For the complete documentation index, see [llms.txt](https://help.tellius.com/llms.txt). Markdown versions of documentation pages are available by appending `.md` to page URLs; this page is available as [Markdown](https://help.tellius.com/getting-started/quick-start-guides/vizpads-explore.md).
# Vizpads (Explore)
A Vizpad is an interactive dashboard that transforms your data into illustrative and actionable insights. It merges multiple datasets and integrates with our AI, Insights, and Search features, providing a comprehensive analysis on a unified platform.
Vizpads are dynamically built, allowing you to easily resize, add, or remove elements without pre-setting your canvas structure. Happy data exploring!
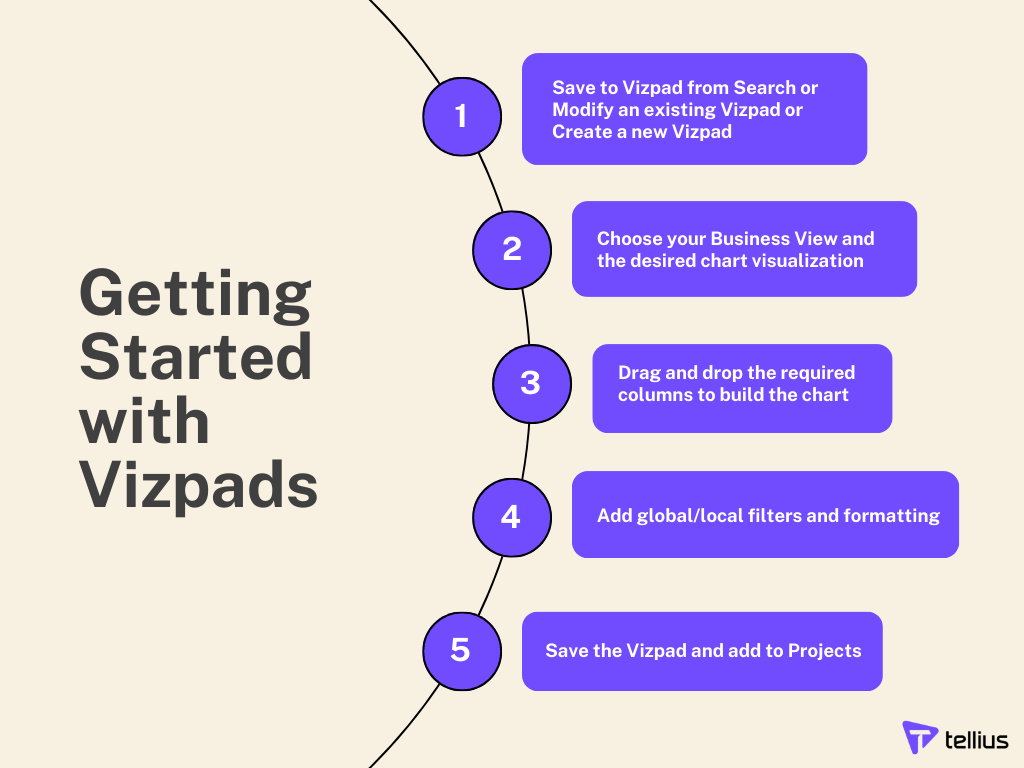
### **Getting started with Vizpads**
How to get started with Vizpads
### **Commonly performed actions in Vizpads**
Several actions can be performed to enhance your Vizpad experience:
* Adding and cloning charts
* Formatting charts
* Applying global and local filters
* Adjusting data granularity on an individual chart
* Sharing and exporting Vizpads
* Resizing and repositioning the chart on a Vizpad
---
# Agent Instructions
This documentation is published with GitBook. GitBook is the documentation platform designed so that both humans and AI agents can read, navigate, and reason over technical content effectively. Learn more at gitbook.com.
## Querying This Documentation
If you need additional information that is not directly available in this page, you can query the documentation dynamically by asking a question.
Perform an HTTP GET request on the current page URL with the `ask` query parameter, and the optional `goal` query parameter:
```
GET https://help.tellius.com/getting-started/quick-start-guides/vizpads-explore.md?ask=&goal=
```
`ask` is the immediate question: it should be specific, self-contained, and written in natural language.
`goal` is optional and describes the broader end goal you are ultimately trying to accomplish on behalf of the user. GitBook uses it to tailor the answer towards what is most useful for that goal.
The response will contain a direct answer to the question and relevant excerpts and sources from the documentation.
Use this mechanism when the answer is not explicitly present in the current page, you need clarification or additional context, or you want to retrieve related documentation sections.