# The art of the possible
Agentic flows are intelligent, modular analytics processes composed of AI Agents that understand your questions and deliver insights without writing a single line of code.
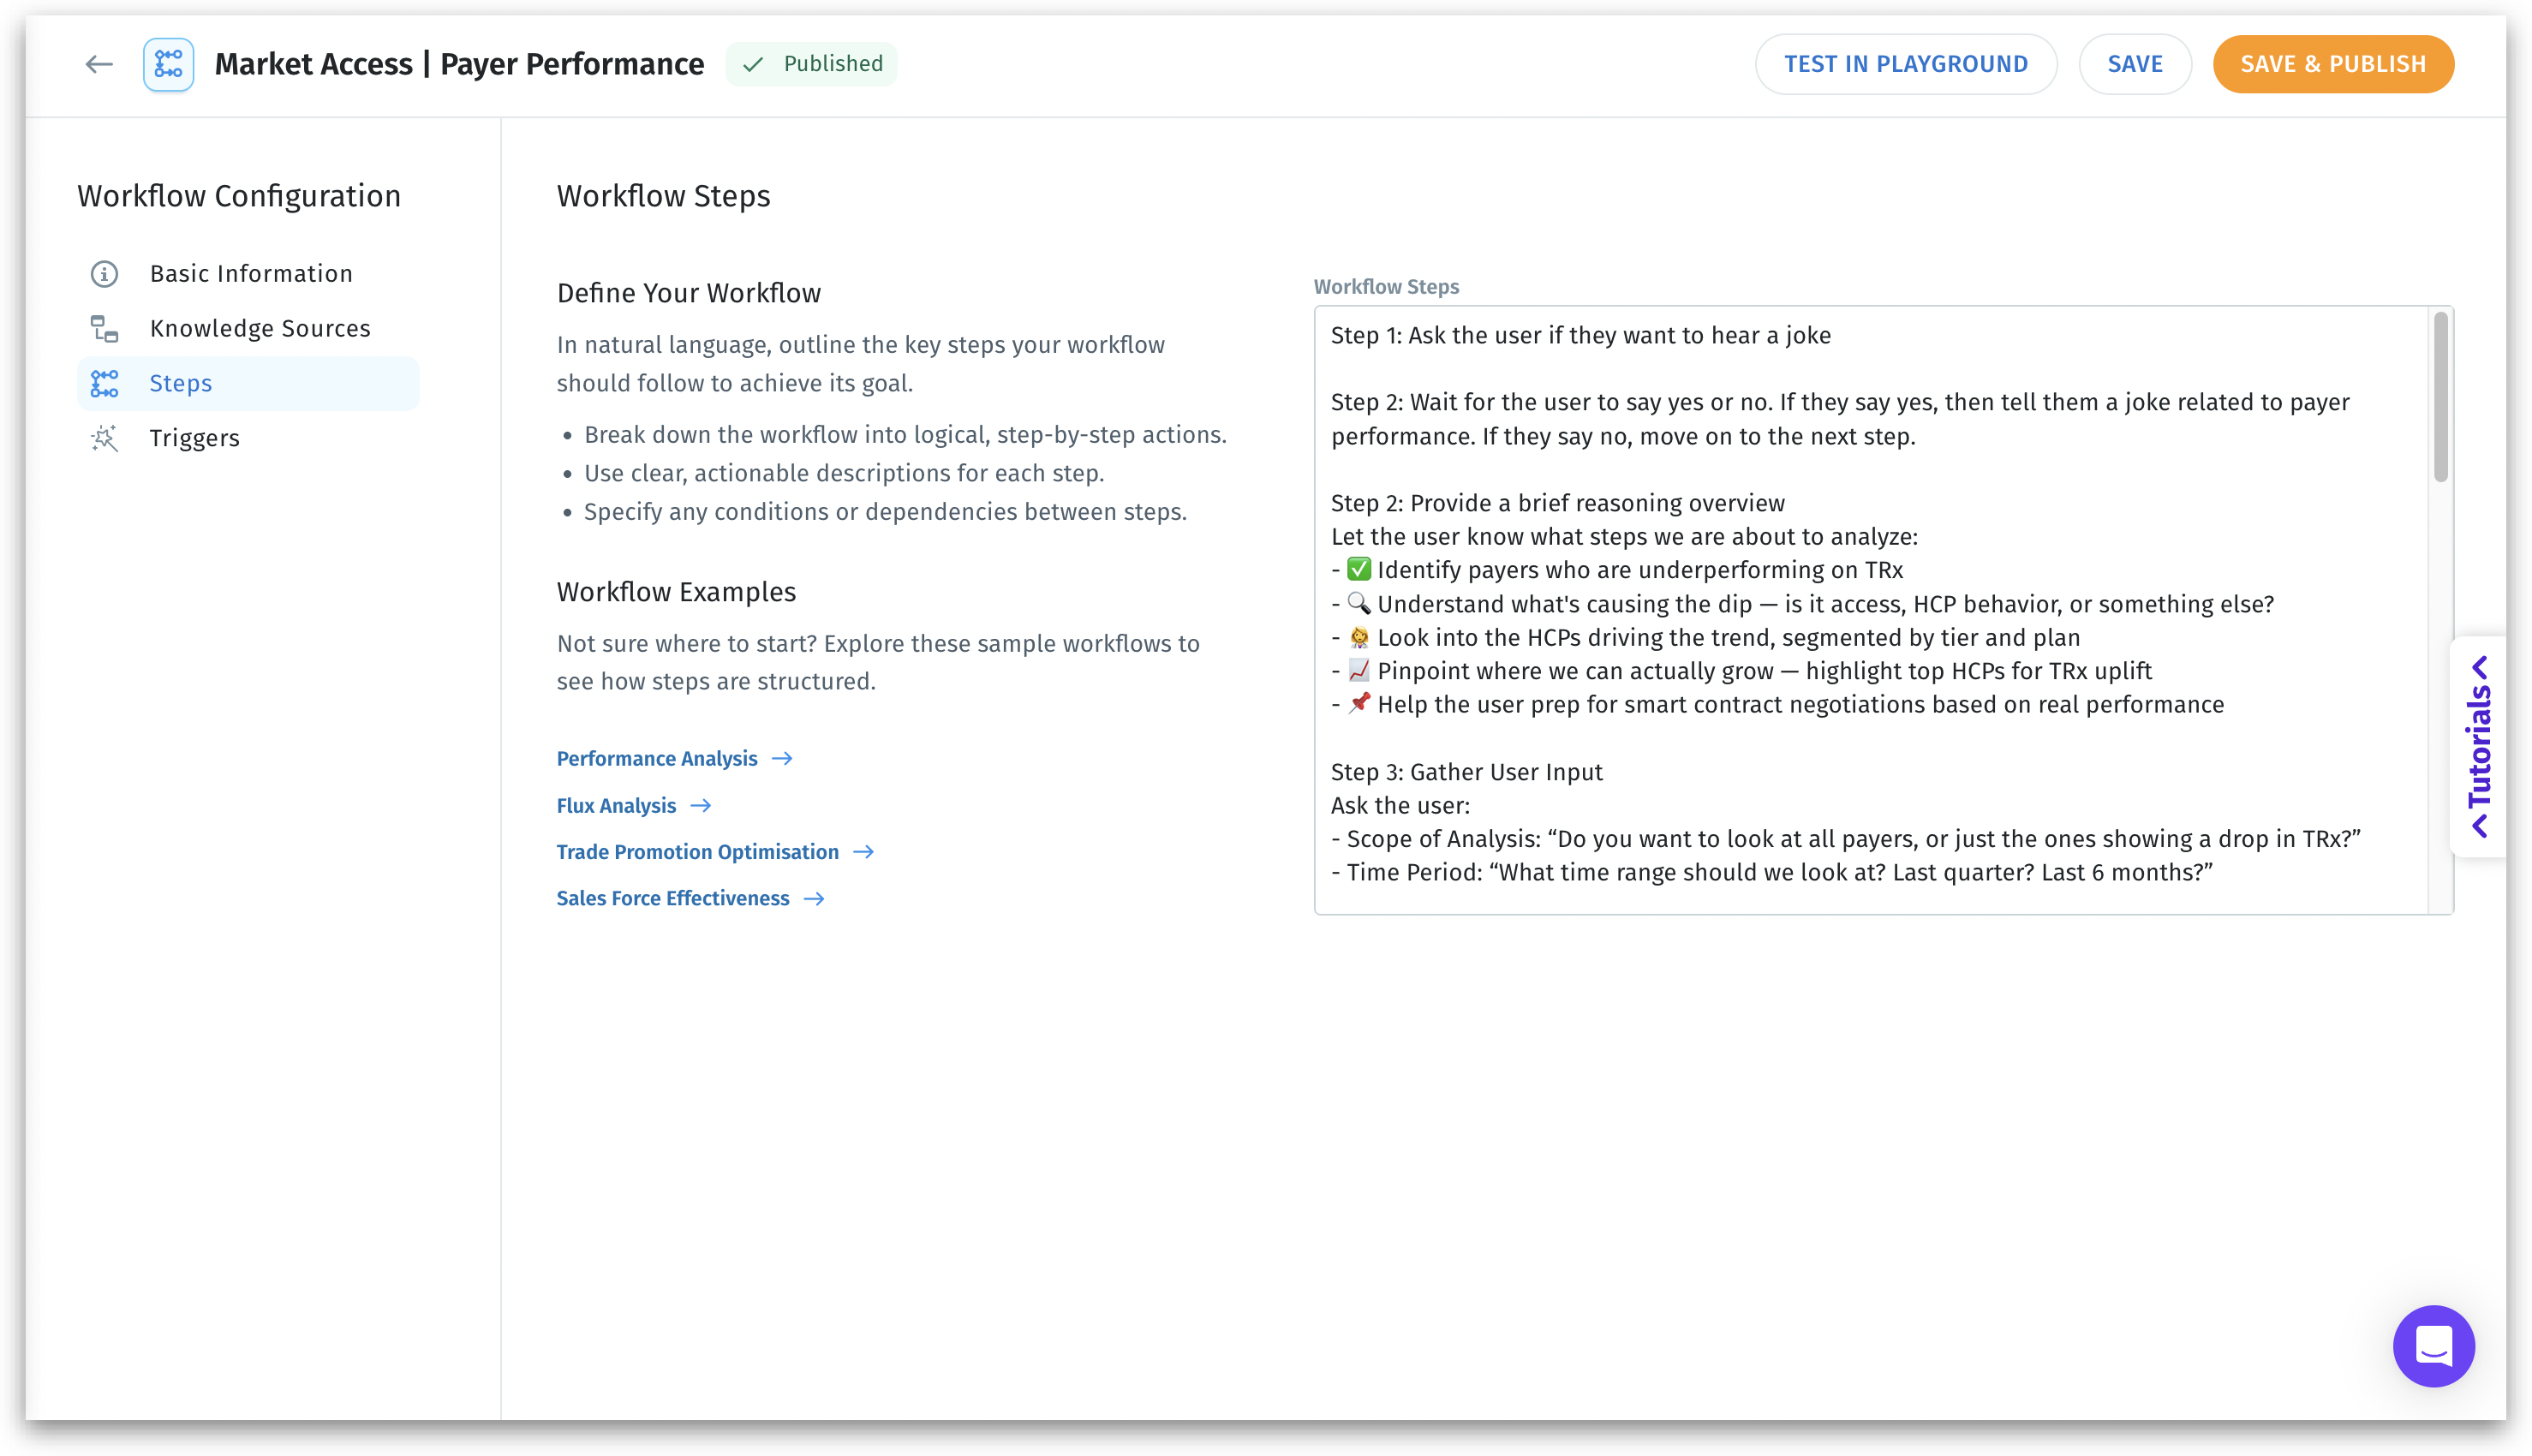
The **Steps** section in **Composer** lets you describe any workflow like the ones below in natural language. Our AI agents will do the rest: gather the relevant data, run the analysis, generate visuals, and surface insights.
Steps section in Composer
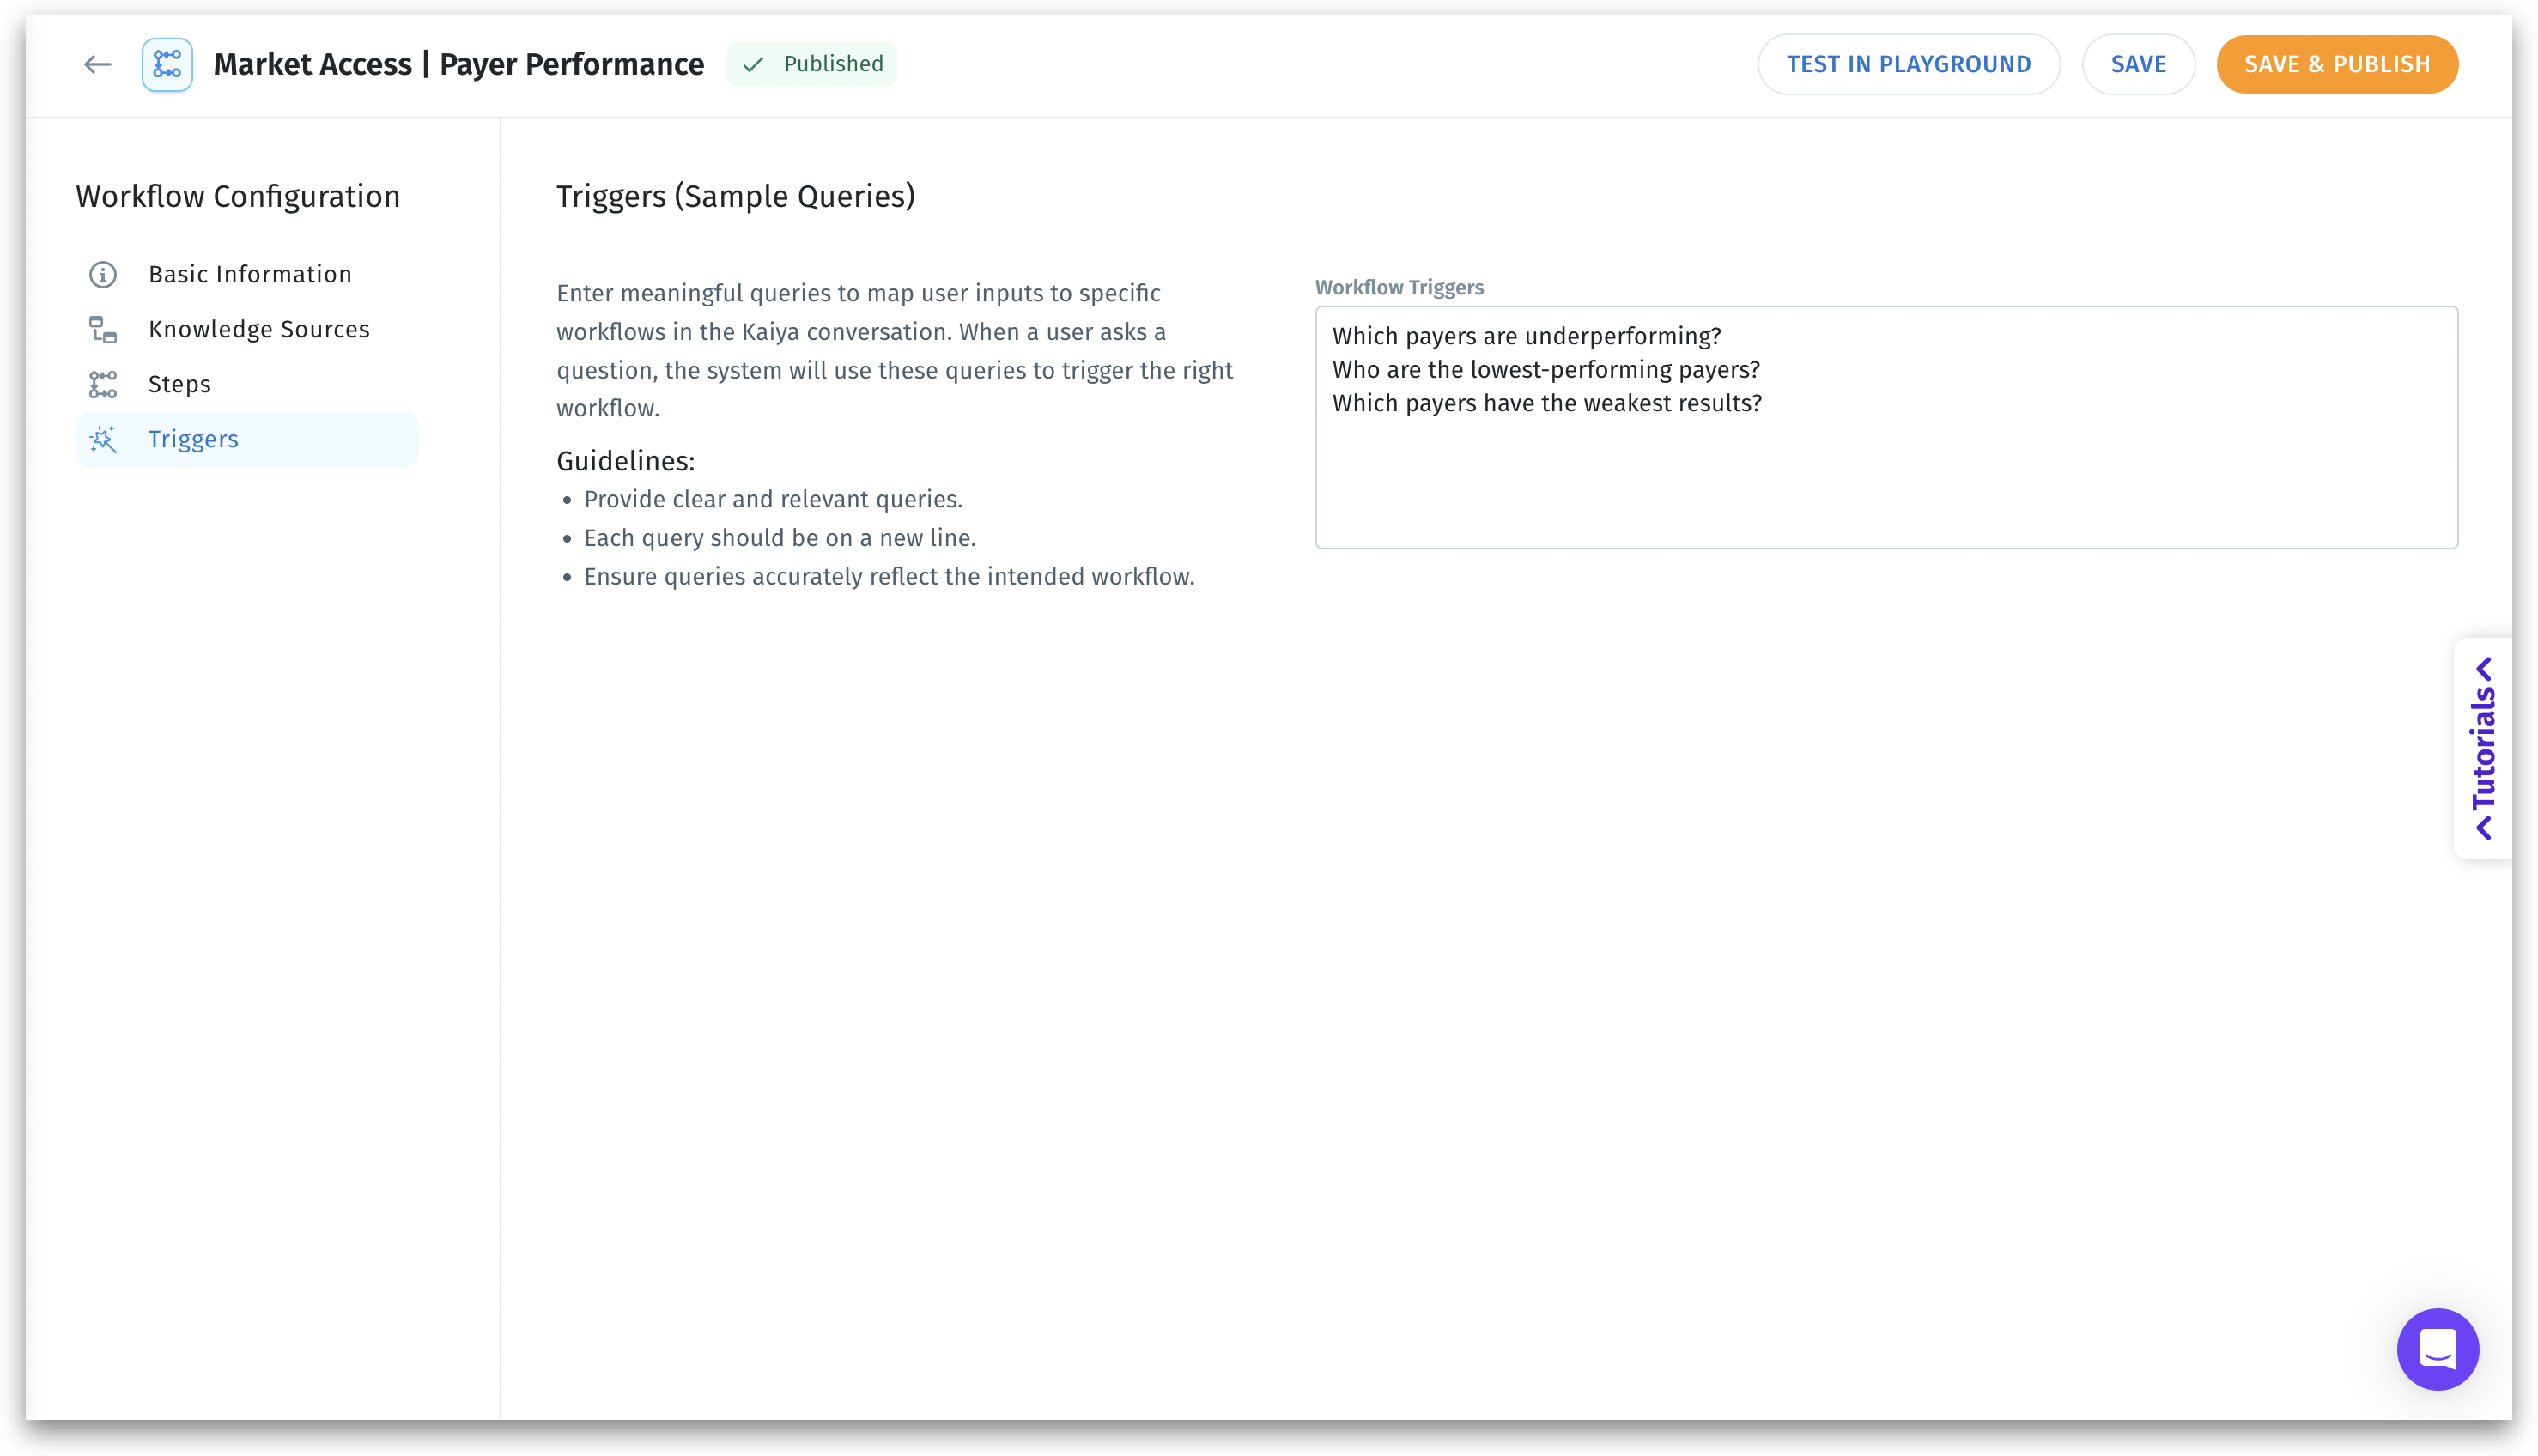
Each workflow becomes a living, reusable intelligence asset in your **Agent Library**, ready to trigger when you (or anyone in your team) asks the right question (as mentioned in the **Triggers** section).
Triggers section in Composer
Below are real, industry-relevant examples showing what you can build—organized by use case domain.
### 💊 **Pharma & Life Sciences**
#### Which payer plans are underperforming on TRx and why?
Analyze payer plans underperforming on TRx, segment by access restrictions or HCP tiers, and suggest data-backed contract renegotiation points.
#### Why is our new product launch lagging in key territories?
Identify territories or HCPs (Health Care Professionals) where a new launch is lagging, then break down messaging gaps, rep engagement, or access barriers.
#### What’s driving the recent drop in market share for Brand X?
Investigate market share erosion by segment, uncover if it's driven by new competitors, loss of exclusivity, or formulary exclusion.
#### Why is a high sampling rate not translating to scripts?
Analyze sampling and TRx data together to pinpoint why high sample volume isn't translating into prescriptions, by HCP or specialty.
### 💰 **Finance & FP\&A**
#### What’s causing the variance between actuals and forecast this quarter?
Automatically compute and visualize variances by department or cost center and identify drivers like overspend in labor or marketing.
#### Which teams or vendors are causing invoice delays?
Track invoice approval SLAs, highlight vendors or departments causing delays, and suggest automation or escalation points.
#### Why are our margins shrinking despite stable revenue?
Break down decreasing margins by region or SKU and isolate root causes like price cuts, cost increases, or channel mix shifts.
### 🛒 **Retail & CPG**
#### Which products should we discontinue to boost margin and reduce clutter?
Identify underperforming SKUs with low margin and high cannibalization impact, and generate a shortlist for discontinuation.
#### Did our last trade promotion actually drive incremental sales?
Measure uplift from trade promotions by channel or retailer and highlight where discounting didn’t drive incremental sales.
#### Why are we consistently facing out-of-stock issues for Product Y?
Track and explain frequent stockouts at a product or store level, connecting issues to supplier lead times or DC inefficiencies.
### 💼 **Sales**
#### Which reps are underperforming in high-potential territories?
Match rep performance to territory opportunity, flag underperformers in high-potential areas, and suggest redeployment.
#### Where are deals stalling in the pipeline and why?
Identify pipeline leaks by stage, region, or deal owner and determine whether the issue is conversion, qualification, or velocity.
#### Why did Region A miss their sales target this quarter?
Analyze why certain reps or teams missed quota—whether due to low volume, high-value deal loss, or lack of activity.
### 🚚 **Operations & Supply Chain**
#### Which warehouses or carriers are failing our delivery SLAs?
Track late deliveries, segment by carrier or warehouse, and surface which combinations are failing SLA the most often.
#### Where do we have excess inventory building up?
Identify aging or excess inventory by category, link to misaligned demand forecasts, and quantify holding costs.
#### Why are our supplier lead times increasing?
Highlight vendors with increasing lead times, compare to historical norms, and recommend vendor evaluation or escalation.
### 🏦 **Banking & Insurance**
#### What’s slowing down our claims approval process?
Diagnose delays in claims processing by team or system bottlenecks (manual review, missing info etc.), and suggest routing or staffing optimizations.
#### Which customer segments are showing high churn risk?
Use attrition analytics to flag customer segments with high churn risk, identify shared behaviors, and suggest outreach.
#### What’s behind the spike in fraudulent transactions this week?
Break down recent fraud spike by transaction type, location, and device to find patterns and recommend rules.
### 🌐 **E-commerce & Digital Business**
#### Why are customers abandoning carts before checkout?
Analyze drop-offs by device, page load times, and payment method to pinpoint why customers abandon checkout.
#### Why are return rates spiking for certain products?
Break down return reasons by product, geography, or channel to find quality or sizing issues affecting profitability.
#### Why did our latest email campaign underperform?
Understand why open or click rates dropped—by send time, device, campaign type—and test alternatives.
### 🧑🤝🧑 **HR & People Analytics**
#### Why are employees leaving our company in higher numbers?
Segment leavers by department, tenure, and performance score to uncover common causes behind churn.
#### Where are we losing candidates in the recruitment funnel?
Track where candidates drop off in the hiring process and determine whether it's role fit, offer rejection, or slow feedback.
#### Why are overtime costs rising in certain departments?
Identify teams or locations where overtime is growing unsustainably, and highlight workload or staffing issues.