> For the complete documentation index, see [llms.txt](https://help.tellius.com/llms.txt). Markdown versions of documentation pages are available by appending `.md` to page URLs; this page is available as [Markdown](https://help.tellius.com/settings/my-kaiya-credits.md).
# My Kaiya Credits
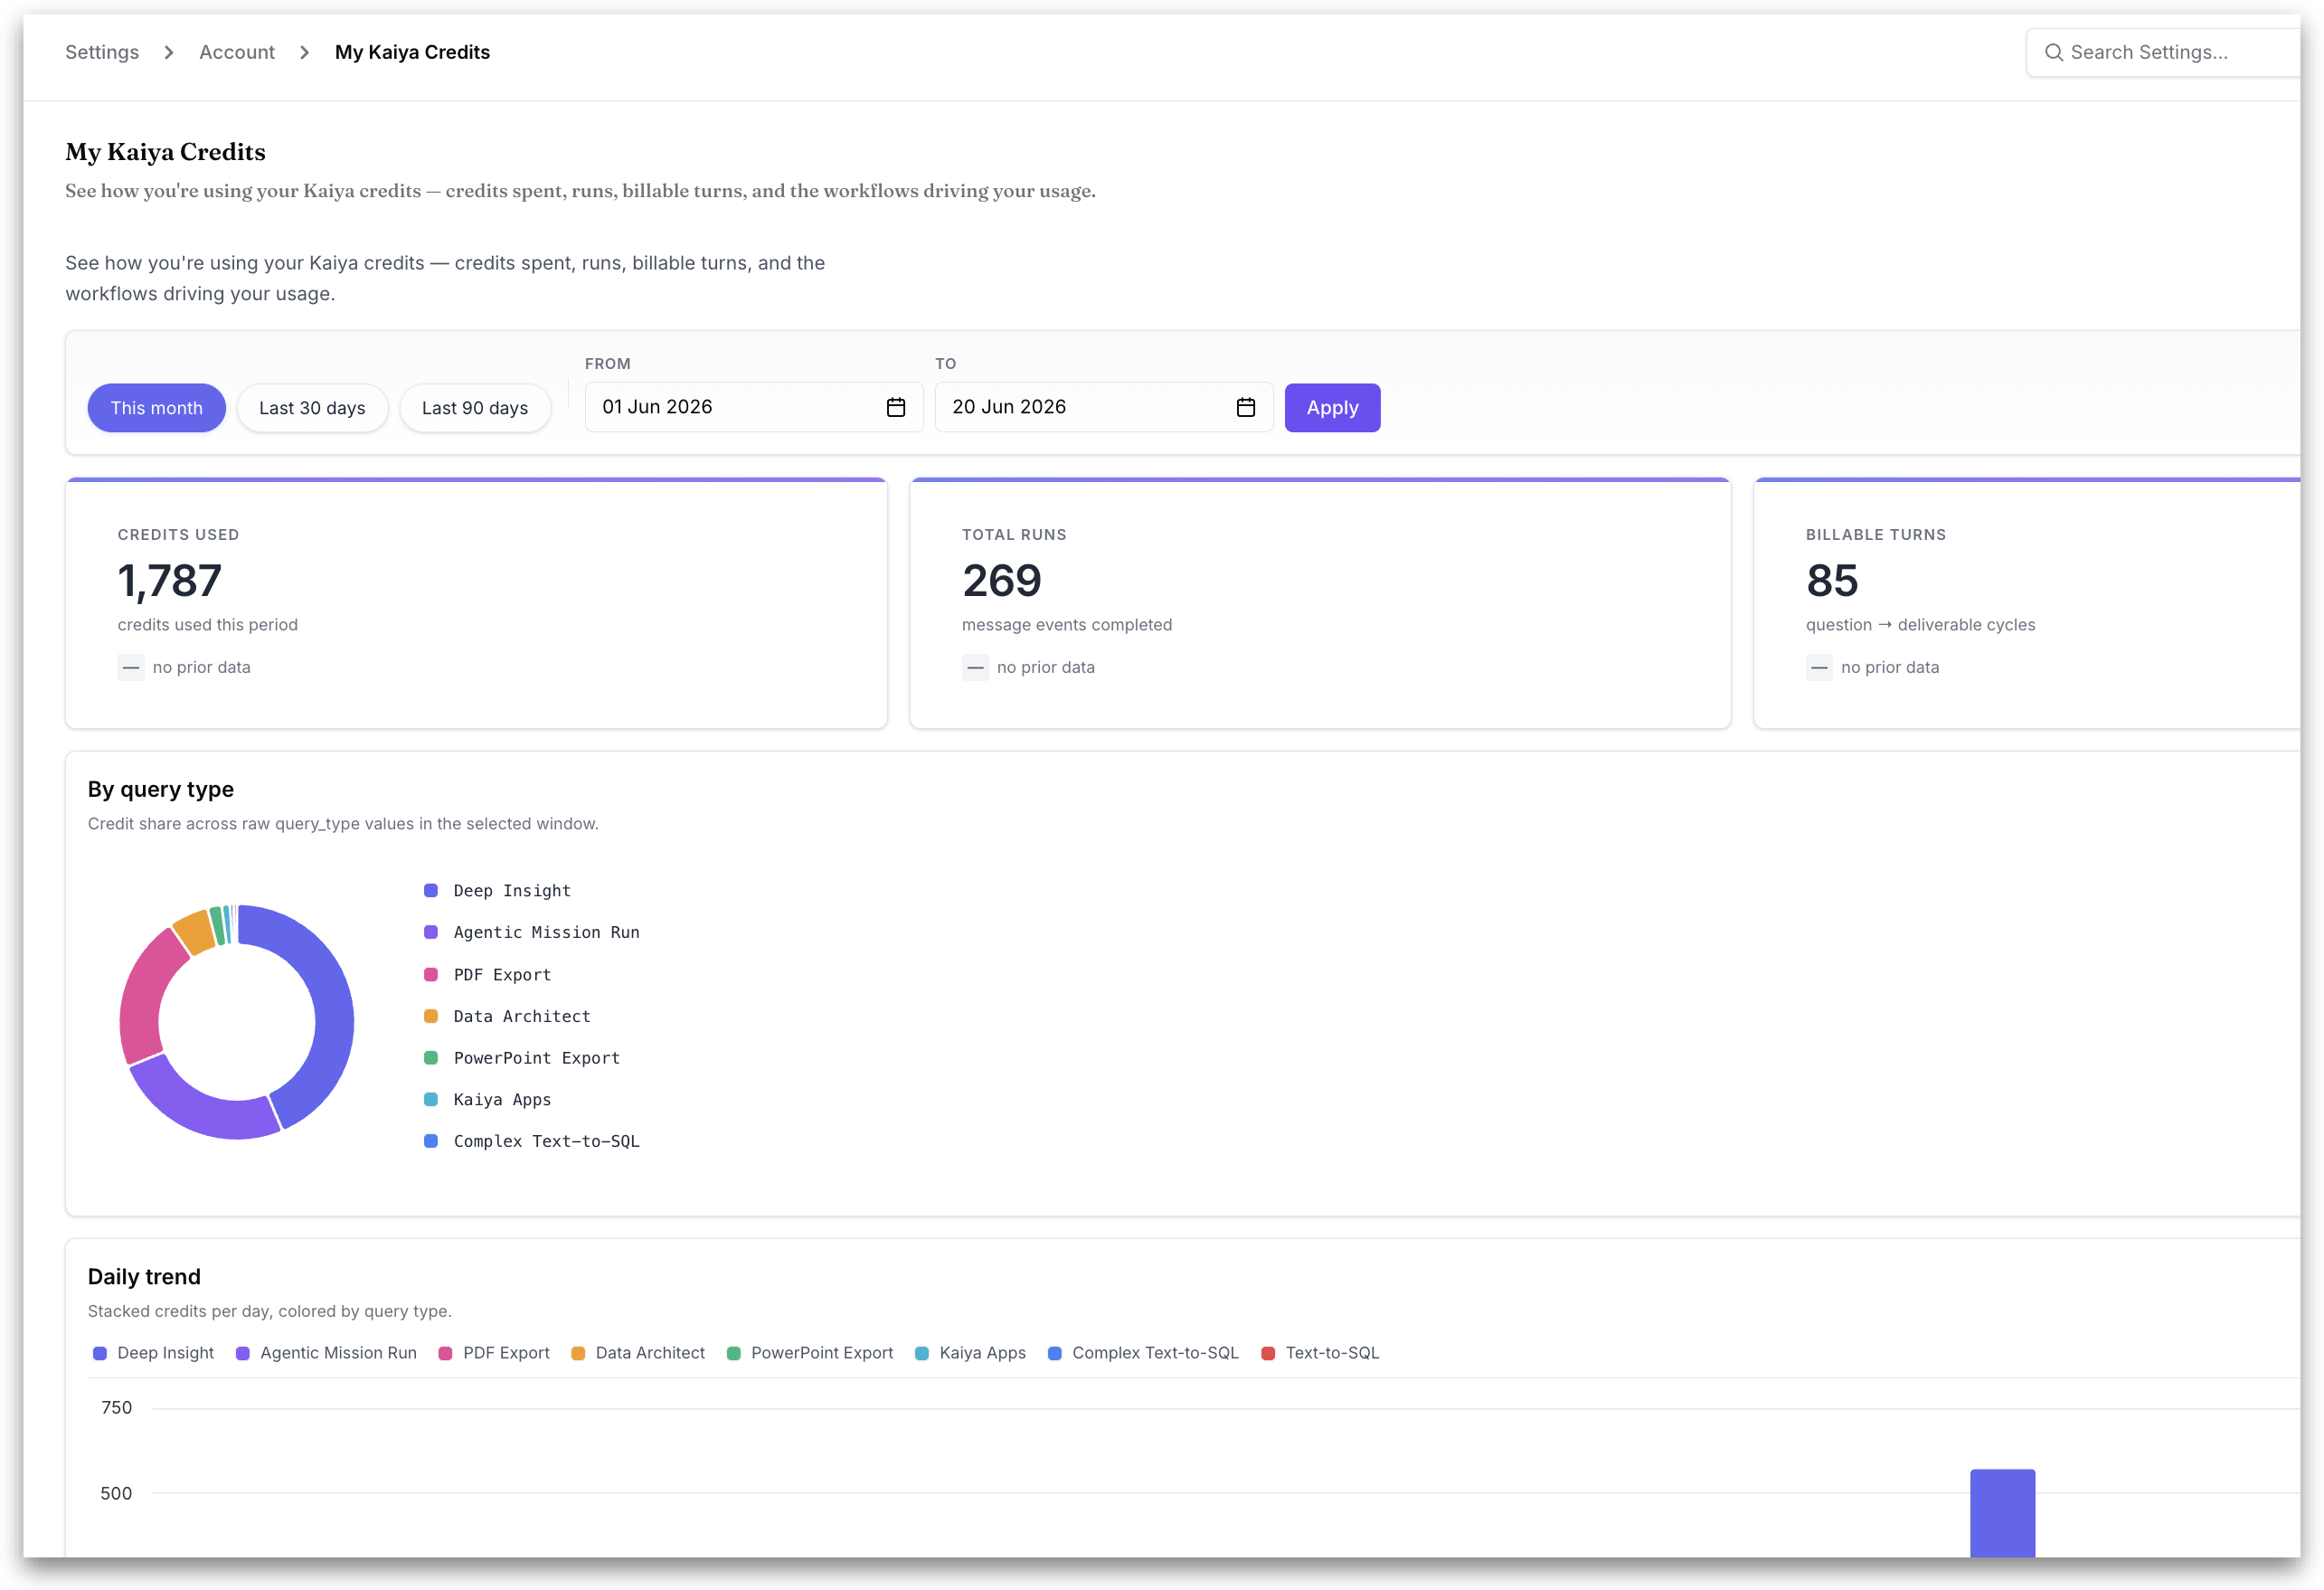
**My Kaiya Credits** shows how you're using your Kaiya credits: what you've spent, how much you've run, and which kinds of work are driving your usage. Use it to keep an eye on your own consumption so you can pace yourself before reaching any limits.
**Choosing a time range:** Pick a quick range (This month, Last 30 days, or Last 90 days), or set your own start and end dates in the **From** and **To** fields and click **Apply**. Click **Refresh** at any time to pull the latest figures for the range you've selected.
**Summary cards:** Three cards give you the headline numbers for the selected period:
* **Credits Used:** The total Kaiya credits you've consumed.
* **Total Runs:** The number of message events you've completed.
* **Billable Turns:** The number of complete question-to-deliverable cycles you've run.
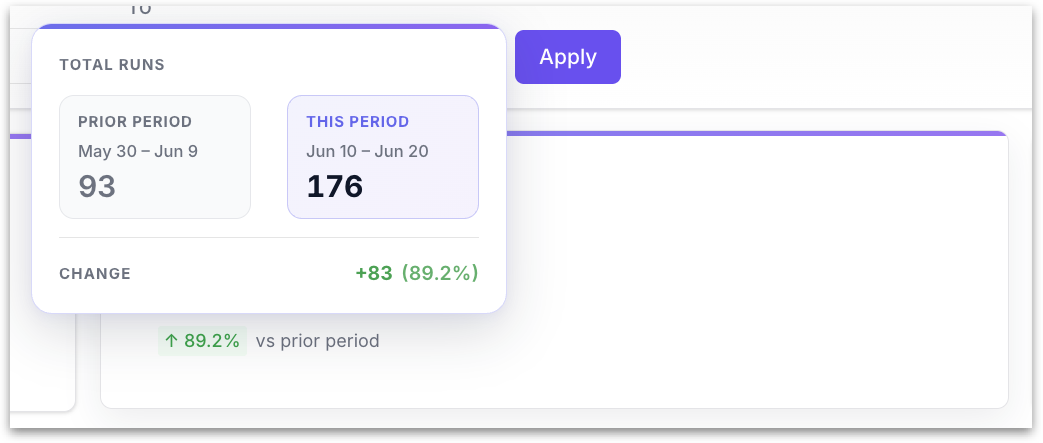
Each card also compares the current period against the one before it, so you can see whether your usage is rising or falling.
* When there's no earlier data to compare against, it shows "no prior data".
* When there is a prior period, hovering over a card opens a tooltip with the full breakdown: the value and date range for the prior period, the value and date range for this period, and the change between them shown both as an absolute number and as a percentage.
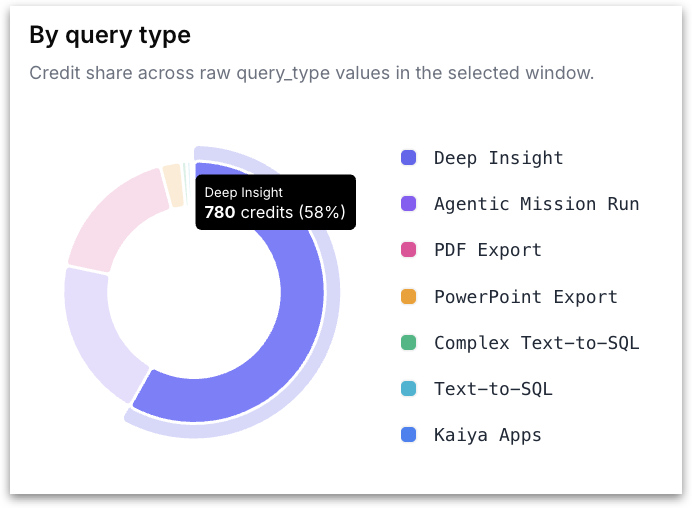
**By query type:** Breaks your credit spend down by the type of work you ran, so you can see at a glance which activities cost you the most. For example, Deep Insight, Agentic Mission Run, PDF Export, PowerPoint Export, Kaiya Apps, or Text-to-SQL. Use the **Chart / Table** toggle to view it as a share chart or as exact numbers.
Hover over any segment of the chart to see that query type's exact contribution — the number of credits it used and its percentage share of the total.
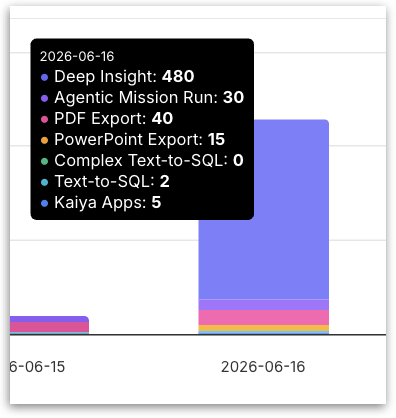
**Daily trend:** Shows the same credit usage day by day, stacked and color-coded by query type, making it easy to spot busy days and patterns over time. The **Chart / Table** toggle switches between the visual and the underlying figures.
Hover over any bar to see that day's full breakdown: the date, followed by every query type stacked in the bar with its credit count for that day: Deep Insight, Agentic Mission Run, PDF Export, PowerPoint Export, Complex Text-to-SQL, Text-to-SQL, and Kaiya Apps. This lets you see exactly what drove usage on a given day, not just the total.
---
# Agent Instructions
This documentation is published with GitBook. GitBook is the documentation platform designed so that both humans and AI agents can read, navigate, and reason over technical content effectively. Learn more at gitbook.com.
## Querying This Documentation
If you need additional information that is not directly available in this page, you can query the documentation by asking a question.
Perform an HTTP GET request on the following URL with the `ask` and `goal` query parameters:
```
GET https://help.tellius.com/settings/my-kaiya-credits.md?ask=&goal=
```
`ask` is the immediate question: it should be specific, self-contained, and written in natural language.
`goal` is what the user is ultimately trying to achieve, the reason they need the answer. Sharing it helps GitBook give you a better, more relevant answer. A goal is most helpful when it describes the outcome the user wants rather than restating the question. For example, with `ask=how do I create an API token`, a goal like `automate deployments from our CI pipeline` lets GitBook tailor the answer to that use case.
The response will contain a direct answer to the question and relevant excerpts and sources from the documentation.
Use this mechanism when the answer is not explicitly present in the current page, you need clarification or additional context, or you want to retrieve related documentation sections.