> For the complete documentation index, see [llms.txt](https://help.tellius.com/llms.txt). Markdown versions of documentation pages are available by appending `.md` to page URLs; this page is available as [Markdown](https://help.tellius.com/tellius-5.4/vizpads-explore/actions-in-edit-mode/viz-level-actions.md).
# Viz-level actions
Explore the suite of options to modify an individual chart in the Edit mode
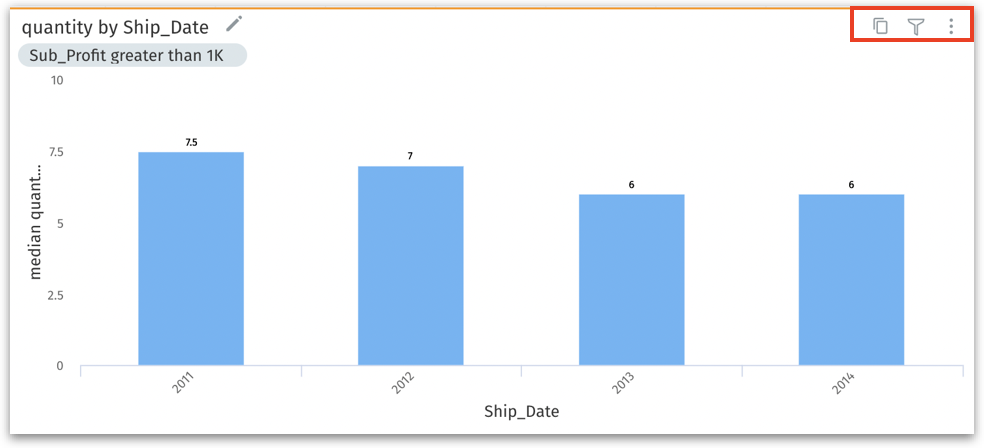
Each individual chart comes with the following options that could be used to make any changes to that specific chart.
Viz-level actions in Edit mode
* **Clone:** Click on **Clone** to duplicate the chart. This creates an exact replica within the same Vizpad tab, preserving all filters and settings.
* **Filter:** This is a local filter that applies filters to the individual chart. For more details, check out [this page](/tellius-5.4/vizpads-explore/applying-local-filters.md).
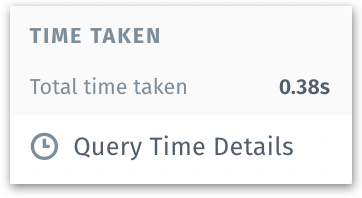
* **Three-dot menu:** It displays the time taken by Tellius and other external engines to load the individual chart. Click on **Query time details** to view the complete breakdown.
Time taken to load the chart
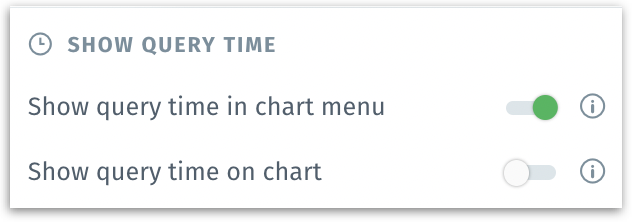
The visibility of this menu is based on the selection made in the **Show query time** menu in the Vizpad. For more details, check out [this page](/tellius-5.4/search/analyzing-search-results/time-taken-to-execute-a-query.md).
Show query time menu in the Vizpad
### Hover actions
When you hover over any chart in the Vizpad, the following options will be displayed.
* **Relocation:** A four sided arrow will be displayed in the top left corner of the chart, which can be used to move the chart around in the canvas. Drag and drop in the required location.
* **Delete:** A close button will be displayed in the top-right corner of the chart. Clicking on this will delete the chart.
* **Resizing:** An outward arrow will be displayed, which can be used to resize the chart as required.
* **Renaming:** Click on the pen icon next to the chart name to rename it.
### Changing the color theme
You can customize the color of the series in charts to match your preferences.
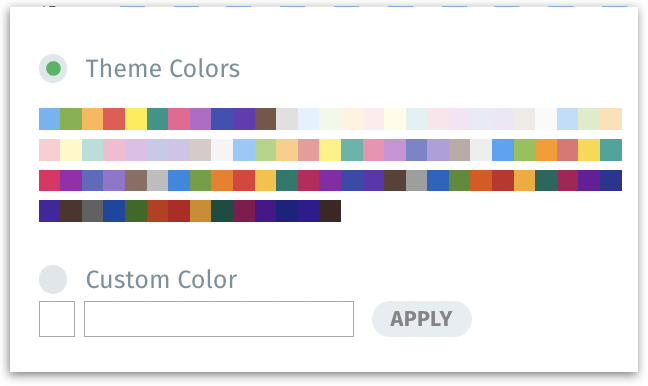
1. Click on the required chart to change its color theme.
2. Under **Theme Colors**, you'll be presented with a default palette of theme colors, curated to complement your visualizations.
3. For specific color scheme, choose **Custom Color** and input the hex color code. Click on **Apply** for the color to be reflected in the chart.
Changing the color theme
---
# Agent Instructions
This documentation is published with GitBook. GitBook is the documentation platform designed so that both humans and AI agents can read, navigate, and reason over technical content effectively. Learn more at gitbook.com.
## Querying This Documentation
If you need additional information that is not directly available in this page, you can query the documentation by asking a question.
Perform an HTTP GET request on the following URL with the `ask` and `goal` query parameters:
```
GET https://help.tellius.com/tellius-5.4/vizpads-explore/actions-in-edit-mode/viz-level-actions.md?ask=&goal=
```
`ask` is the immediate question: it should be specific, self-contained, and written in natural language.
`goal` is what the user is ultimately trying to achieve, the reason they need the answer. Sharing it helps GitBook give you a better, more relevant answer. A goal is most helpful when it describes the outcome the user wants rather than restating the question. For example, with `ask=how do I create an API token`, a goal like `automate deployments from our CI pipeline` lets GitBook tailor the answer to that use case.
The response will contain a direct answer to the question and relevant excerpts and sources from the documentation.
Use this mechanism when the answer is not explicitly present in the current page, you need clarification or additional context, or you want to retrieve related documentation sections.