# Chart level
Here are the steps to manage the display of time taken to load a chart:
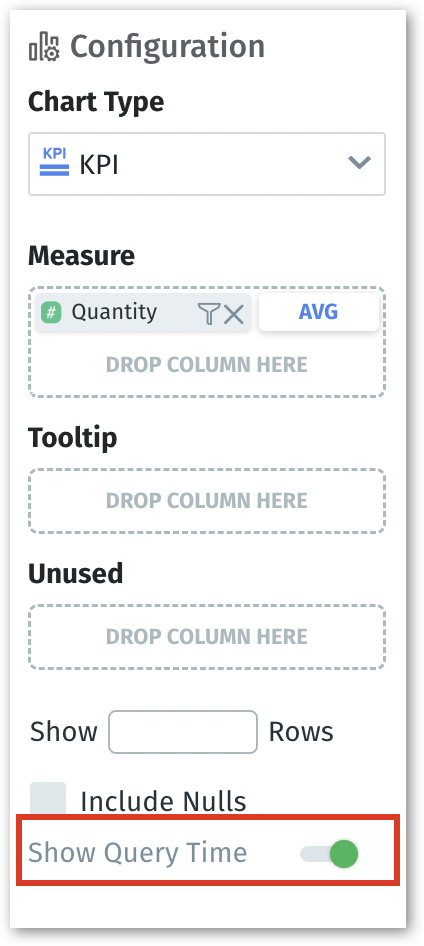
1. While editing a Vizpad, click on an individual chart to show/hide query execution time on that specific chart.
Show query time toggle for a chart
2. In the right Configuration pane, if **Show Query Time** toggle is enabled, then a three-dot kebab menu will appear on the top right corner of the chart.
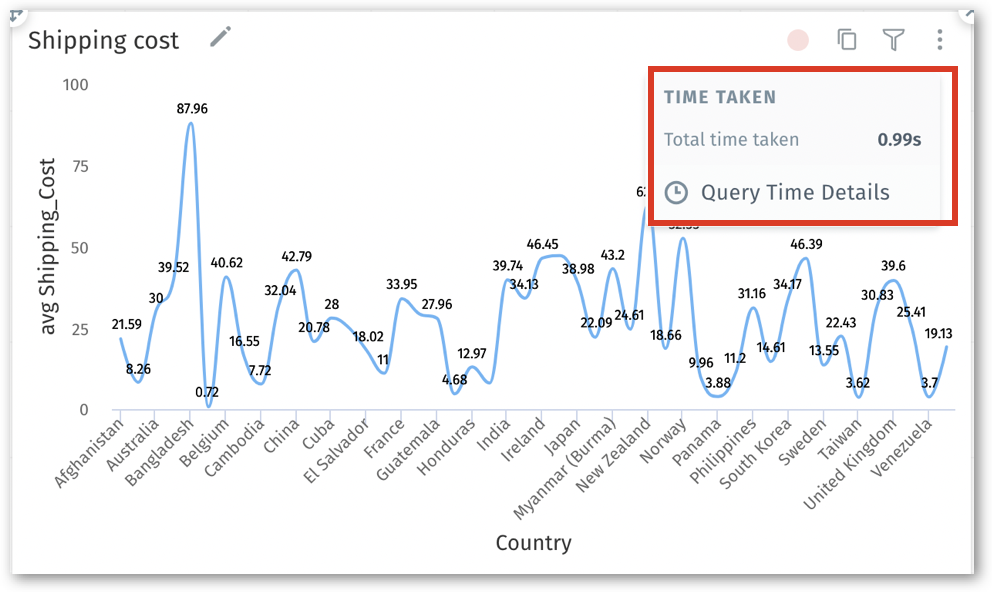
3. Click on the three-dot menu, and the time taken to execute a query will be displayed. Click on **Query Time Details** to view the breakdown of the time taken.
Query time displayed in chart menu
---
# Agent Instructions: Querying This Documentation
If you need additional information that is not directly available in this page, you can query the documentation dynamically by asking a question.
Perform an HTTP GET request on the current page URL with the `ask` query parameter:
```
GET https://help.tellius.com/tellius-6.3/vizpads-explore/time-taken-to-load-a-chart/chart-level.md?ask=
```
The question should be specific, self-contained, and written in natural language.
The response will contain a direct answer to the question and relevant excerpts and sources from the documentation.
Use this mechanism when the answer is not explicitly present in the current page, you need clarification or additional context, or you want to retrieve related documentation sections.