# Patch 4.2.1
The comprehensive changelog introduces a range of updates designed to significantly enhance both the functionality and user experience of the system. Administrators can now configure the query time inspector as well as the display of anomalies in Search and Vizpads. 4.2.1 also comes with a host of additional enhancements, including the improved positioning of control filters and the ability to populate zero values in heatmaps.
## **🚀 New features**
### **Optimizing performance through anomaly management**
Admins can now control the visibility of anomalies in line charts at different levels to improve the performance of Vizpads and Search.
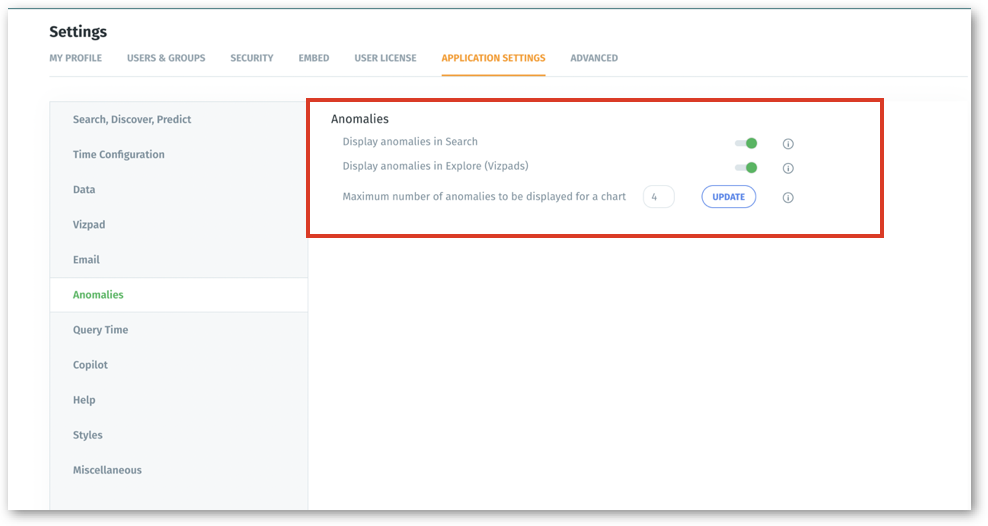
1. **Instance level:** Admins can toggle on/off the visibility of anomalies across the entire instance.
Instance-level anomaly management
Admins can also configure the maximum number of anomalies to be displayed for each chart. For charts exceeding the set limit, anomalies will be automatically hidden to avoid potential performance impact.
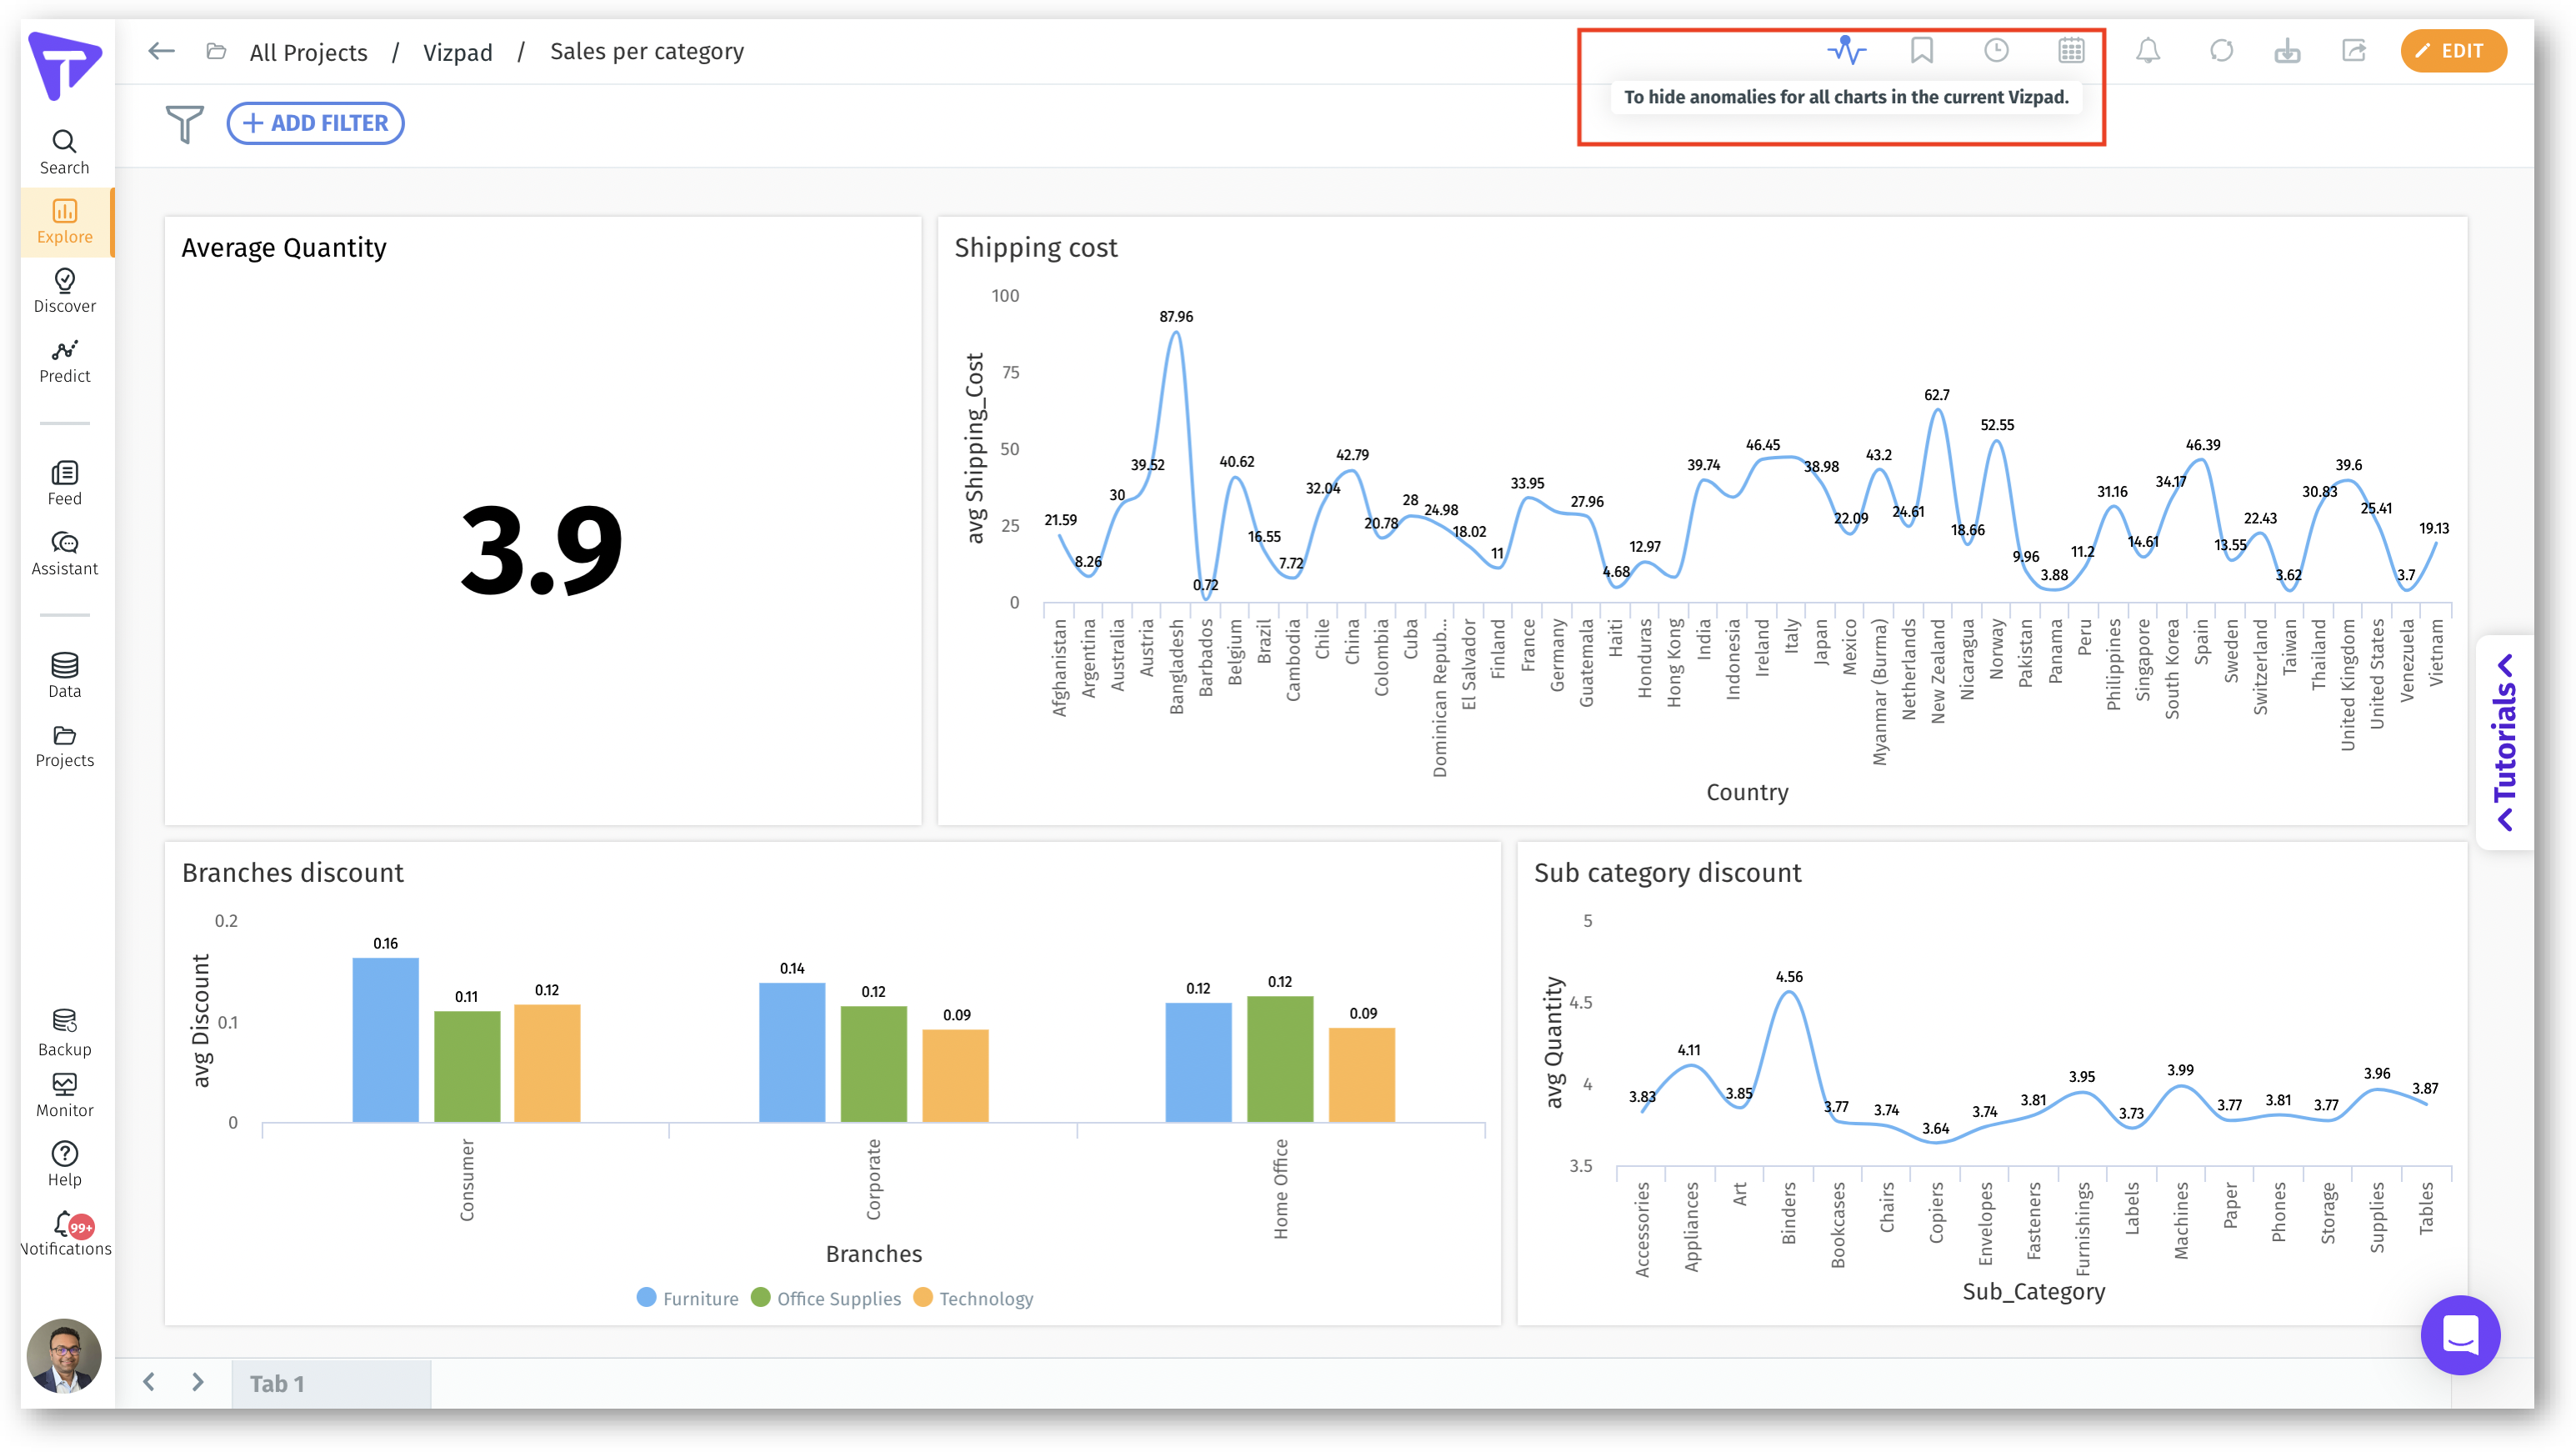
2. **Vizpad level:** Toggle buttons on every Vizpad enable users to show/hide anomalies for that particular Vizpad.
Vizpad-level anomaly management
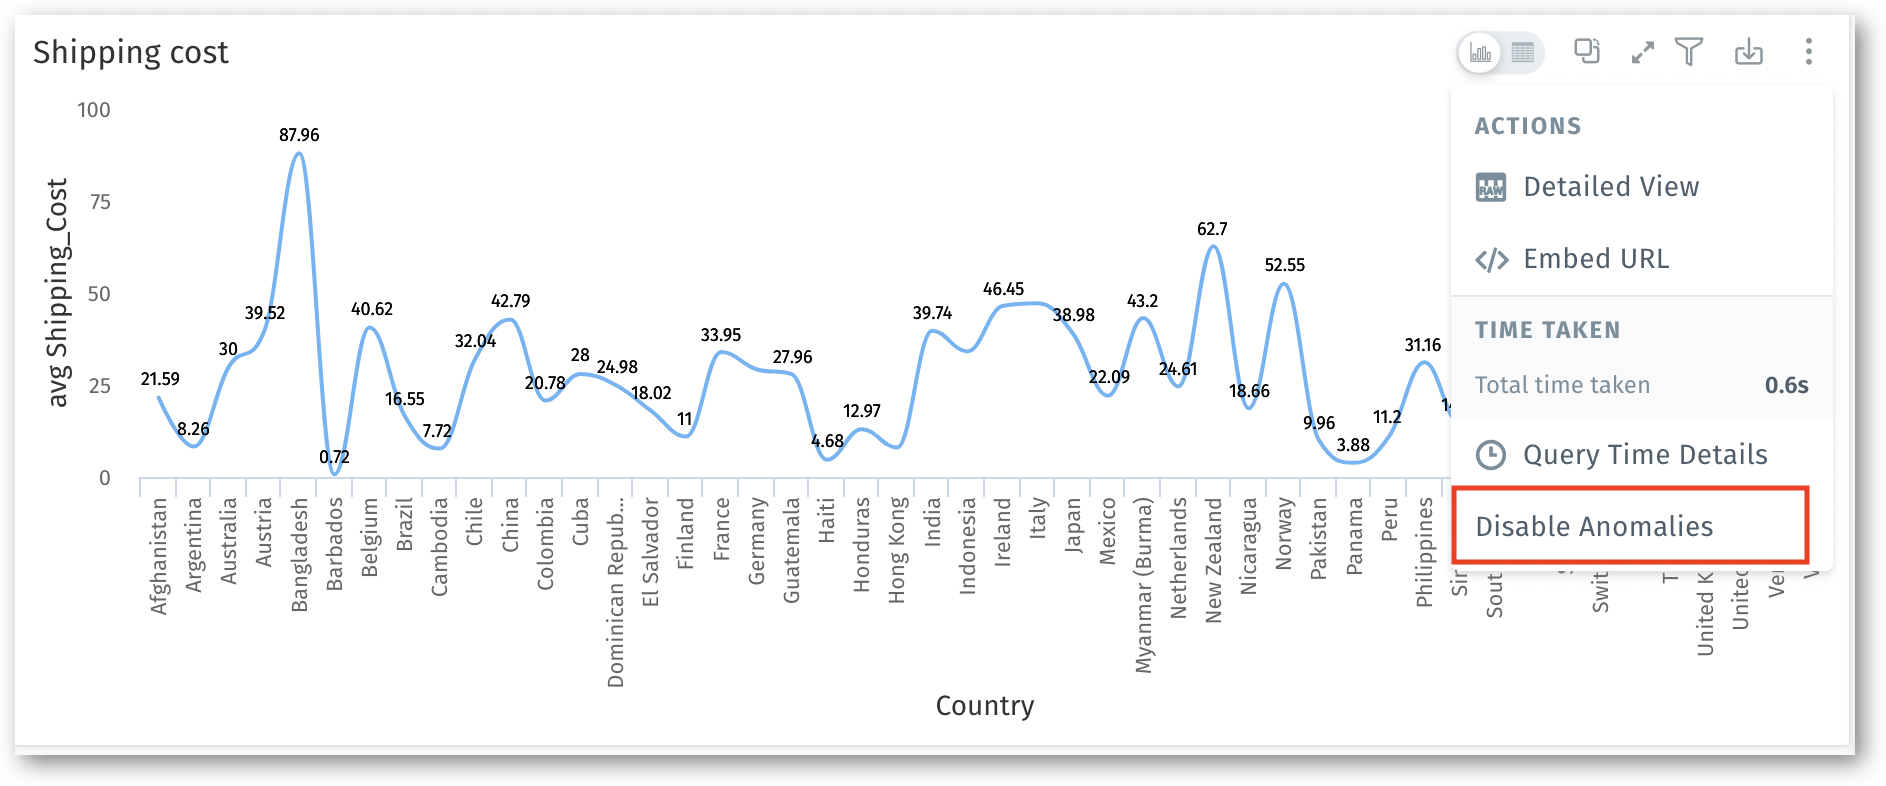
3. **Chart level:** To provide even more granular control, each individual chart in **Search** and **Vizpads** will include a toggle button to switch on/off the display of anomalies.
Chart-level anomaly management
### **Configuring query time inspector**
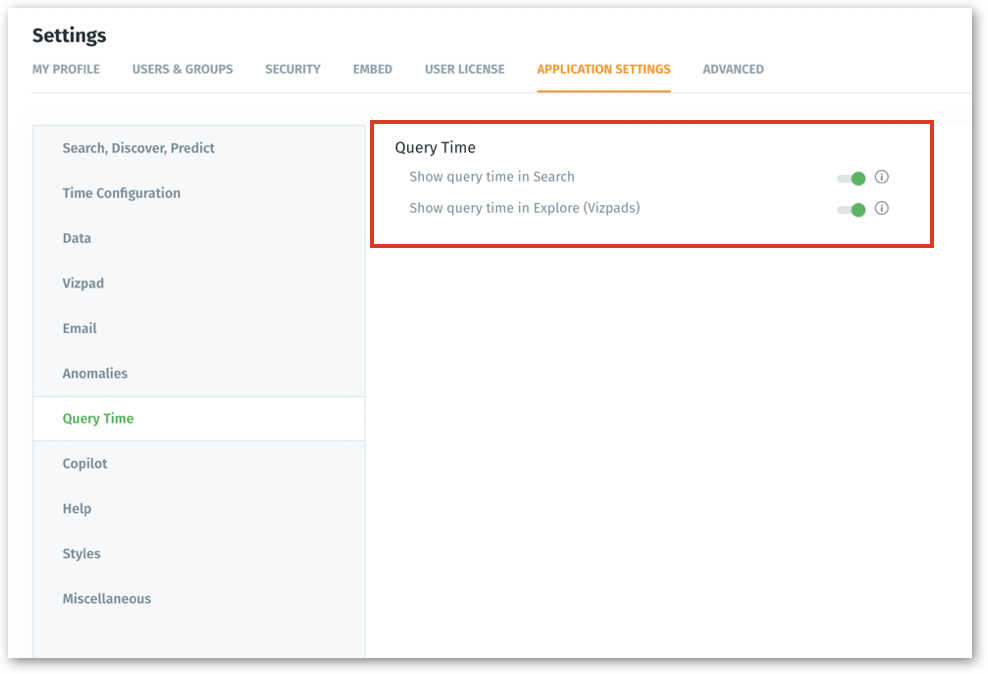
Admins can now enable/disable the display of query time inspector for Search and Vizpads. Under **Settings → Application Settings**, admins can choose whether they want to display the time taken to execute every search query.
Managing the query time
## **📈 Enhancements**
1. In Vizpads, users can configure the thickness of the ring found in donut charts.
Donut configuration
2. **Include zero values** option has been added to heatmaps to populate the empty space of the heatmap with zero values.
3. Similar to pivot tables, row total and column total have been added to heatmaps.
4. Tooltips have been added to show the complete text of **Job Type** column on the **Notifications** page.
5. The positioning of columns and icons has been updated on the **Notifications** page to improve user experience.
6. Live Insights can now be refreshed as required.
7. In Vizpads, **Advanced analytics** tab has been removed from the following places:
1. Pie chart
2. Donut chart
3. Table
4. Detailed table
5. Pivot table
6. Boundary map
7. Location map
8. KPI target
9. Funnel
10. Image
11. Text
8. Improved the positioning of Vizpad control filters. The **Selected** list of control filters has been updated to collapse by default.
9. When a new chart is added in Vizpads, the last active Business View or the default Business View will remain open in the side panel.
10. Users can now select the required data label to be displayed on scatter and bubble charts from the list of measures used.
11. Toast message has been included when the benchmark column has been changed in bar charts.
12. The Business View names will be fully visible in the Vizpad side panel.
13. Based on the position of the Viz in the Vizpad, the filter popup will be adjusted accordingly to avoid overlapping issues.
## **🛠️** **Minor fixes**
1. The issue with including/excluding columns while creating Insights has been fixed.
2. Resolved the issue with using special characters in display names for absolute or percentage changes in Vizpad.
3. The issues with displaying relevant Business View names on the Projects and Feed page have been resolved.
4. The Feed emails will contain greetings instead of mentioning the recipient names.
5. The issue with considering the filter value as a column name when resolution is added after the filter value has been fixed.
6. Resolved the occasional failure of Copy to System scripted dataset refresh.
7. Resolved an issue where failure to update usage data led to the removal of a dataset.
8. The issue with renaming columns in Snowflake live Business Views in Search and Vizpad has been fixed.
9. Addressed an issue where the cursor was incorrectly changing to a hand pointer outside the clickable area.
10. Corrected the **Edit** button behavior on the Metadata page to accurately reflect user permissions.
11. The issue with the clickable area for “**Use aggregated column from object**” option in Viz filter popup has been resolved.
12. Resolved the issue where the presence of newline characters was causing failure for new **Learnings**.
13. The issue with outer joins while creating Business Views from Spark SQL live connections.
14. Fixed the issue where marketshare (change and percentage change) related queries were not working on **Learnings** created in Search.
15. The issue with queries operating on samples during the creation of live Business Views with Synapse has been resolved.
16. The issue with providing input to **Help Us Learn** has been addressed.
17. Resolved the issue where the tooltip was displaying over the Viz-level filter component.
18. The issue with using Google Analytics connector has been resolved.