Explore Tellius Patch 5.1.1: Enhanced Vizpad controls, improved anomaly detection, and performance optimizations for a smoother analytics experience.
The version Tellius 5.1.1 comes with significant enhancements and updates, particularly the new user-group sync feature, which streamlines synchronization with Azure Active Directory (Azure AD). This version also includes improvements and bug fixes across Vizpads, Insights, and Feeds to improve user experience.
The user-group sync feature introduces automated synchronization between Azure Active Directory (Azure AD) and Tellius, streamlining user and group management. New users added to the specified Azure AD group gain appropriate access to Tellius automatically upon their first login, eliminating delays in account provisioning.
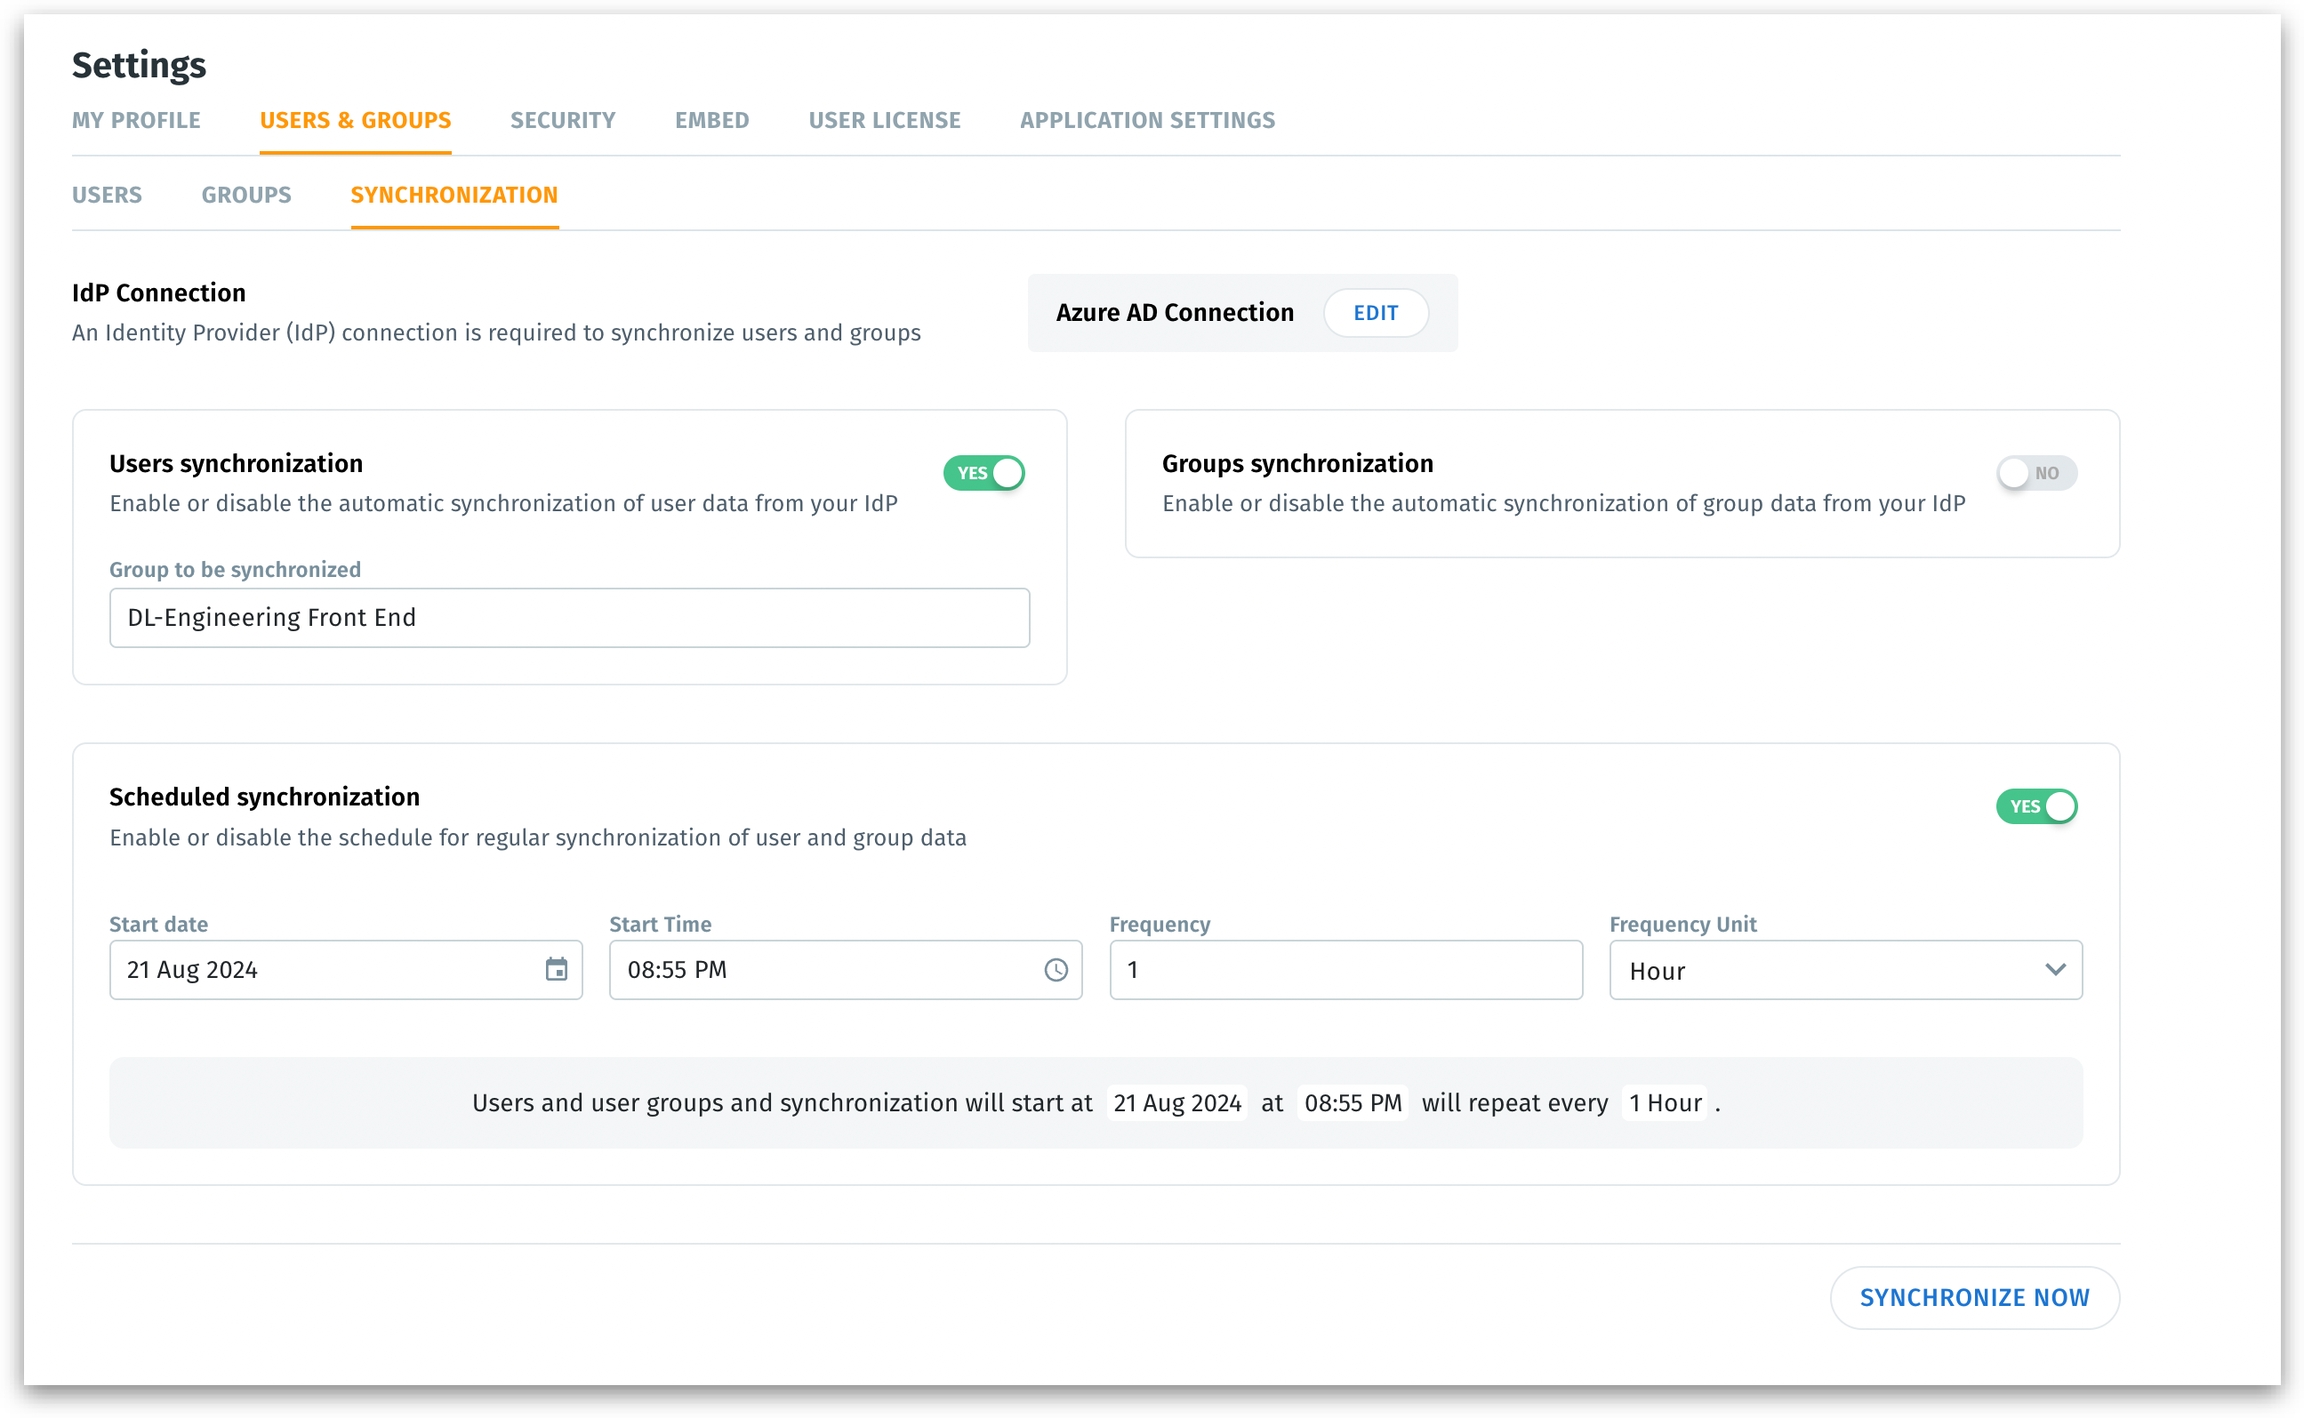
A new tab Synchronization has been added under Settings --> Users & Groups to manage up-to-date user records and access permissions from a single, unified interface, particularly for organizations using SAML authentication.
Admins can specify the required group for synchronization. Only existing users within this specified group will be managed and synchronized by Tellius.
Admins can filter the required groups to be synchronized. Deleting a group in Azure AD does not trigger the deletion of the corresponding group in Tellius, preventing unintended data loss.
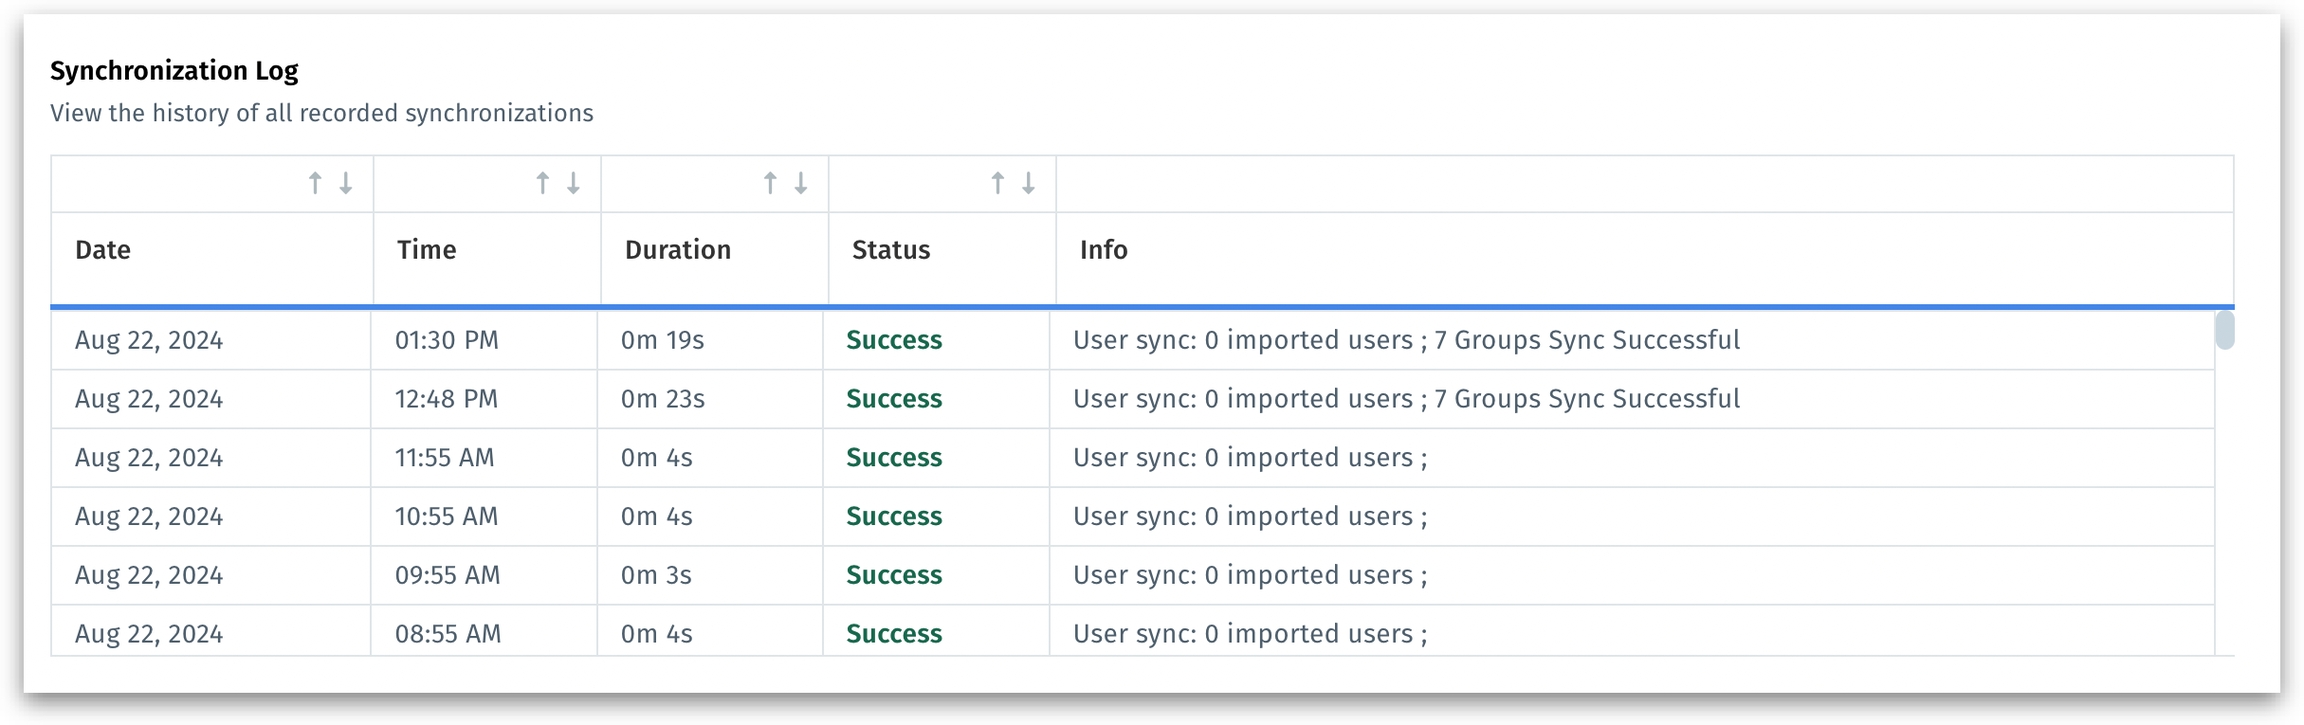
In addition to providing on-demand or scheduled synchronization, Tellius also provides detailed logs and status tracking for all synchronization tasks.
When user-group synchronization is enabled, the user-group management in Tellius will be automatically disabled and your IdP (in this case, Azure AD) becomes the sole source of truth for user-group management. Admins cannot add or remove users from groups directly within Tellius.
In the Notifications tab, improved error messaging for unsupported Discovery Insights using report-level columns.
Improved the email templates for alerts triggered from Feed.
Kaiya Learnings have been updated so that Business View Learnings now take precedence over System-level Learnings.
For Kaiya Search, improved entity recognition by rewriting prompts and updating merger rules.
Added support for connecting to OpenAI through Azure Service Principal, enhancing integration options.
In Vizpads, fixed the issue with dragging and dropping the columns into relevant fields in the Configuration pane due to tooltip overlapping.
In Vizpads, fixed the issue with axes labels overlapping with the charts.
Fixed the issue with displaying the updated dataset metadata length after every refresh.
Resolved the issue with reconfiguring failed Trend drivers from the Notifications tab.
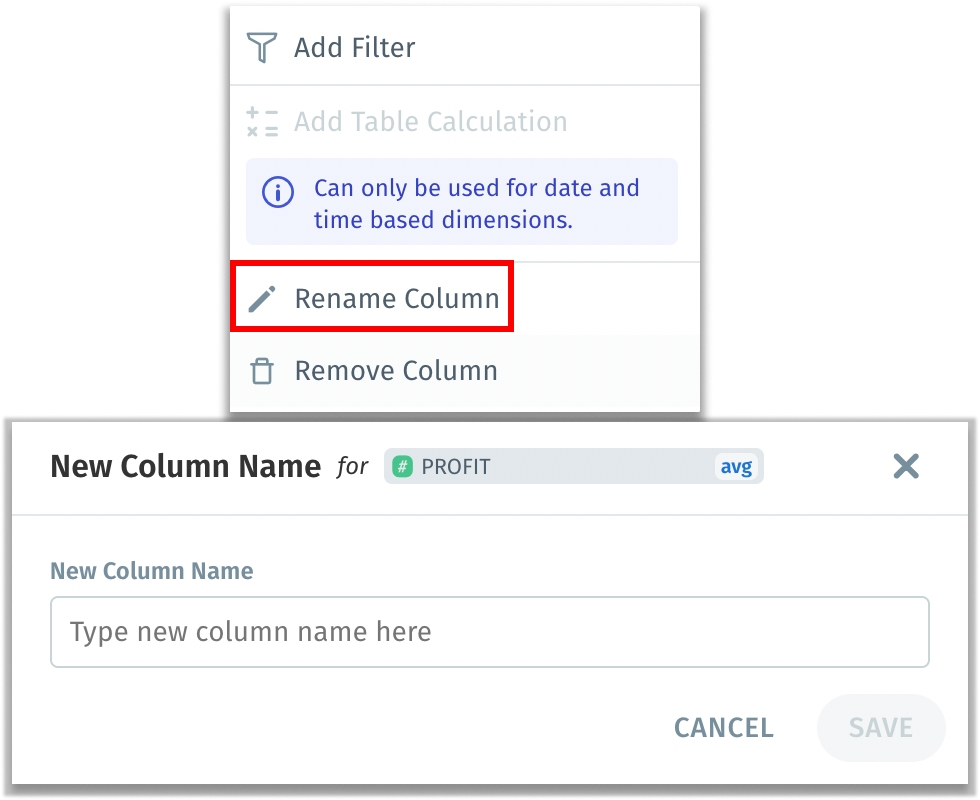
In Vizpads, provided informative tooltip when adding alias names to columns for additional context.
Corrected an issue where Feeds created at different times for the same metric incorrectly displayed the Feed creation time.
Resolved the issue with incorrect redirection on clicking the “Show Why” button for comparison driver Insights.
When rerunning Discovery Insights, fixed the issue with displaying aggregations for the column-level formula used.
In Vizpads, fixed the issue with displaying relevant results when “Minimum” aggregation was selected for treemaps.
In Vizpads, fixed the issue with uploading images as comment replies for tables.
For tables in Vizpads, fixed the issue with displaying the three-dots menu for measures added in Sort by Rows and Sort by Columns fields in the Configuration pane.
When editing Discovery Insights, the included and excluded columns will now be displayed correctly in the leftmost pane.
In Vizpads, resolved the issue where labels were incorrectly displayed when switching from a 100% stacked bar chart to an unstacked bar chart.
Explore Patch 5.1.3: Enhanced Vizpad performance, improved anomaly detection, and critical bug fixes for a smoother analytics experience.
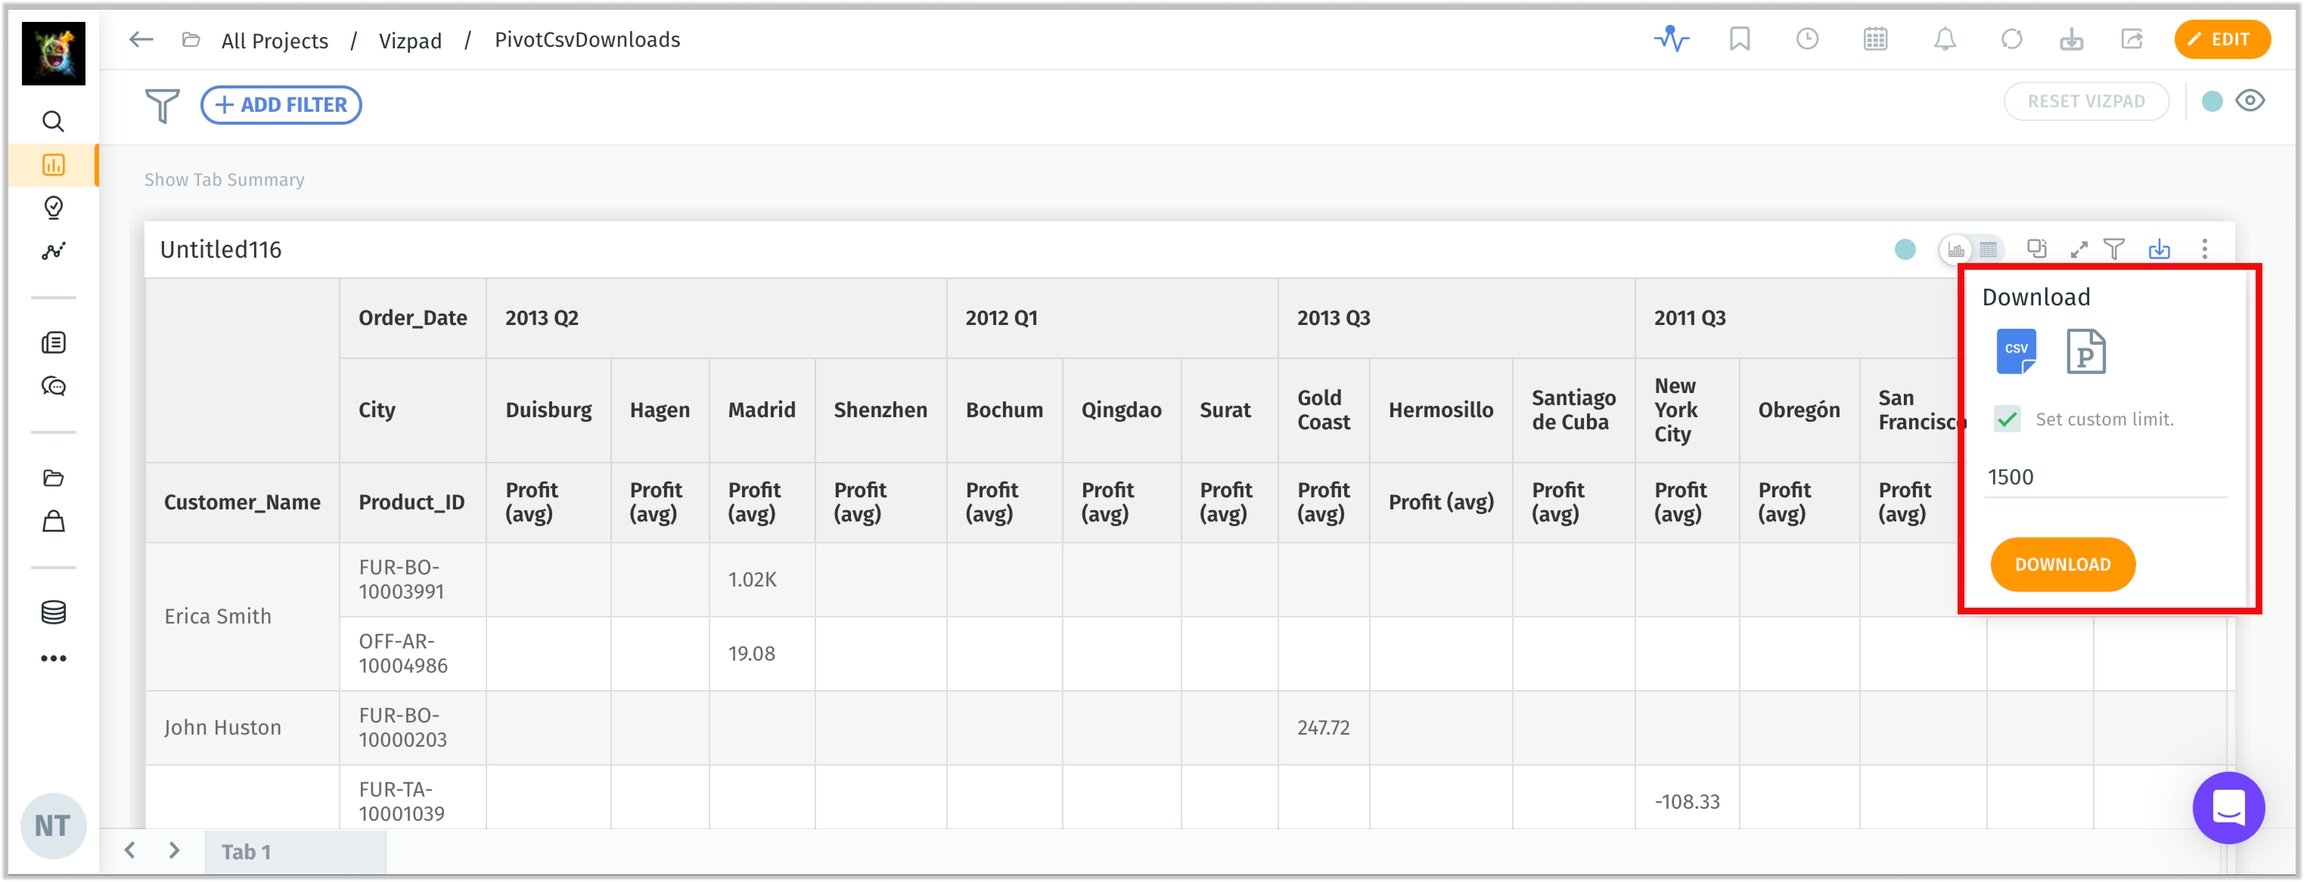
The 5.1.3 release brings significant enhancements and numerous minor fixes. The key update is the ability to set custom row and column limits when exporting pivot tables, now supporting up to 20,000 data points for greater flexibility. We've also addressed various issues across Feed, Vizpads, Search, and Data preparation, enhancing functionality and ensuring smoother performance.
Users can now set custom row and column limits when exporting pivot tables. If a custom limit is specified during the download process, it will override the default UI settings, up to a maximum of 20,000 data points. This enhancement applies to both CSV and XLSX pivot table exports.
In Feed, fixed the “Show Insight” button which was greyed out in embed mode.
In Vizpads, resolved the issue with applying decimal number formatting.
Resolved the issue with capturing usage data for search queries.
In Vizpads, fixed the issue with adding multiple calculated columns with aggregations for tables.
Resolved the issue with generating Feed that was created with weekly aggregation.
In Feed, fixed the issue with applying formatting for the columns used in that particular Feed.
In Vizpads, fixed the issue with displaying the relevant factors after switching between New and Trained Data for explainable AI charts.
In Feed, resolved the issue with hiding Show Insight and displaying Generate Insight while embedding.
Under Data → Business Views, resolved issues to ensure appropriate access rights for view only users.
In Search, resolved the UI issue with the proper display of date filter window when trying to apply date filters from the measures in the Configuration pane.
Resolved the issue where Feed and Insights were unable to be embedded.
In Vizpads, resolved the issue with retaining the modified table widths after saving the Vizpad.
Resolved the issue with retaining the user-defined aggregation when creating Insights from a Feed.
In Search, fixed the issue with the incorrect display of dates in date picker when applying date filters in Configuration pane.
In Vizpads, resolved an issue where the value 1 and value 2 were swapped in comparisons affecting percentage, absolute, and market share calculations.
In default Search mode, fixed the issue with auto-selecting the relevant Business View.
In the results of Key Driver Insights, resolved the issue with displaying the original column name instead of the display name in the Insights Summary section.
When importing the exported object and trying to map the relevant Business Views and datasources, fixed the issue where calculated columns were getting duplicated.
In Feed, resolved the issue with handling zero or null values.
Under Data → Prepare → Scripting, resolved an issue where updating the source of a scripted dataset validated the entire dataset instead of sample data, leading to timeouts.
Under Data → Business View → Calculated columns, added a "No rows to show" message when the preview result is empty, informing users when no rows are available.
In Search, fixed the issue where reopening the “Help Us Learn” popup didn’t retain the time filters mapped and duplicated words to be displayed in the original query text.
In Search history, fixed the issue with retaining the search queries marked as favorite after a page refresh.
Improved the structure and content of Feed alert emails.
In Vizpad charts, resolved an issue where the Y-axis range was not recalculated to include Y-axis target lines or data points outside the current minimum and maximum values.
In Vizpads, fixed the issue with retaining the table cell comments after refresh when moving window calculated columns and date-related columns are present.
In Vizpads, resolved the issue with the global filter pill not synchronized with the multi-select control filters, after cloning the Vizpad.
Resolved an issue where updates to a user's first and last names in the identity provider (IdP) were not reflected in Tellius during subsequent SAML logins if these fields were initially left blank in the first login.
Fixed the issue with generating Insights for Feed created with dimension drilldown.
In Feed, fixed the issue with showcasing display names (instead of the original column names) in the descriptions of Drilldown measures across dimensions.
In Search, fixed the issue where the complex case statements with three or more nested levels weren't working properly, especially in queries used for calculating market share.
Under Data → Prepare → Metadata → Edit, fixed the issue with generating Display names (using Kaiya) for empty cells.
Users can now specify a custom SAML field to map to the username (by default it maps to email) in Tellius. A configuration option allows you to set which SAML attribute should be used as the username during SAML authentication.
In Vizpads, fixed the issue where the “Include current {time-frame}” checkbox in date picker window not getting reflected as per the toggle made under Settings → Application Settings → Time Configuration.
Explore Tellius Patch 5.1.2: Enhanced Vizpad performance, improved anomaly detection, and critical bug fixes for a smoother analytics experience.
We're excited to announce the release of version 5.1.2, which brings a significant enhancement to our Feed feature, along with numerous improvements and bug fixes across the platform. This version focuses on improving the user experience, enhancing security, and increasing the reliability of our Vizpads, Insights, and data handling capabilities.
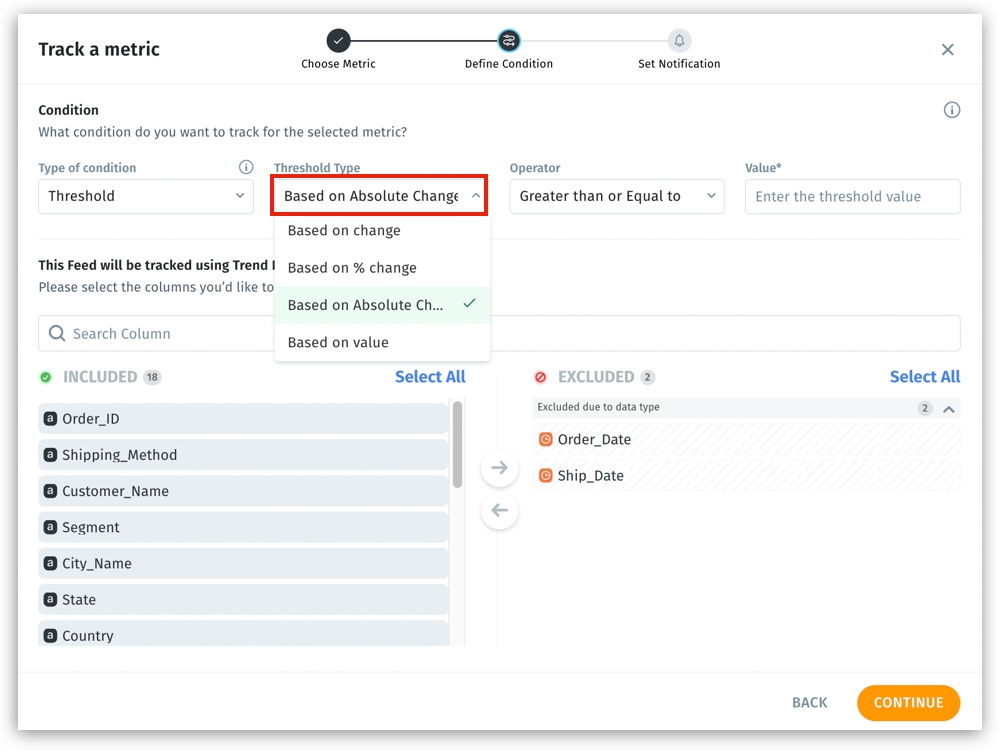
We've added another enhancement to our Feed's threshold-based alerting system. In addition to the existing options of "Based on value", "Based on change," and "Based on % change", we've introduced a new alert type: "Based on Absolute Change”, which alerts based on the magnitude of change, regardless of direction. This allows you to track significant shifts in your metrics whether they're increases or decreases, ideal for identifying any substantial movement that requires attention, and also preventing you from setting separate alerts for positive and negative changes.
For example, you can set an alert to trigger if daily active users change by more than 1,000 in either direction. This allows you to quickly identify and respond to significant fluctuations in user activity, whether it's a sudden increase or decrease.
In Vizpads, resolved an issue where pivot tables weren't displayed properly when global filters were changed, especially after adding 4-5 charts.
Removed SQL scripts like calculated column formulas from the Insight and Vizpads APIs to prevent potential firewall blocking.
Fixed the formatting updates done for measures from the Prepare page weren’t getting reflected in the associated Business View.
When setting up Feed, the UI issues with displaying the “Back” button and scrolling issues have been resolved.
When editing Insights, improved the ability to drag and drop columns for filtering.
In Vizpads, fixed an issue where sort configurations applied in pivot tables weren't being maintained after saving and reopening.
In Vizpads, fixed the functionality of Top N/Bottom N filters for pivot charts.
Implemented critical security updates, strengthening our API authentication protocols and improving the handling of user-uploaded content.
Improved the readability and UI for the “Edit Column Group” popup under Data → Business View.
In Vizpads, fixed the issue with scrolling and handling null values for pivot tables.
Under Notifications → View details, improved the error message when connection timed out due to email server connection.
Under Notifications, resolved the issue with displaying the status of failed Feed.
Resolved the issue with displaying results for a search query after updating it in the Search Guide.
Fixed an issue where row-level data restrictions were not being properly applied when users published Business Views.
Fixed the issue where “Include current time” checkbox in the popup for time/date-based dimensions wasn't reflecting based on system settings.
Resolved an issue where Favorite Insights weren't opening properly when selected from the side panel in the Favorite Insights popup.
Corrected a problem where the “Offline Render” option under Settings → Miscellaneous → Report Configuration settings was showing as disabled after page refresh.
In Vizpads, fixed an issue where opening one filter wasn't closing previously opened filter popups.
In Search, resolved the issue with displaying the relevant sample queries as per the selected Business View after updating the Search Guide.
In Vizpads, updated the UI of the “Download” option for tables and pivot tables.
In Vizpads, resolved the issue with aligning the tooltips with the selected columns in the Configuration pane.
In Vizpads, resolved the issue with retaining custom theme colors for a chart, especially after changing alias names for columns associated with that chart.
In Vizpads, rectified the issue that prevented column drag-and-drop within Configuration pane due to tooltip overlap.
Fixed a problem where the dataset size wasn't being updated after the refresh flow.
Under Notifications, updated the error message displayed when the status failed for the creation of discovery Insights with report level columns.
In Vizpads, resolved an issue where filter popups were closing unexpectedly when scrolling.
Under Data → Business View → Learnings → NLP, fixed the issue with deleting the required, individual Learning.
Under Settings → Application Settings → Email, provided the relevant title and description for the page.
In Vizpads, fixed the issue with applying control filters for Keep action when date columns are involved.
In Vizpads, resolved an issue where the colors for line charts were not ordered according to the selected columns in the Configuration pane.
In Insights, fixed the issue with displaying the accurate dates in the “Why” section.
In Vizpads, fixed the issue with displaying the local filter for every chart when multiple charts are arranged in the Vizpad.

Discover Tellius 5.1: Unveil long-term trends with moving window calculations, enhanced Kaiya Search, and revamped Feed for smarter analytics.
Tellius 5.1 is our response to your real-world challenges. Our enhanced Kaiya Search now understands your complex, verbose queries, cutting through jargon to get you the insights you need. The new moving window calculations reveal long-term trends that were previously hidden in the noise. Explore every detail and monitor metrics more comprehensively with our reinvented Feed. We've also boosted security and squashed bugs, because we’re committed to making your work easier, faster, and more impactful.
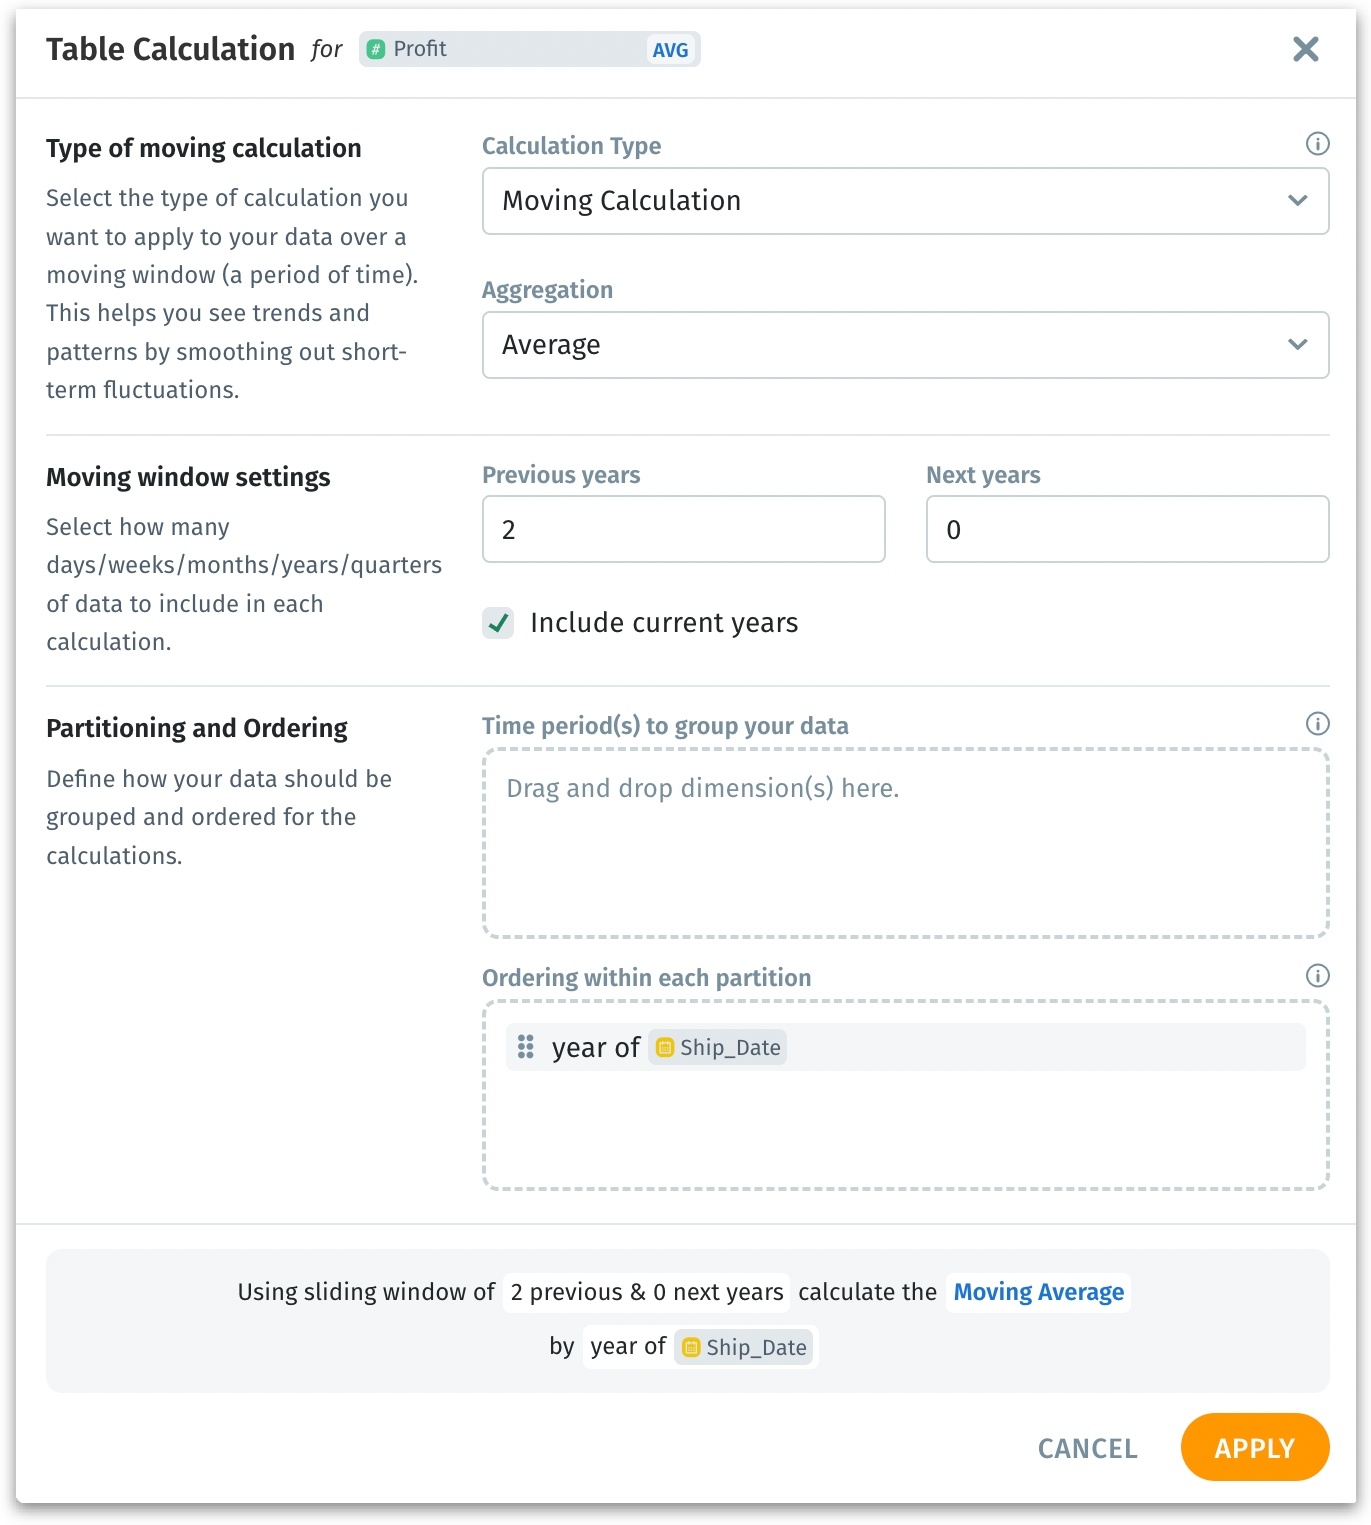
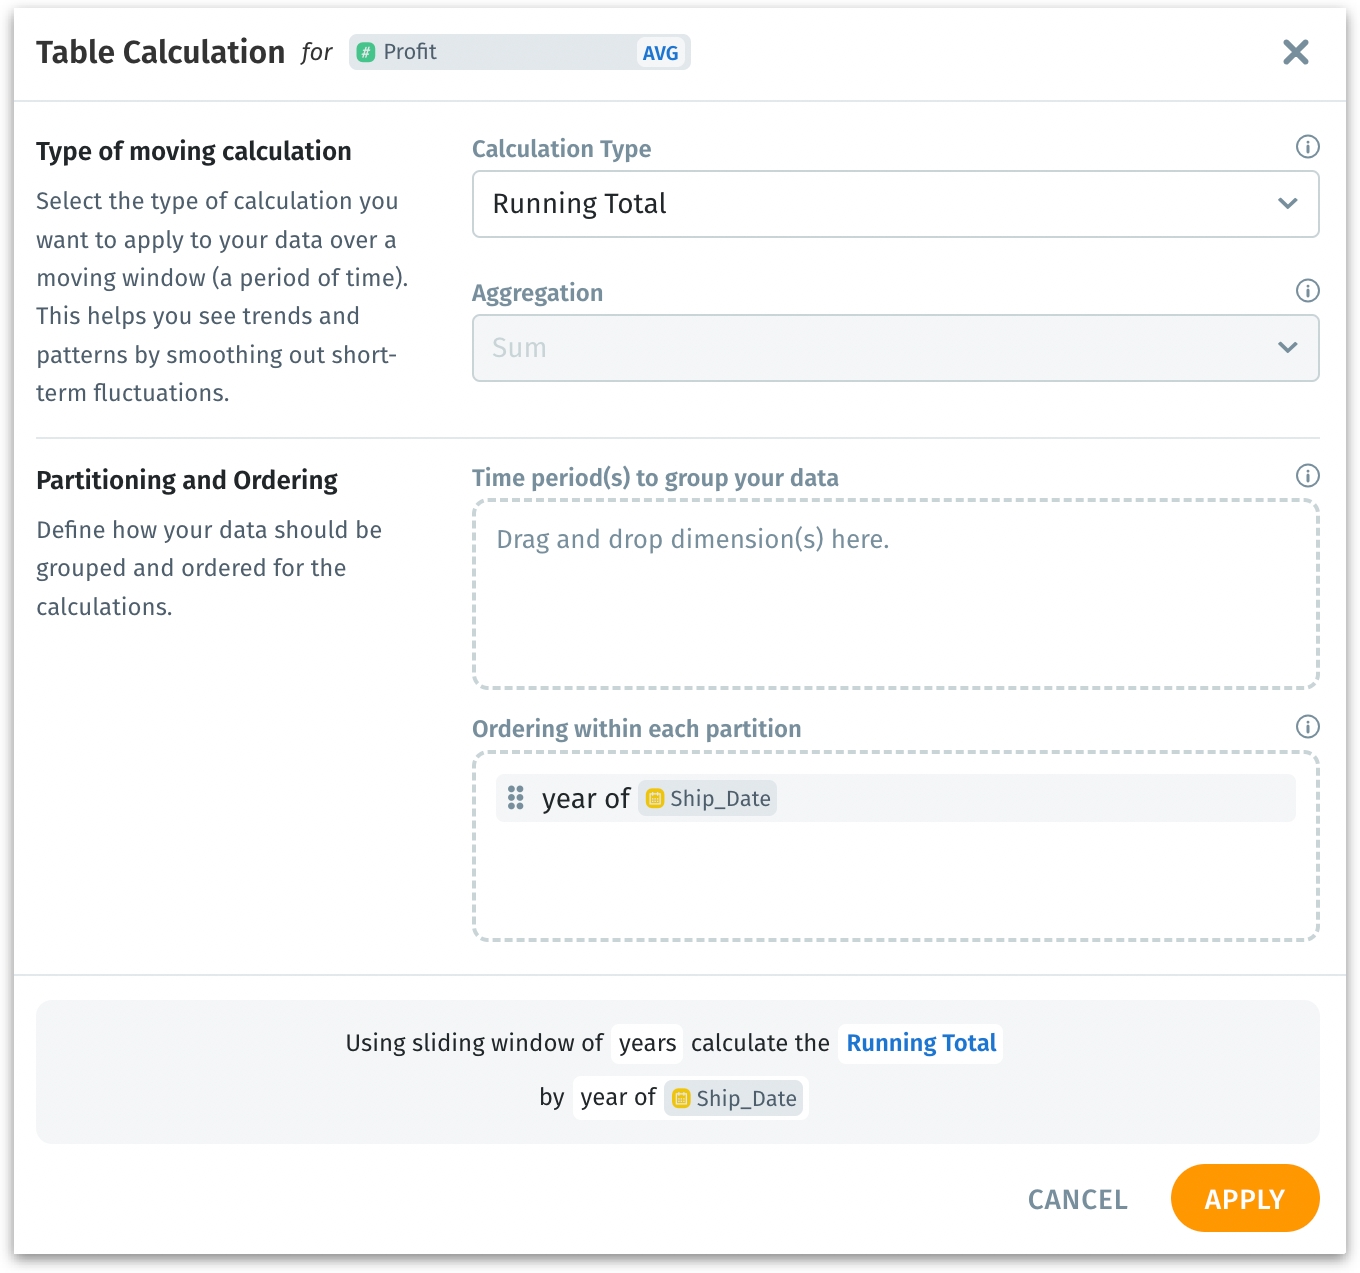
We are excited to introduce our new dynamic calculations feature, which includes support for Moving calculation and Running total.
The moving window calculation feature lets you analyze data over a rolling time frame, which helps smooth out short-term changes and reveal long-term trends and patterns. It also reduces the need to create multiple Business Views for different metrics, streamlining the data analysis process.
Moving calculation help to see the big picture by smoothing out the noise from short-term data fluctuations. This makes it easier to identify underlying trends and patterns.
Example: To find the average sales over the last 3 weeks, it calculates the average for each week as you go through your data, helping you see the overall trend more clearly, gaining a clearer view of your business's growth trajectory without week-to-week fluctuations.
Running totals allow you to track the total accumulation of data over time. This is particularly useful for metrics like total sales or cumulative profit.
Example: Use cumulative sum to track the total sales up to the current week, continuously adding each week's sales to give you the total so far.
The rolling windows can be customized to fit your specific needs. Whether it's a 3-month moving average or a running total over the past year, you have the flexibility to define the window that best suits your analysis. We’ve also included the ability to customize the partitioning and ordering of data.
Partitioning allows you to group your data into distinct segments, such as by year or quarter. For example, you can partition your sales data by the year of the order date, ensuring that each year's data is analyzed separately.
Ordering ensures that your calculations follow a logical sequence within each partition, enhancing the accuracy and relevance of your insights. For example, within each yearly partition, you can order your data by week.
By combining partitioning and ordering, you gain a more detailed and structured view of your data drilling down into specific time segments.
Building upon the foundational version introduced in 5.0, we have significantly enhanced our Kaiya Search capabilities. (On a side note, we’ve packaged all our GenAI-powered features into “Kaiya”. Please check out for more details) This update brings advanced natural language understanding of more complex queries, reduces false positives, and introduces powerful new learning features, ensuring a more intuitive and precise search experience.
False positives occur due to the incorrect identification of terms or phrases in a user's query as relevant data points when they are not, which might lead to erroneous search results. Now, Kaiya Search smartly filters out contextually irrelevant terms.
Consider the query: "How many prescriptions have been written in the past three months for PillABC?"
Relevant terms: "prescriptions," "past three months," "PillABC"
Irrelevant terms: "have been written"
The words "have been written" do not add meaningful context to the query's intention. The improved feature now accurately understands that these words are simply part of the user's natural language and should not affect the search results.
Consider another example with extraneous natural language keywords in the query, such as: “Can you show me the number of Fenoglide prescriptions in the North region during the last three months?”
Relevant terms: "number of Fenoglide prescriptions," "North," "last three months"
Irrelevant terms: "Can you show me", "during the", "region" (if not a specific column)
Kaiya now better understands that “region” in this context complements the term “North” and is not necessarily a specific column in the dataset.
Kaiya’s updated search engine can handle complex queries with multiple keywords and synonyms, even if they are jumbled or presented in a non-standard order. These features collectively ensure a more intuitive, accurate, and customizable search experience, aligning closely with user expectations and business requirements.
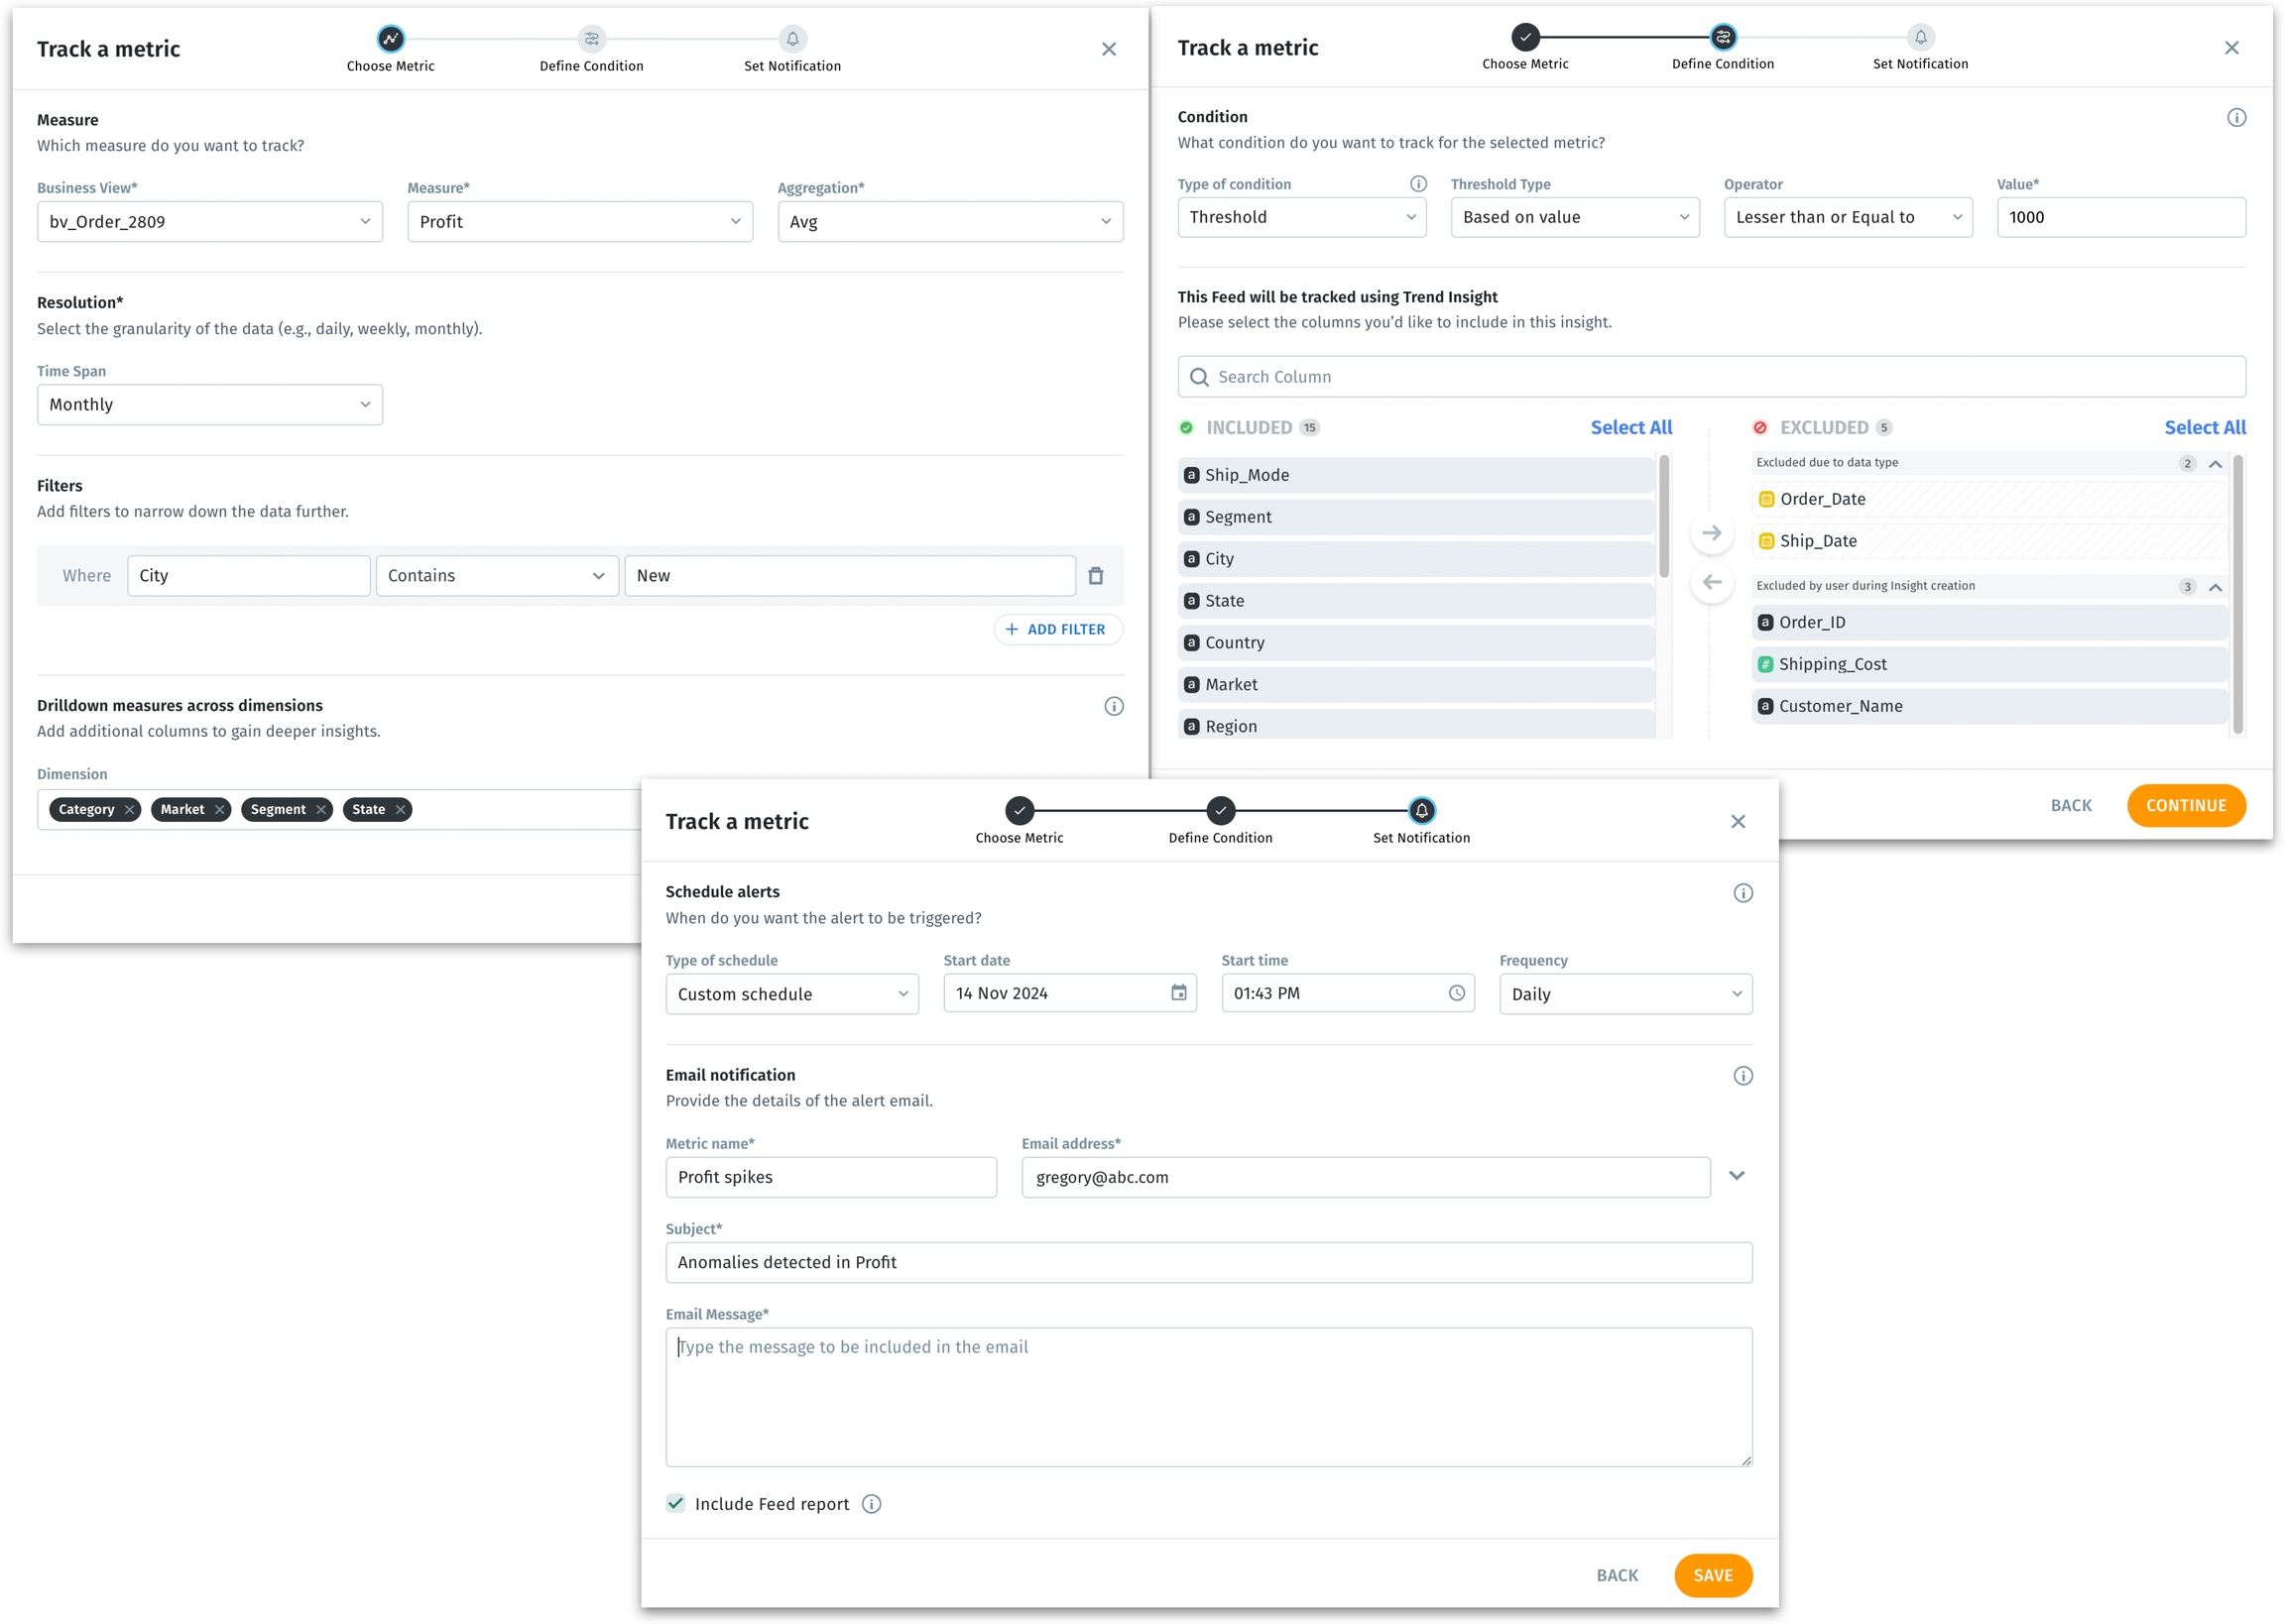
We are excited to introduce the new and improved Feed, designed to provide our users with better control over monitoring metrics.
Users can now track metrics not just at a macro level, but also within specific subsegments (dimensions drill-down), allowing for more precise monitoring. By breaking down a measure across dimensions, users gain a deeper understanding of what drives changes in their data. Identifying the specific areas contributing to changes enables more proactive interventions.
We’ve also implemented the following improvements to the Feed:
We now offer two methods to check anomaly detection:
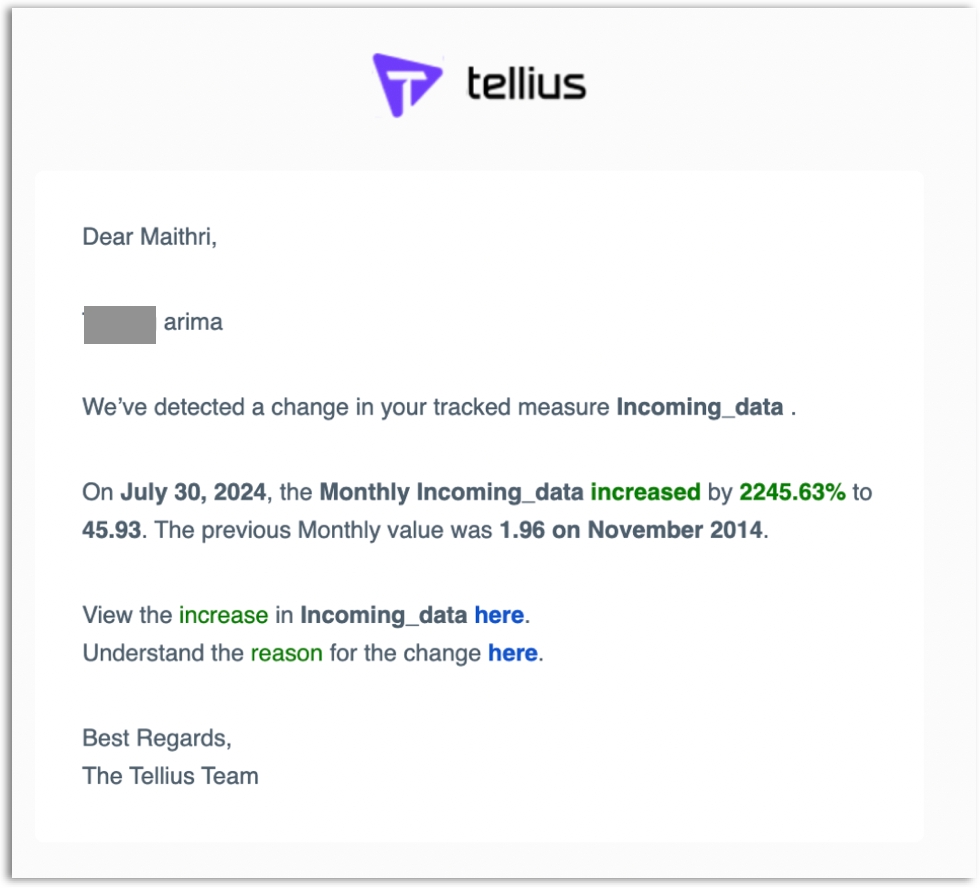
ARIMA method (a powerful statistical approach for forecasting trends and anomalies)
Threshold method (limits can be set up in absolute or percentage values)
Tellius can check the condition every time the dataset is refreshed or according to a custom schedule you set. This independent scheduling allows users to track data without relying on the refresh frequency of associated Business Views.
Example: When a company wants to understand its revenue trends better, it sets up dimensions “Country” (to identify which markets are performing well) and “Product Category” (how different categories are contributing to total revenue) for drill-down. It also sets up threshold limits where a decline of more than 5% in monthly revenue triggers an alert.
Say, over the last quarter, the company observes an overall decline in revenue. With the help of dimension drill-down, they identify that the decline is mainly due to a drop in electronics sales in Europe. An alert is triggered because the electronics sales in Europe have dropped by more than 5% compared to the previous month. The email notification will specify which country and product category experienced the sales drop, allowing them to take immediate action. Previously, this level of detailed analysis wouldn’t have been possible without creating multiple Feeds and relying solely on the default ARIMA method for anomaly detection.
Remember the table annotations we introduced in 5.0? Now, we’ve brought in an enhancement to download the annotations. Users can now export annotations associated with table cells in JSON format.
The annotations can be downloaded with or without replies, depending on the specific needs, preserving the conversation and context around each table cell. Images, documents, and other attachments linked to table cells will also be included in the exported JSON file. Additionally, users can schedule the export of tables along with their annotations at regular intervals, ensuring that they always have up-to-date data and context available. The export process will automatically exclude any deleted comments.
This ensures that all team members have access to the latest discussions and contextual information, even when working offline or integrating the data with other analytical tools.
Consider measures like "terminations", "churns", "loss" etc., where an increase in values is seen as unfavorable. These measures can now be set to display green for decreases and red for increases to quickly identify positive and negative trends. This allows users to define how changes in the metrics are visually represented, based on their specific business context and preferences.
If a measure is selected to be positive, then its increase would be depicted in green and decrease in red. If a measure is selected to be negative, then its increase would be depicted in red and decrease in green. This provides clear and intuitive visual cues that align with the user's understanding of their metrics. This has been made consistent across all the measure value representations in Trend Insights, ensuring accurate, easily interpretable Insights.
We’ve enhanced text wrapping and cell resizing capabilities in Vizpad tables for a more Excel-like experience.
Lengthy text in table cells will now be fully visible and wrapped within the cell, preventing truncation. Also, users can now resize columns, ensuring that text wraps appropriately within the resized cells. This prevents unnecessary white space and maintains a clean, organized table layout.
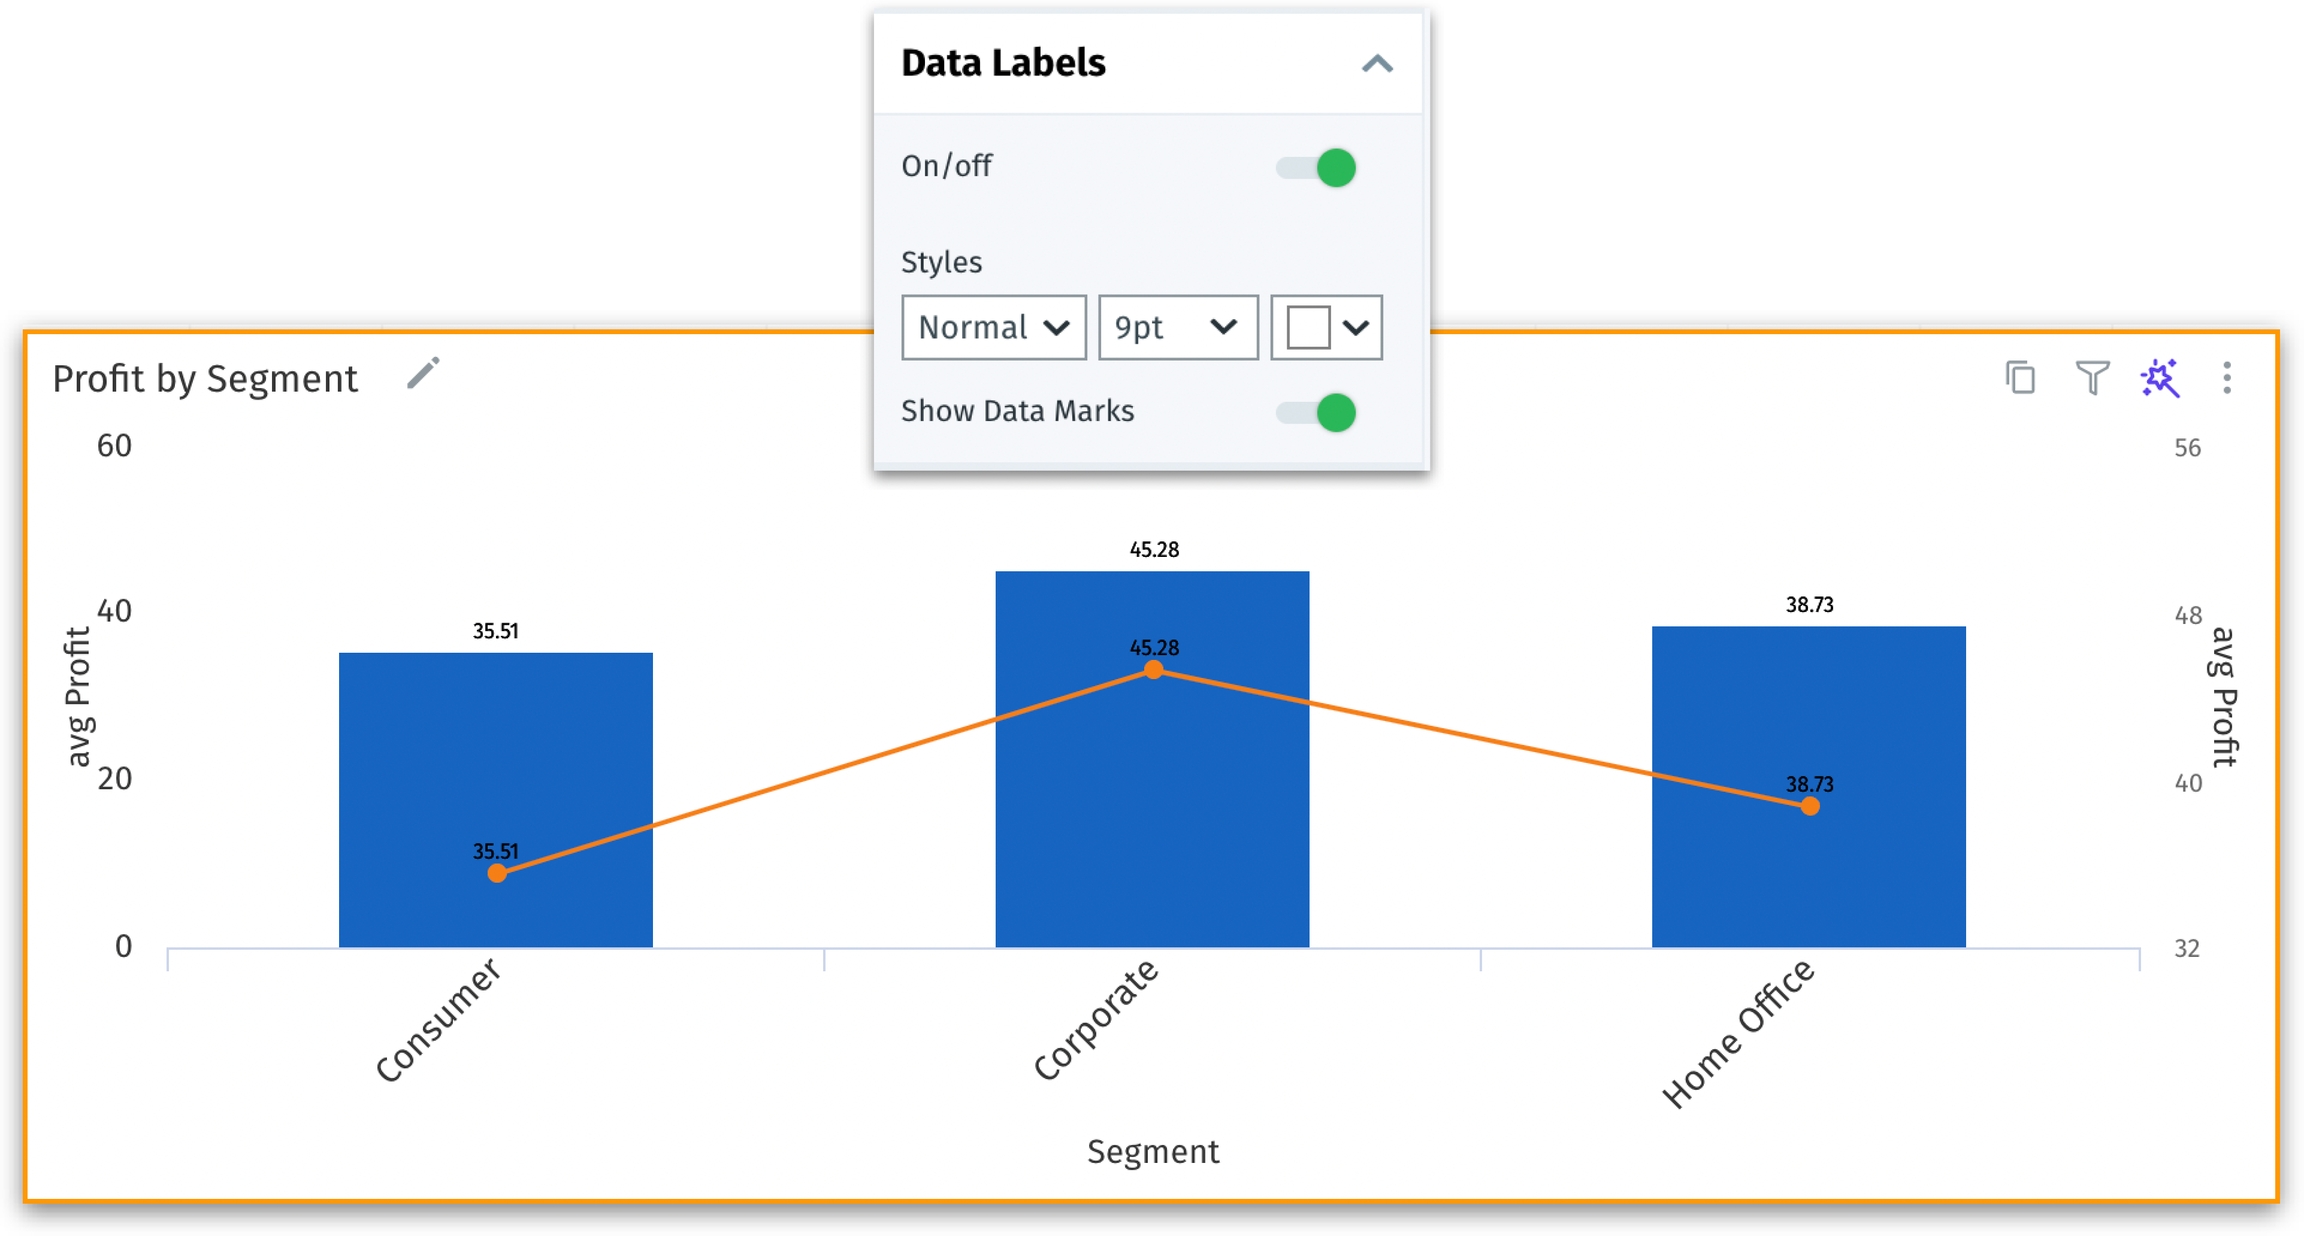
In Vizpads, we’ve introduced the "Show Data Marks" feature for combo and growth charts. This enhancement allows users to better identify and analyze specific data points on lines, improving data interpretation, especially when using color variations.
In the Formatting tab under “Data Labels”, a new toggle "Show Data Marks" has been added for combo and growth charts. When enabled, data marks will appear on the lines in the combo and growth charts. The applied data marks will be reflected when exporting charts or saving them to Vizpad.
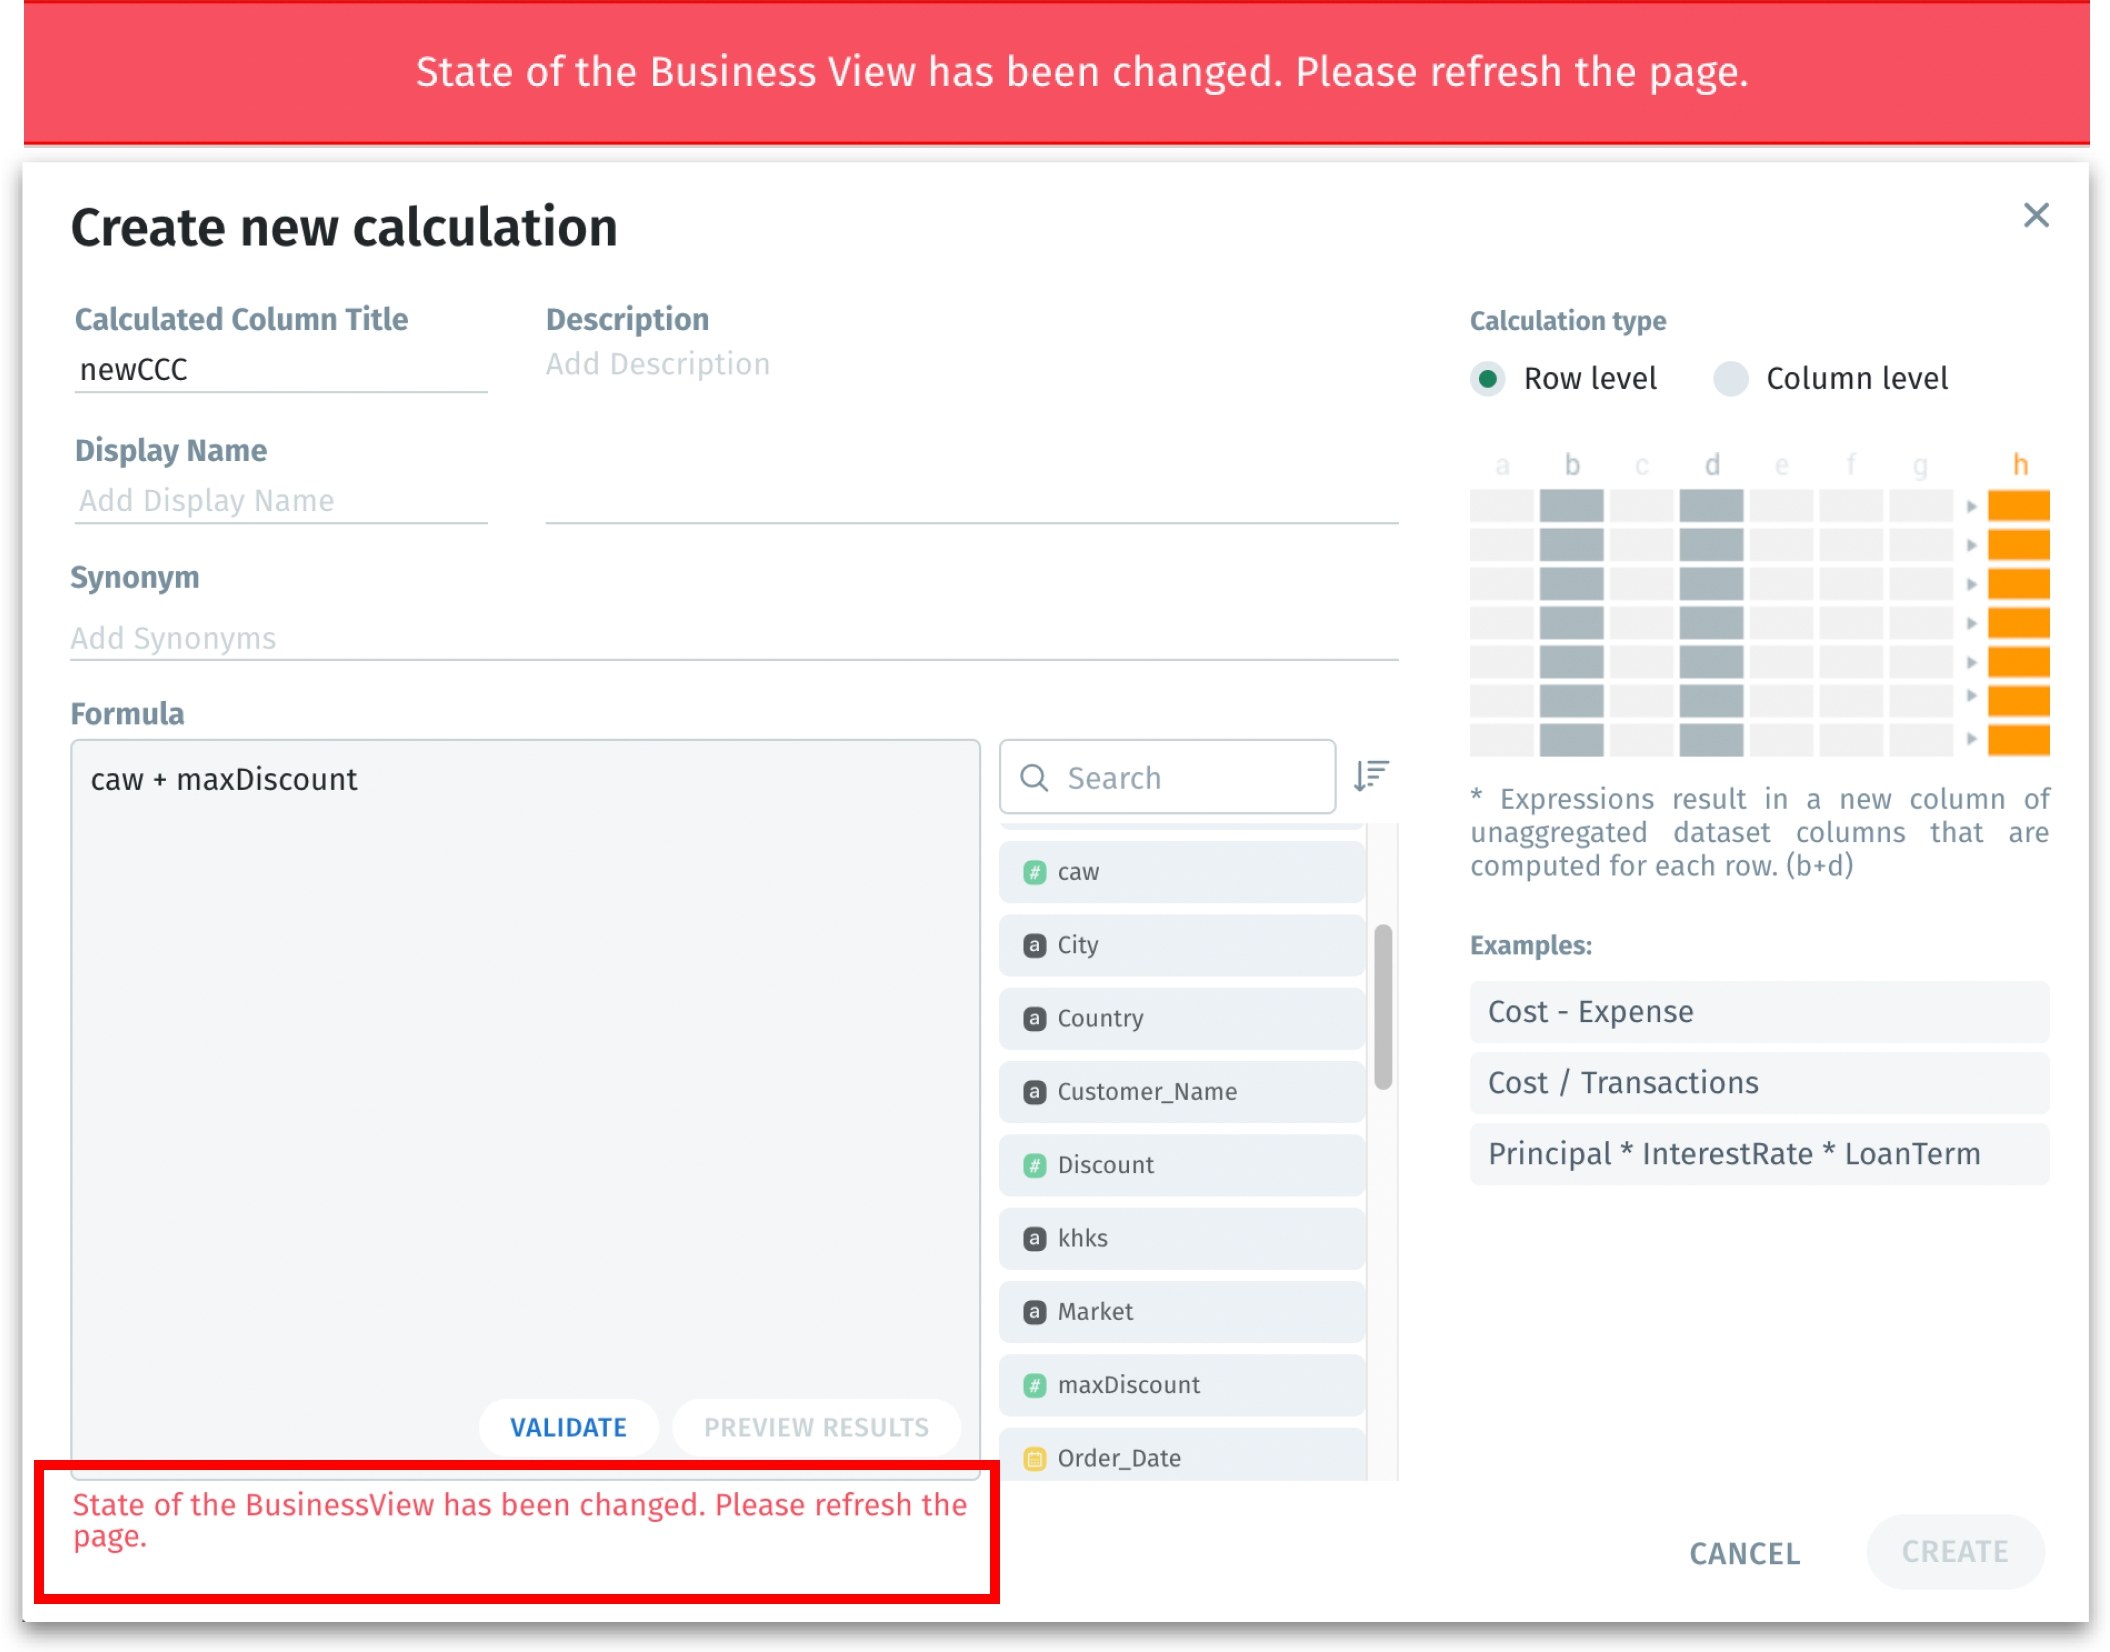
We've made improvements to how concurrent edits are handled in Business Views (BVs). This enhancement ensures that changes made by one user do not inadvertently overwrite the changes made by another, preventing accidental overwrites and data loss when multiple users are working on the same BV.
Now, when a user starts editing a BV, it gets locked, preventing others from making changes until the initial user completes their edits. Users will be notified if another user is currently editing the BV, prompting them to wait or refresh the page to avoid conflicts. This real-time locking mechanism ensures that only one set of changes is being made at a time, thus preventing multiple users from editing the same BV simultaneously. Also, this ensures that all users have the most current version of the BV before making edits.
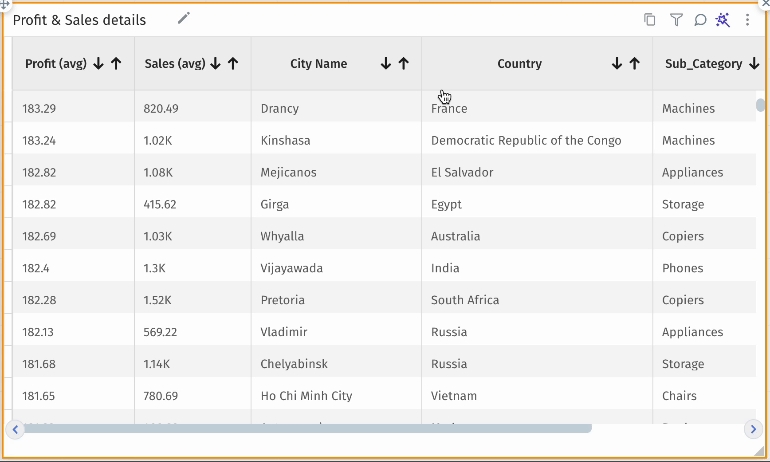
Users can now provide alias names for measures used in Vizpad charts, improving their readability and interpretation without affecting the original column names or display names in the respective Business Views. The aggregation type (e.g., avg, sum) will continue to be displayed in parentheses even if the name is aliased.
The alias names are exclusively for display purposes only and independent of the original column names used in Business Views. If you provide an alias name to a measure used in Chart A, and if the same measure is used in Charts B and C, then the measure name will be aliased only for Chart A and remains unchanged in all the other charts.
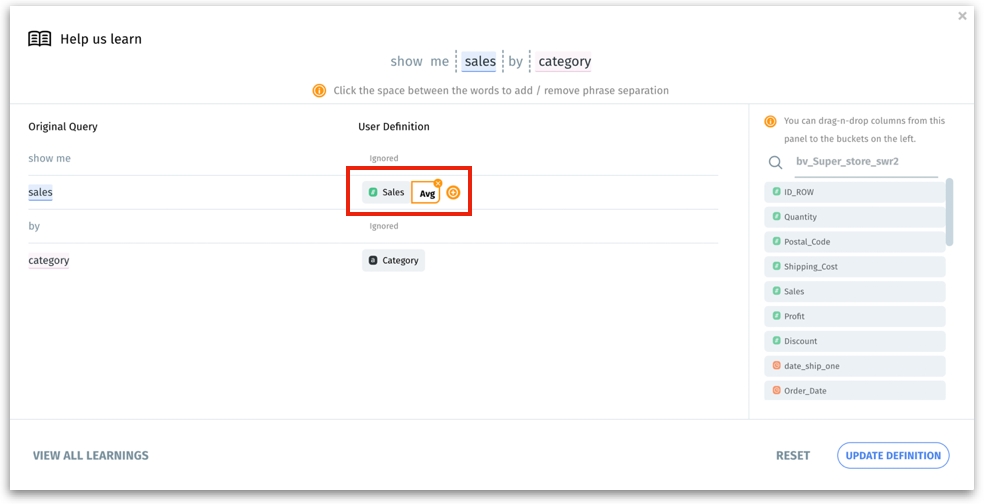
We've brought in significant enhancements to Help Tellius Learn functionality, helping users effortlessly create and manage learnings.
In the “Help us Learn” section of Tellius Search, users can now create learnings solely based on the column name without mandating an aggregation. Tellius will automatically extract and apply the appropriate aggregation as specified in the user’s search query. Users can easily add and remove an aggregation using the new icons provided.
Existing learnings will be automatically separated into column names and aggregations. Users can choose to remove or modify the aggregations as needed, making it easy to update previously created learnings. This reduces the need for repetitive learning entries, saving users time and effort.
In Vizpads, the Apply button has been repositioned to remain prominently visible when using the IN operator in filters.
Now, Kaiya Search can recognize incorrectly spelled time filters, time resolutions (such as "monthly" "quarterly" or "weekly”), filter operators, and aggregations, ensuring that misspelled words are automatically corrected in real time. Additionally, it can also identify misspelled "Top/bottom", "Trend/growth" keywords, and column names (to a certain degree).
In horizontal bar charts of Vizpads, the Y-axis labels are now fully visible regardless of their length, thus preventing truncation and improving readability.
In 5.1, we have made substantial security improvements to ensure Tellius remains a robust and secure platform. Our focus on enhancing security spans several critical areas:
Penetration testing issues
Resolved vulnerabilities identified during penetration testing to mitigate potential security risks.
Remediated SAST/DAST vulnerabilities
Fixed several static and dynamic application security testing findings to enhance code security.
Secured containerization
Addressed vulnerabilities found in Docker images across multiple services, including Bot Server, CDN, React service, DataLoader, MongoDB, Postgres, RabbitMQ, Redis, and Middleware, reducing high and critical vulnerabilities to zero.
Strengthened overall platform security
Improved security measures for Spark UI and Airflow UI, restricting access to superusers and admin users only.
Insights for any alert can now be run on demand, providing flexibility and control over when data is analyzed.
Feeds (new and existing) can now be edited, shared, and linked, facilitating better collaboration across teams.
Significantly improved the performance for Business Views with 50+ calculated columns, resulting in faster query execution.
In the summarized charts of Trend Insights, resolved an issue where negative values were not displaying correctly.
To prevent unauthorized creation of Business Views, users can now only create Business Views using datasets with explicit access.
When a user shared a Business View with another user in Edit mode and exported the associated Vizpad, fixed the issue with importing and mapping the Vizpad to the same Business View.
Under Data → Prepare, fixed the validation process for creating scripted datasets to check for existing dataset names, thus preventing naming conflicts.
In Vizpad charts, resolved the benchmark line calculations to consider all relevant chart configurations, including applied filters.
In Vizpads, fixed the issue with retaining the resized column widths of tables after saving and reloading them.
In the control filters of Vizpads, resolved an issue where clicking on the search input would collapse the dropdown menu. Also fixed global filter overlapping with charts.
Under Data → Connect, fixed an issue where loading a single Snowflake table using custom SQL would incorrectly append the original table name to the user-provided dataset name.
Under the Notifications tab and Data → Business Views, users now receive clear error messages when sample files for Business Views are missing.