Release 4.2
Explore Tellius 4.2 features—custom Search Guides, enhanced Vizpad filters, live data alerts, and faster queries for more flexible, real-time analytics.
Released in June 2023
We are thrilled to announce the release of Tellius 4.2, which comes packed with powerful new features, enhancements, and critical security updates. With Tellius 4.2, users will enjoy greater flexibility, accelerated time to insights, broader connectivity, and improved performance across the platform.
🚀 New features
Customizable Search Guide
The Search Guide can now be customized to include relevant questions tailored to each Business View. Admins can edit entire search queries (including categories), distinguish between user-updated and auto-generated queries, and get suitable suggestions for the query being typed. Moreover, we have increased the number of queries per category from three to five and added the ability to hide or unhide queries. A dedicated section has been included for real-time query result previews, enabling admins to accept or discard queries based on the preview. The Search Guide is now personalized and informative, transforming the user experience and simplifying the onboarding process.

Feed for Live Data Sources
Now, users can set up metrics to be tracked from Feed or from charts for live datasets. Alert emails will be sent immediately as soon as any anomalies are detected in the tracked metric. Additionally, users can now choose whether they need the report to be sent as an Excel attachment in emails, providing them with more flexibility.

Redesigned Vizpad Control Filters
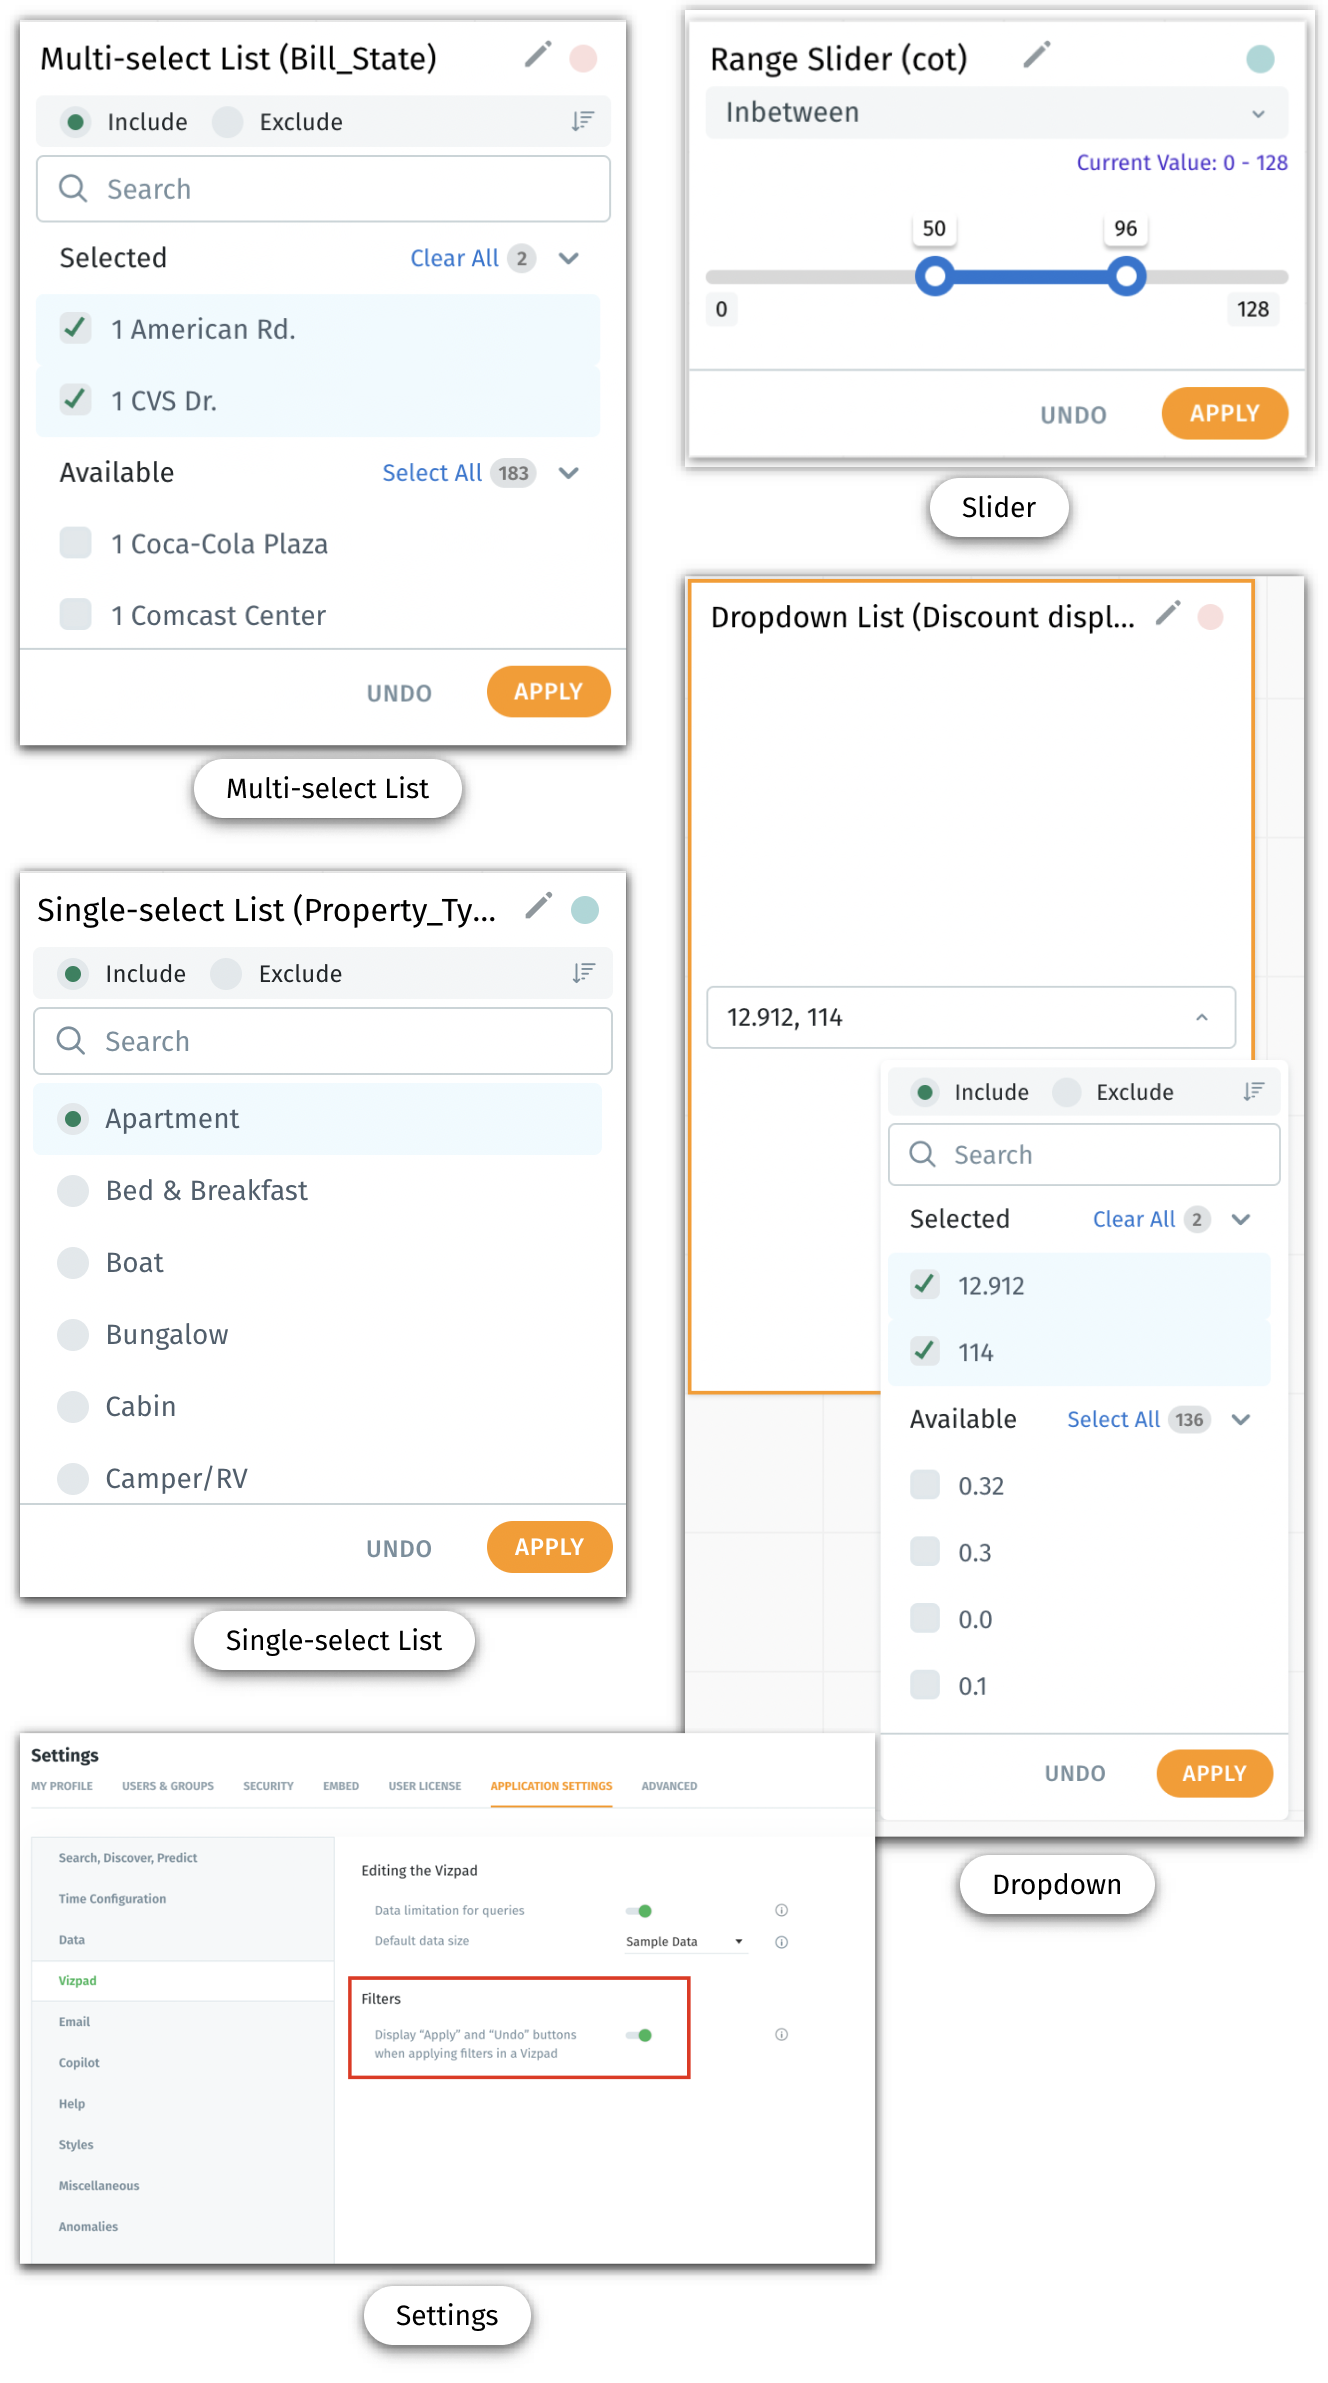
The Vizpad control filters under Explore → Add Charts have been redesigned to offer users an improved experience. With four filter types to choose from (multi-select, single-select, range slider, and dropdown lists), users can now search and sort filter values in ascending and descending order. These new features make it easier and faster for users to refine their data and create customized charts that meet their specific needs.
For all types of control filters,
The selected values will be applied only after users click the "Apply" button. This avoids the unnecessary overhead of applying the filters each time a value is selected.
An "Undo" button is available to reset filters to their previous state. Administrators can control the visibility of the "Apply" button through Settings.
For single-select, multi-select, and dropdown lists,
To make the list more accessible and informative, two pairs of nested lists have been introduced: "Available" and "Selected," along with "Include" and "Exclude".
For slider range filters (applicable to measures), the Formatting section now offers additional customization options. Users can modify the font style, font size, and color for minimum and maximum values, as well as for newly selected values.

External Data Engine Query Performance
Tellius now provides users with enhanced visibility into the time required for executing each query and rendering the results, specifically when queries are run on live data sources. In Vizpads and Search, the platform actively tracks and displays the time consumed by both Tellius and any external data sources, giving users a clearer understanding of query performance. This feature is crucial for identifying bottlenecks in query performance, particularly when performance is impacted by queries being executed directly on sources like Snowflake, Redshift, Azure, and more.

Enriched Metadata for Calculated Columns
Users can now enhance their experience by adding synonyms and column descriptions for calculated columns created at the Business View level. This expedites and simplifies data analysis by allowing users to reference calculated columns using synonyms rather than the actual column names in search queries. Moreover, the inclusion of column descriptions provides context for calculated columns, enabling data experts to set up explanations that can disclose the underlying calculations to end users.

Support for marketshare changes in Search queries
In Search, Tellius now provides out-of-the-box support for "change in market share" queries with the following syntax:
Show me [change/percentage change] in market share <M1> for <V1> for <F1> [vs/compared to] <F2>Show me [change/percentage change] in market share <M1> for <V1> for <F1> [vs/compared to] <F2> for X1 for X2
Where
M1 represents the measure
V1 represents the target variables
F1 and F2 represent a list of filters for the target population, with multiple filters following "for" or "in"
X1 and X2 represent a list of global filters, including dimension or date columns
Users can now execute queries such as:
Show me [change/percentage change] in market share Sales for Nike for New York vs California
Show me [change/percentage change] in market share Sales for GoPro for North America vs South America for 2022
Show me [change/percentage change] in market share Sales for Nike for New York vs California for 2022 for First-class shipping
Show market share of dollar sales for Advil for adult internals for retailers for the last 4 weeks vs the last 4 weeks a year ago

Connectivity with Microsoft Azure Synapse
Now, users can seamlessly connect with Azure Synapse from Tellius to import data tables, or connect live and query directly. Under the Data → Connect tab, Synapse has been added with standard and advanced options (that override default settings) to facilitate seamless data integration.

In-app Tellius Product Roadmap
Now, customers have the opportunity to submit ideas, view submissions from other users, and provide feedback on our planned features. The product updates can be found under Help → Tellius Product Roadmap. They are organized into four categories: Under Consideration, Planned, In-Progress, and Launched, offering a clear overview of our development progress. Customers can influence the roadmap by rating or voting on features. As a feature receives more votes, it climbs higher on the list, gaining increased visibility and consideration. This enhancement aims to foster greater collaboration between our product team and customers, allowing us to continuously improve Tellius based on valuable feedback and insights.

📈 Enhancements
Synchronized global filters and Vizpad control filters
Vizpads and control filters (multi-select, single-select, range slider, and dropdown) will now be consistently synchronized with the global filters. These improvements facilitate a more user-friendly experience for managing and applying filters in Vizpads.
The synchronization respects the following rules:
Changes made to a global filter or control filter for a specific column will be reflected in both filters.
If either the global filter or control filter is deleted, the other one will be deleted as well.
When creating a control filter for a column with an existing global filter, the control filter will respect the global filter settings. For example, if “USA” is selected in the global filter, only states corresponding to “USA” will appear in the multi-select filter.
Only one global filter or control filter can be created per column, with a single filter pill representing both filter types.
In the case of multi-Business View Vizpads, users can create only one global filter per column for each Business View.

Streamlining interaction with Business Views
A series of improvements have been introduced across Tellius to enhance the overall interaction with Business Views, enabling quick access and easy navigation for users.
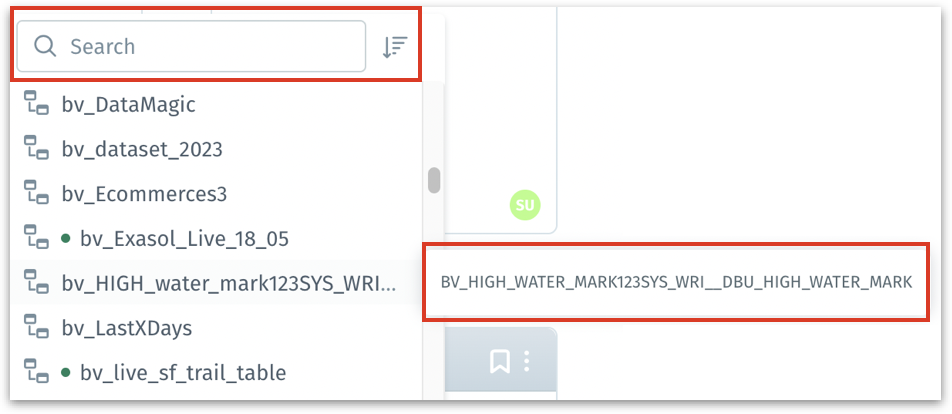
The space for displaying Business Views has been increased to accommodate 30 characters.
Lengthy Business View names will be displayed on hover in tooltips.
Live Business Views will be indicated with green colored dots.
The Business Views can be searched and sorted.

Instant code application
While creating or editing Python/SQL code, Tellius now provides the option to apply the code directly to the dataset without saving it to the code library first—thus accelerating time to insights.

Support for Snowflake with PrivateLink
Tellius now supports connecting with Snowflake using PrivateLink via Amazon Web Services (AWS) or Microsoft Azure. With Snowflake PrivateLink, users can connect to Snowflake using a private IP address rather than relying on a public IP address that is accessible over the internet. This enhances security by restricting traffic to users’ virtual private clouds (VPC) or on-premises networks, thus reducing the risk of unauthorized access or data breaches.
Additional metadata in audit logs
The audit logs (available in native JSON format) now include the source IP address, username, and timestamp to provide a comprehensive view of events. Also, the logs are refreshed every 15 minutes to ensure they are up-to-date.
🛠️ Minor fixes
The display and sorting of fields in the Excel attachment for Feed have been updated.
The data labels for area charts have been updated.
In calculated columns, the actions for editing, formatting, and deleting have been added to the ellipses of each row.
100% stacked bar charts will now display percentages in their data labels by default.
When users create a clone of an existing viz or add a new chart to a Vizpad, Tellius automatically scrolls down to the newly created clone/viz.
In treemaps, 100% stacked bar charts, 100% stacked area charts, pie charts, and donut charts, users can now choose whether they want to display values, percentages, or both in the data labels.
Users can now view both dimensions and measures as data labels in treemaps.
🛡️Security fixes
In this release, Tellius has addressed multiple vulnerabilities and implemented significant version upgrades to enhance the performance and stability of the platform.
The following version upgrades have been brought in:
MongoDB version to 6.0.3
Redis version to 7.0.7
RabbitMQ version to 3.11
Spark version to 3.3.1 (from 2.4)
Scala version to 2.12 (from 2.11)
HDFS version to 3.3.4 (from 2.10)
openssl and libssl-dev packages have been removed from the following images:
Tellius-web
Tellius-react-web
Rasa-core
Clickhouse
Cdn
Bot-server
Data-loader
The vulnerabilities associated with log4j and jackson-databind jar have been addressed in the following images:
Spark-restserver
HDFS, Middleware
SQE
Resource-tracker
Viz-engine
Clickhouse-autoscaler
⛔ Deprecation
With this release, the capability to directly connect to BigQuery data tables using GCS buckets has been deprecated.
Last updated
Was this helpful?