What's New
Changelog - 5.0.1
Release 5.0
Changelog - 4.3.4
Changelog - 4.3.3
Changelog - 4.3.2
Changelog - 4.3.1
Release 4.3 (Fall 2023)
Changelog - 4.2.7
Changelog - 4.2.6
Changelog - 4.2.5
Changelog - 4.2.4
Changelog - 4.2.3
Changelog - 4.2.2
Changelog - 4.2.1
Release 4.2
Changelog - 4.1.5
Changelog - 4.1.4
Changelog - 4.1.3
Changelog - 4.1.2
Changelog - 4.1.1
Release 4.1
Release 4.0
Release 3.9
Release 3.8
Release 3.7
Release 3.6
Release 3.5
Release 3.4
Release 3.3
Release 3.2
Release 3.1
Release 3.0
Release 2.4.1
Release 2.4
Free Cloud Trial
Release 1.8
Release 2.3
Release 2.2
Release 2.1
Release 2.0
Release 1.7
Release 1.6
Release 1.5
Getting Started
Quick Guide
Best Practices Guide
Search - Best Practices
Vizpads (Explore) - Best Practices
Insights (Discover) - Best Practices
Predict - Best Practices
Data - Best Practices
Glossary
Tellius 101
Navigating around Tellius
System requirements
Tellius Architecture
Installation steps for Tellius
Guided tours for quick onboarding
Customizing Tellius
Tellius Copilot 101
Search (Natural Language)
Search in Tellius
Guide Me
How to Search
Business View List / Columns
Query
Query
Percentage Queries
Time Period Queries
Live Query
Generating Insights-based queries from Search
Search Result
Discover Insights
Interactions
Chart Operations
Add to Vizpad
Table View
Switch Chart type
Change Chart Config
Apply Filters
Change Formatting
Measure Aggregation - Market Share Change
View Raw Data
Download/ Export
Embed URL
Partial Data for Visualization
Best-fit visual
Add to Vizpad
Adding the chart to a Vizpad
Customize the auto-picked columns
Search Query Inspector
Teach Tellius
GPT mode in Search
History
Guided Search
Add Guided Search Experience
Display Names in the Search Guide
Guided Search
Guided Search Syntax and Attributes
Deep Dive
Maps in Search
Search Keywords
Percentage Queries
Time Period Queries
Year-over-Year Analysis
Additional Filters
Pagination
List View In Search Results
Marketshare queries
Embed Search
Personalized Search
Search Cheat Sheet
Filters in Help Tellius Learn
Explore (Vizpads)
Dashboards in Tellius
Vizpad Creation
Create Interactive Content
Create Visualization Charts
List of Charts
Common Chart Types
Line Chart
Bar Chart
Pie Chart
Year-over-Year Functionality in Vizpad
Area Chart
Combo Chart
KPI Target Chart
Treemaps
Bubble Chart
Histogram
Heat-Map Charts
Scatter Chart
Other Charts
Cumulative line chart
Cohort Chart
Explainable AI Charts
For each chart
Create Visualization Charts
Global Filters
Embedded Filters
Other Content
Anomaly management for charts
Creating Interactive Content
Vizpad level Interactions
Viz level Interactions
Discover Insights
Drivers
Discover hidden insights - Genius Insights
How Genius Insights works
Discoveries in Insight
Anomalies on Trend
Interactions
Chart Operations
Switch Chart type
Change Chart Config
Apply Filters
Change Formatting
Add X/Y Axis Target Lines to Scatter Chart
Improvements to Conditional Formatting
Adding Annotations to Tables
Displaying query execution time
AI summaries
Embedding Vizpad
Vizpad Consumption
Collection of Interactive Content
Vizpad level Interactions
Global Filter on the fly
Global Resolutions
Refresh
Notifications / Alerts
Share
Download / Export
Unique name for Vizpads
Edit Column Width
Viz level Interactions
Importing bulk filter values
Multi-Business View Vizpads
Discover (Genius Insights)
Discoveries
What are discoveries
Type of Discoveries in Tellius
Create Discoveries
Kick-off Key Drivers
Edit Insights
Key Driver Insights
Components of Key Drivers
What are Key Drivers
Edit Key Driver Insights
Segment Drivers
Trend Drivers
Trend Insights (Why Insights)
Components of Trend Insights
WHAT: Top Contributors
WHY: Top Reasons
HOW: Top Recommendations
Seamlessly navigating to "Why" from "What"
Create Trend Insight
Edit Trend Insights
What are Trend Insights
Comparison Insights
Components of Comparison Insights
Create Comparison Insight
What are Comparison Insights
Edit Comparison Insights
Others Actions
Save
Refresh
Share Insights
Download
Adding Insights to Vizpad
Insights Enhancements
Embedding Insight
Impact Calculation for Top Contributors
Marketshare
Live Insights
Predict (Machine Learning)
Machine Learning
AutoML
How to create AutoML models
Leaderboard
Prediction
Others
What is AutoML
Point-n-Click Predict
Feed (Track Metrics)
Assistant (Conversations)
Tellius on Mobile devices
Data (Connect, Transform, Model)
Connectors
Connector Setup
Google BigQuery
Google Cloud SQL
Connecting to a PostgreSQL Cloud SQL Instance
Connecting to an MSSQL Cloud SQL Instance
Connecting to a MySQL Cloud SQL Instance
Snowflake
PrivateLink
Snowflake Best Practices
OAuth support for Snowflake
Integrating Snowflake with Azure AD via OAuth
Integrating Snowflake with Okta via OAuth
Edit Connector
Live Connect
Data Import
Cache
Direct Business View
JDBC connector for PrestoDB
Amazon S3
Looker SQL Interface
Databricks
Connecting to an AlloyDB Cluster
List of Connectors by Type
Tables Connections
Custom SQL
Schedule Connector Refresh
Share Connections
Datasets
Load Datasets
Configure Datasets (Measure/Dimensions)
Transform Datasets
Create Business View
Share Datasets
Copy Datasets
Delete Datasets
Swapping datasources
Metadata migration
Data Prep
Datasets
Data Profiling / Statistics
Transformations
Dataset Transform
Aggregate Transforms
Calculated Columns
SQL Transform
Python Transform
Create Hierarchies
Filter Data
SQL Code Snippets
Multiple Datasets Scripting SQL
Column Transforms
Column Metadata
Column type
Feature type
Aggregation
Data type
Special Types
Synonym
Rename Column
Filter Column
Delete Column
Variable Display Names
Other Functions
Metadata View
Dataset Information
Dataset Preview
Alter Pipeline Stage
Edit / Publish Datasets
Data Pipeline (Visual)
Alerts
Partitioning for JDBC Datasets
Export Dataset
Write-back capabilities
Data Fusion
Schedule Refresh
Business Views
Create Business View
Create Business View
Datasets Preview & List
Add datasets to Model
Joins
Column selection
Column configuration
Primary Date
Geo-tagging state/country/city
Save to Fast Query Engine
Publish
Business View
What is Data Model
BV Visual Representation (Preview)
BV Data Sample
Learnings (from Teach Me)
Custom Calculations (Report-level Calc)
Predictions on BV
BV Refresh
Export/ Download Business View
Share Business View
URL in Business View
Request Edit Access
Projects (Organize Content)
Monitor Tellius
Embedding Tellius
Embedding
Settings
About Tellius
User Profile
Admin Settings
Manage Users
Team (Users)
Details & Role
Create a new user
Edit user details
Assigning the user data to another user
Restricting the dataset for a user
Deleting a user
Assign User Objects
Teammates (Groups)
Authentication & Authorization
Application & Advanced Settings
Data
Machine Learning
Genius Insights
Usage tracking & Support
CDN
Download Business View, Dataset, and Insights for Live BV
Customize Help
Impersonate
Data Size Estimation and Calculation
Miscellaneous Application Settings
Configuration for time/date-related results
Dataflow Access
Enable In-memory operations on Live sources
Language Support
Administration
Setup & Configuration
Installation Guide
AWS Marketplace
Autoscaling
Backup and Restore
Help & Support
FAQ
Data Preparation FAQs
Environment FAQs
Search FAQs
Vizpads FAQs
Data Caching
Security FAQs
Embedding FAQs
Insights FAQs
Tellius Product Roadmap
Help and Support System
Guided Tours
Product Videos
Articles & Docs
Provide Feedback
Connect with Tellius team
Support Process
Notifications
Getting Started Videos
Getting Started
Tellius Connect
Tellius Data Overview Video
Connecting to Flat Files Video
Connecting to Data Sources Video
Live Connections Video
Data Refresh and Scheduling Video
Tellius Prep
Getting Started with Tellius Prep Video
Transformations, Indicators, Signatures, Aggregations and Filters Video
SQL and Python Video
Working with Dates Video
Data Fusion Video
Business View Video
Business Mapping Video
Report Level Calculations Video
Writeback to DB
Natural Language Search
Getting Started with Search Video
How-To Search Video
Customizing Search Results Video
Search Interactions Video
Help Tellius Learn
Explore - Vizpads
Getting Started with Vizpads Video
Creating Vizpads Video
Creating and Configuring Visualizations Video
Viz-Level Interactions Video
Vizpad-Level Interactions Video
Auto Insights
Getting Started with Auto Insights Video
Discovery Insights Video
Segment Insights Video
Trend Insights Video
Comparison Insights Video
Iterate on Insights Video
Tellius Feed Video
Predict - ML Modeling
Getting Started with Predict Video
AutoML Configuration Video
AutoML Leaderboard Video
Point-n-Click Regression Video
Point-n-Click Classification Video
Point-n-Click Clustering Video
Point-n-Click Time Series Video
Point-n-Click PythonML Video
PredictAPI Video
Apply ML Model Video
ML Refresh and Schedule Video
Admin
Best Practices & FAQs
API Documentation
Vizpad APIs
User & user groups APIs
Machine Learning APIs
Fall 2023 (4.3)
Table of Contents
Metadata View

To get holistic visibility of the context of each column present in a dataset, we have introduced metadata (information about the data) view. When dealing with any dataset, the metadata view equips you with all the necessary information required to understand the purpose of each column. It enables you to easily select multiple columns and perform bulk operations in just a few clicks. During data preparation, you can also sort the values in each column as required.
To ensure the best results, we highly encourage you to clean and organize your data before performing an analysis. This helps Tellius understand your data better and provide results accordingly.
- Navigate Data → Prepare → Metadata and select the required business view from the Datasets pane.
- The column names will be displayed along with the following metadata:
- Display name
- Data format
- Special type
- Data aggregation
- Synonyms
- Rank
- Indexing
- Column type
- Feature type
- Column description
- In each column header, click on the ↓ to sort the values in ascending order or ↑ to sort the values in descending order.
- Hover over any info icon next to the column header to view the contextual tooltips and get a quick idea of each metadata.
- Click on the Edit button to edit the metadata of any column(s).
- After performing the required changes, click on Publish to save the changes or Cancel to discard changes.
Here are the steps to be followed to edit each type of metadata:
Display name
Display names are user-friendly names given to the columns in a dataset. Throughout Tellius, only display names would be used to refer to any column (not column names). To rename a column, you can change the display names (instead of changing column names), as it ensures no disruptions when data is refreshed.
From the metadata view,
- For a required column, click on Click to edit under Display Name.
- Provide the desired display name.
Data type
The data type of the values can be changed only under Data subtab.
To change the data type,
- Navigate Data → Prepare → Data.
- Click on the Edit button.
- Click on the dropdown arrow next to any column name and choose Data Type.
- Choose the required data type:
- String - for characters and text
- Double - for floating point numbers
- Date - for values containing dates
- Integer - for numerical values
- Timestamp - for values with both date and time
- Click on Submit to save the changes, or Cancel to discard.
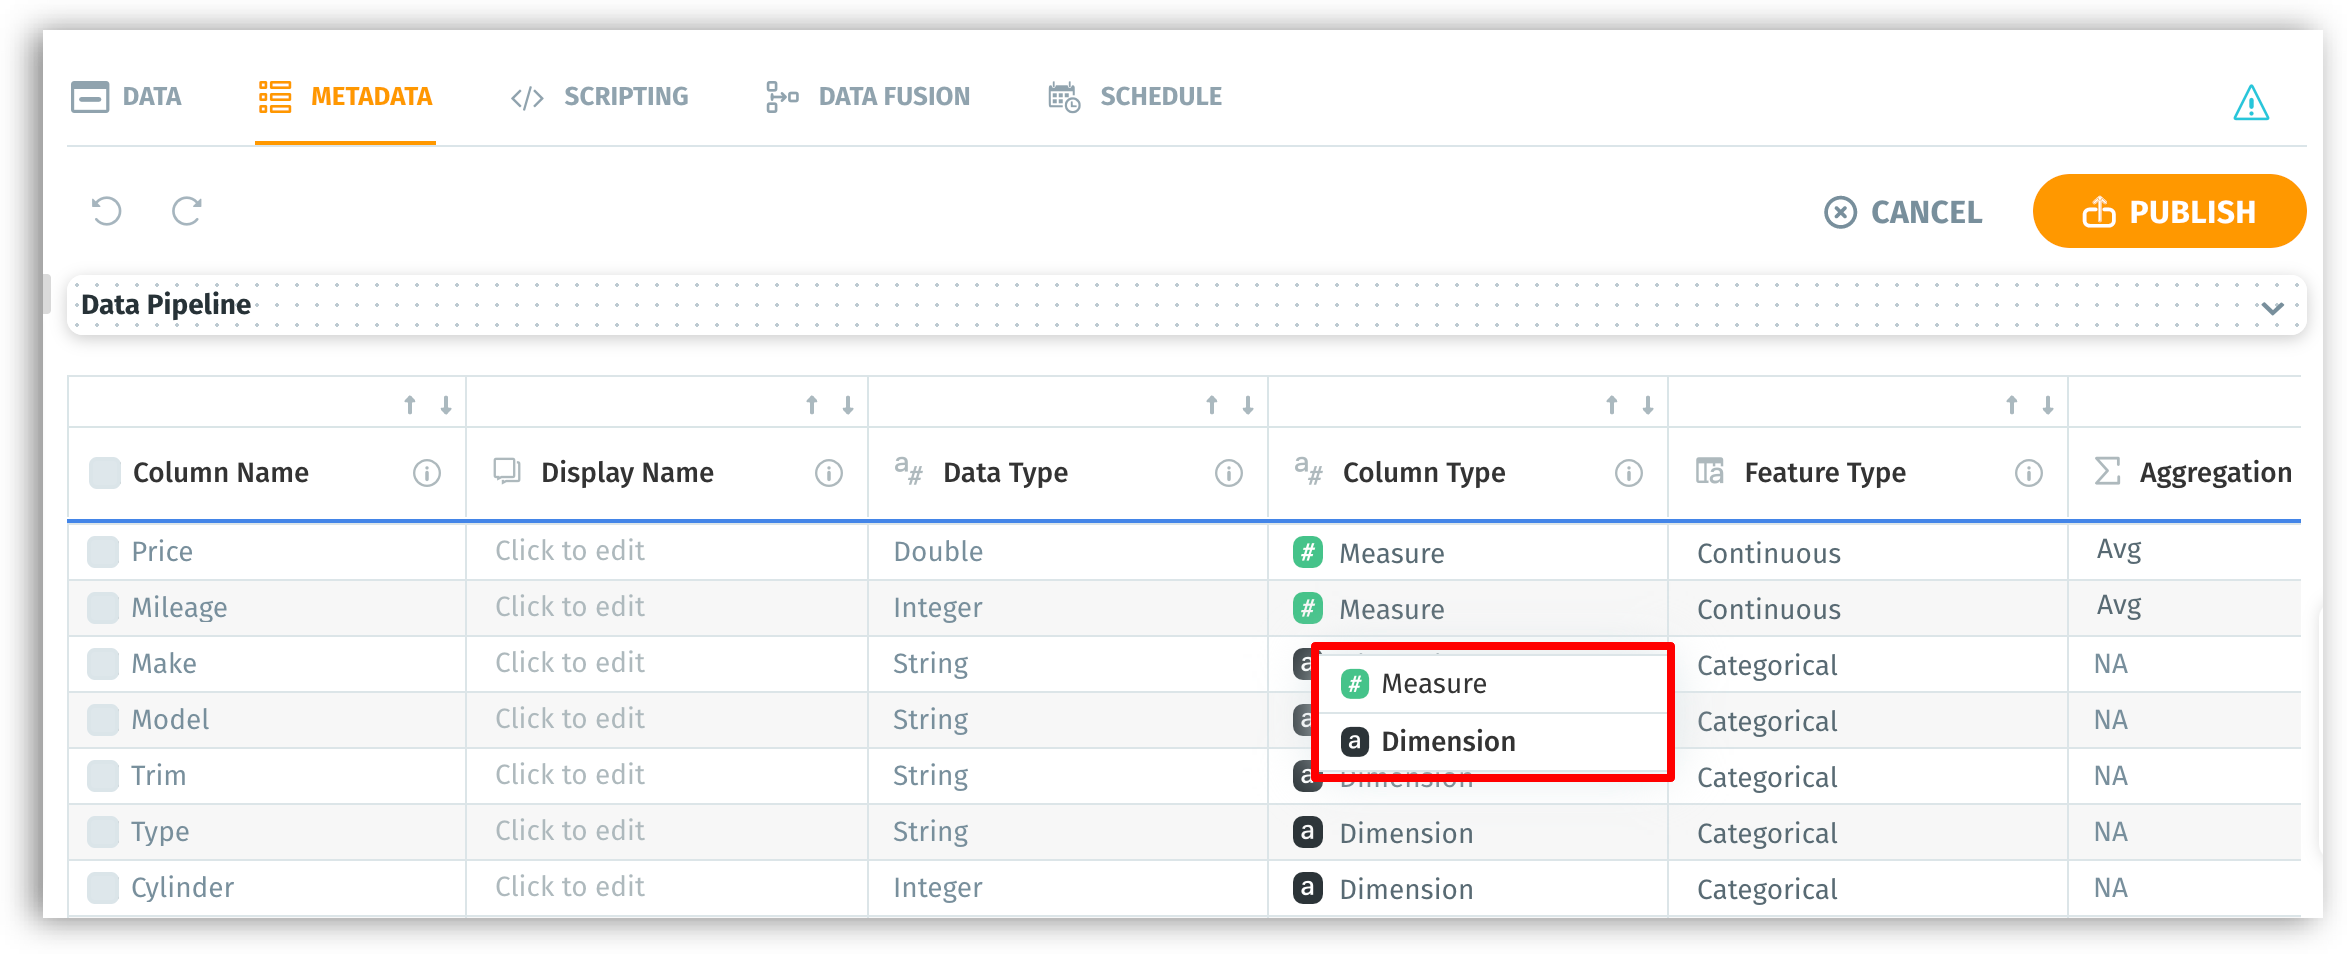
Column type
The column type could be either one of the following:
Measure - quantitative values (e.g., sales, profit, cost) which can be aggregated (e.g., sum, average, min, max)
Dimension - qualitative values (e.g., city, region, date) which cannot be aggregated
Choose the column type as “dimension” if the values can be used to categorize or segment the data (e.g., show sales by city, show profit by year).
The aggregation and data format of dimensions will be “N/A”.
The feature type of dimensions can only be “Categorical”.
From the metadata view,
- For any required column name, click on the dropdown under Column type.
- Choose Dimension or Measure as required.
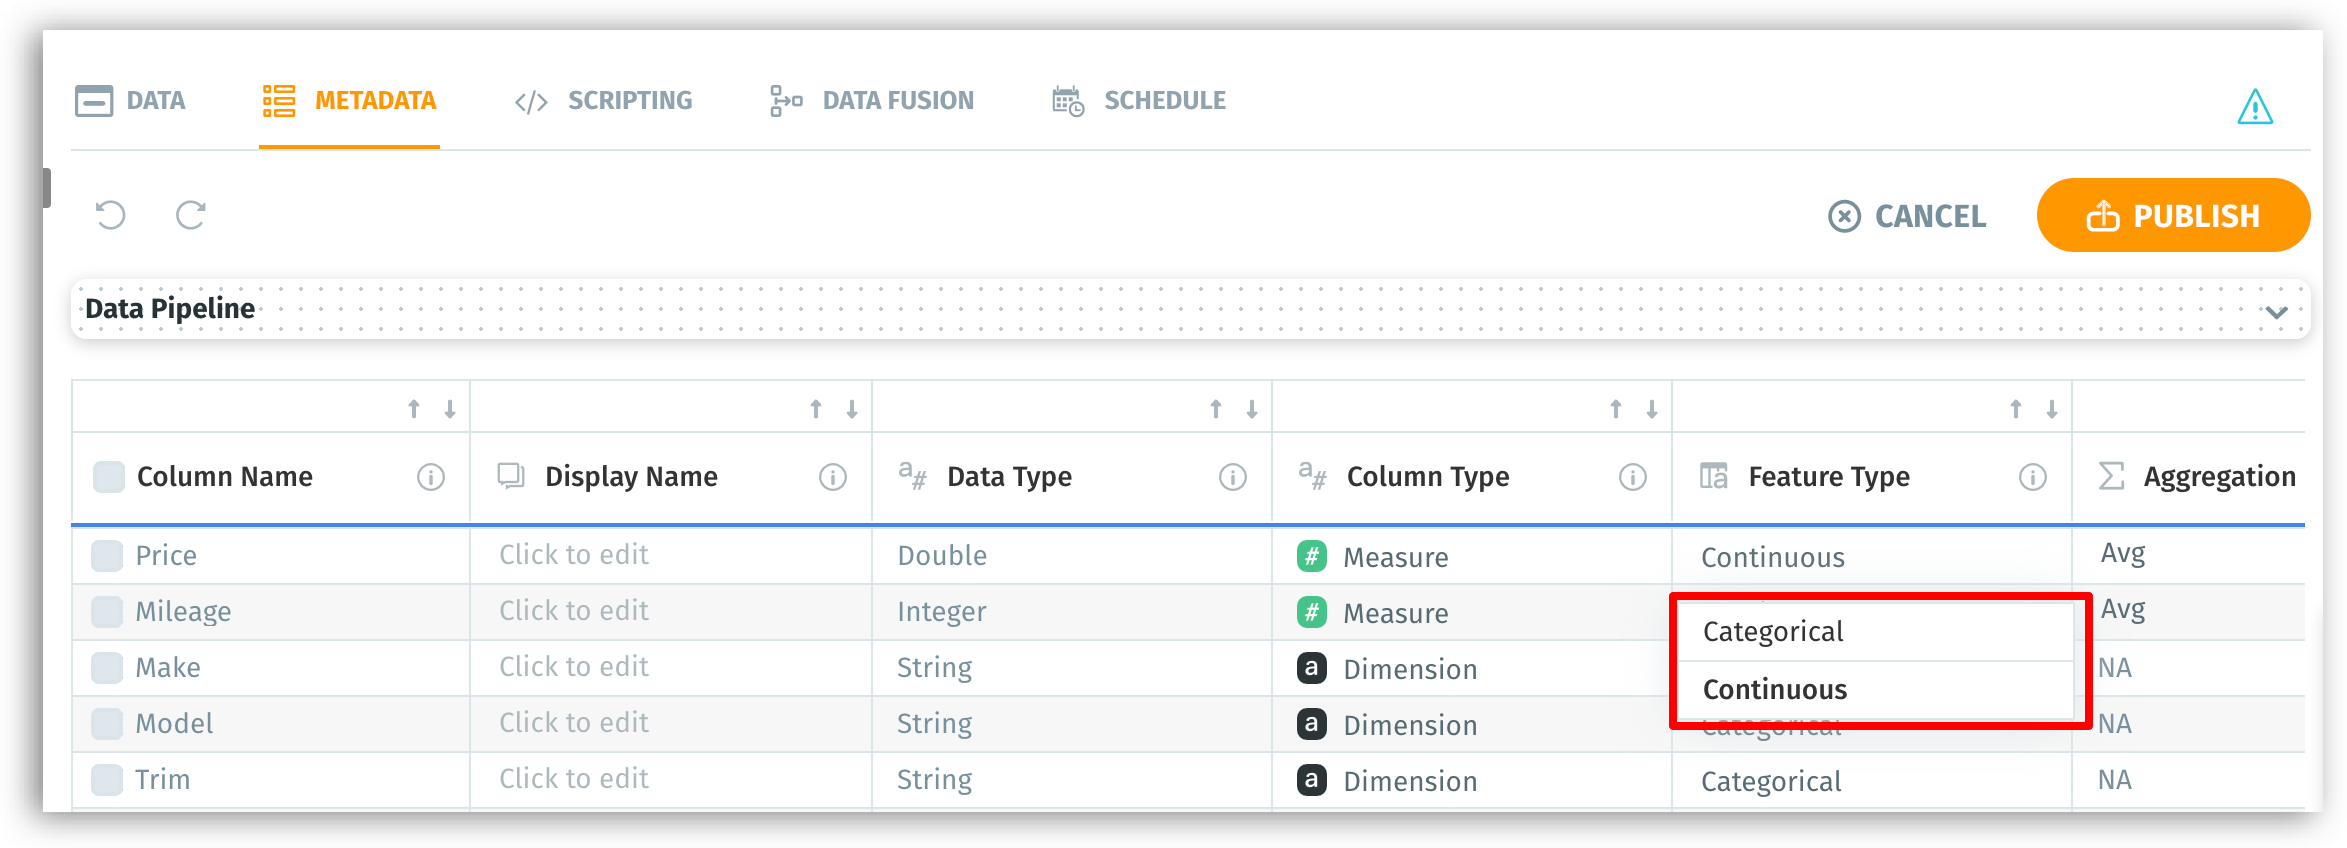
Feature type
The feature type of a value can be either one of the following:
Categorical - discrete variables; a fixed number of possible values (e.g., the values for the column ‘Continent’ can be one of the 7 values)
Continuous - variables from a range of values between a theoretical minimum and maximum (e.g., the values for the columns ‘height’, ‘weight’, ‘temperature’)
From the metadata view,
- For any required column name, click on the dropdown under Feature type.
- Choose Categorical or Continuous as required.
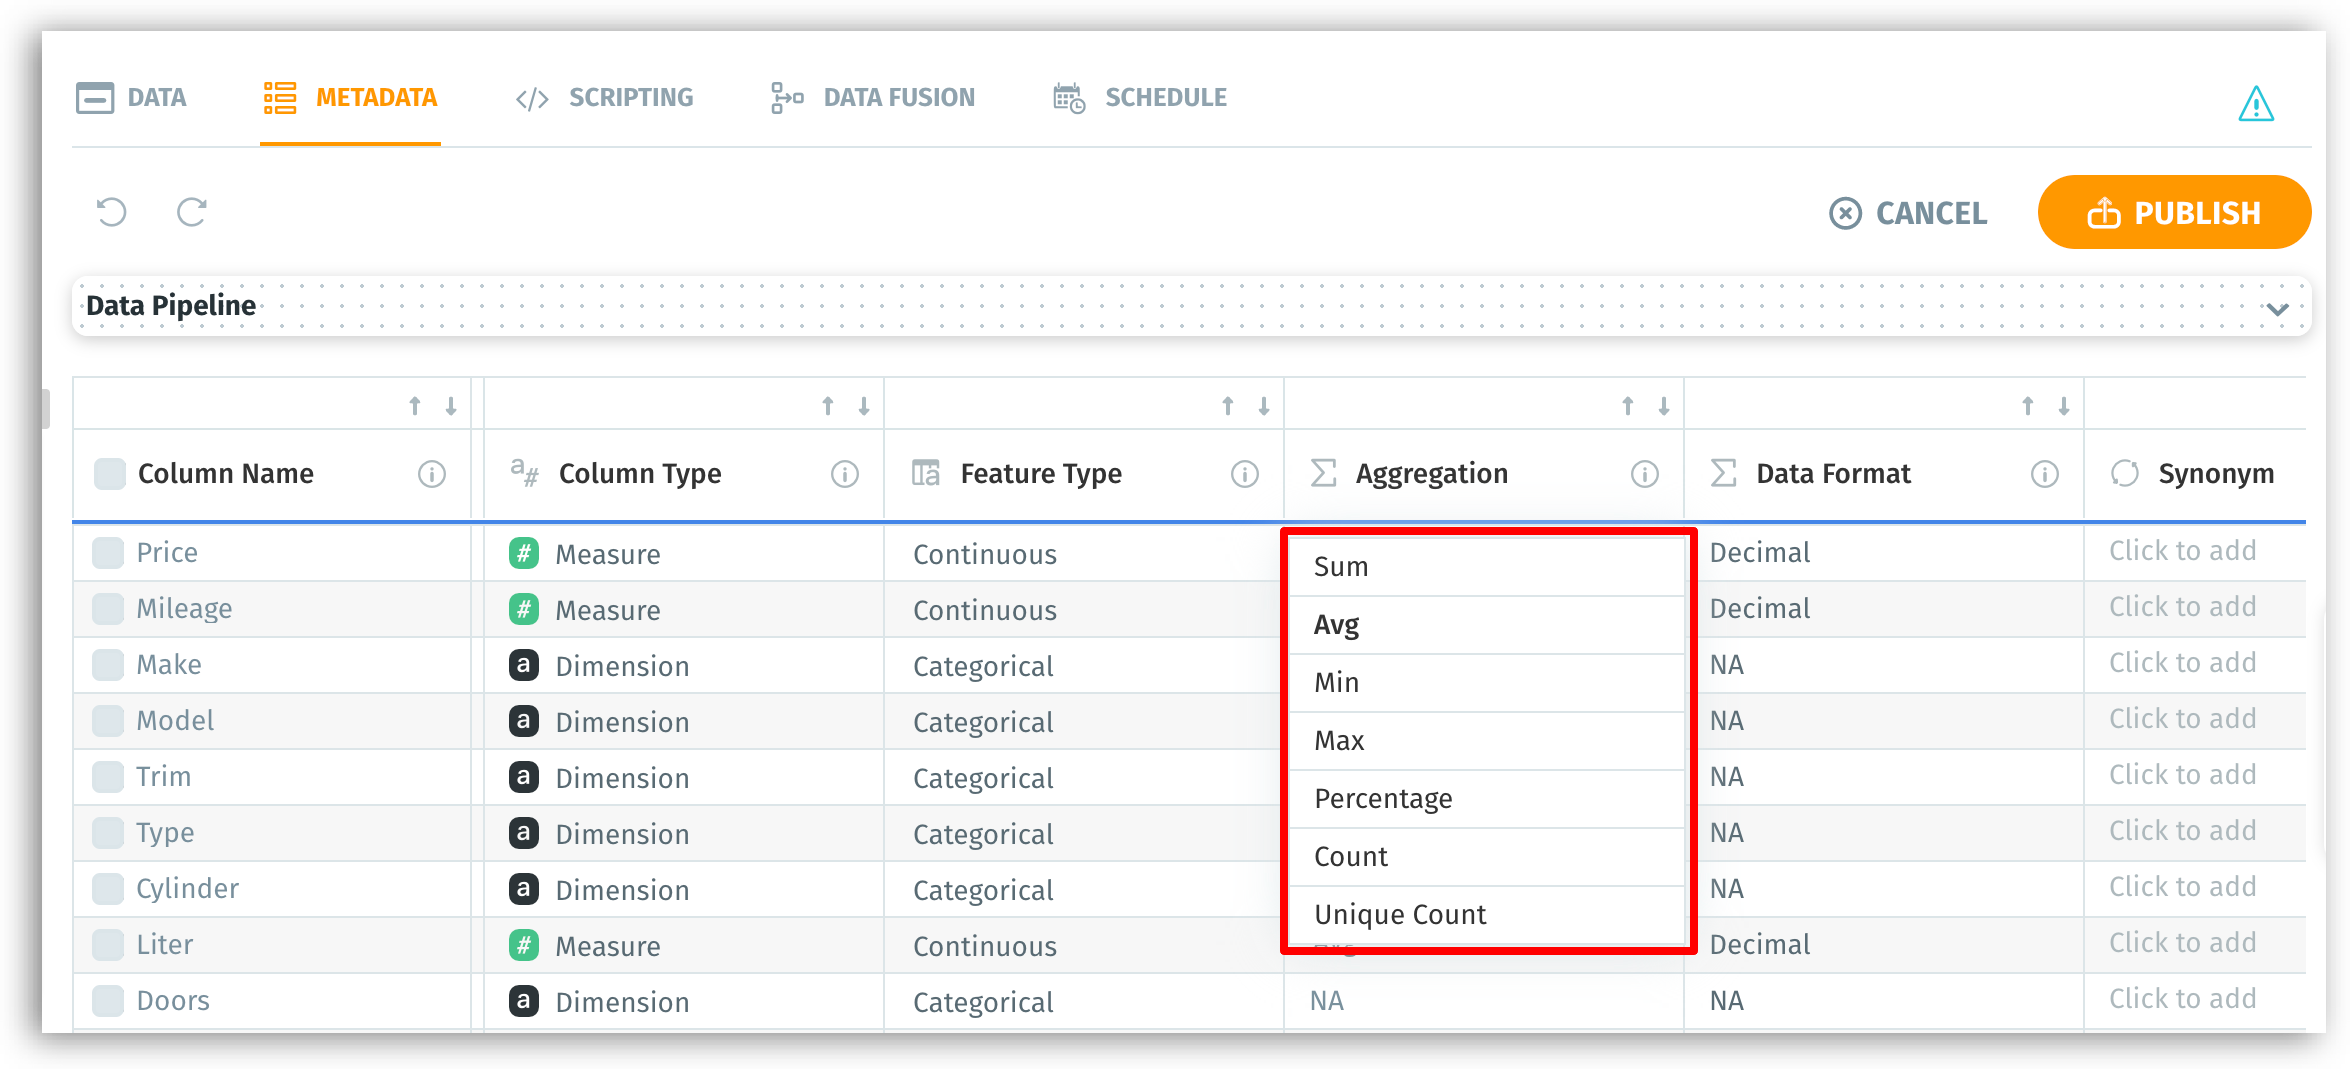
Aggregation
A collection of values can be aggregated to form a single value. The value set up will be used as the default aggregation for the associated measure across Tellius, and it can be changed when required. The default aggregation can be set in the following ways:
From the metadata view,
- For the required column name, click on the dropdown under Aggregation.
- Choose one from the following options:
- Sum - the total sum of the values
- Avg - average of the values
- Min - minimum of all the values
- Max - maximum of all the values
- Count - number of values in the column
- Unique count - number of distinct values in the column
- Percentage - the percentage of all the values in the column
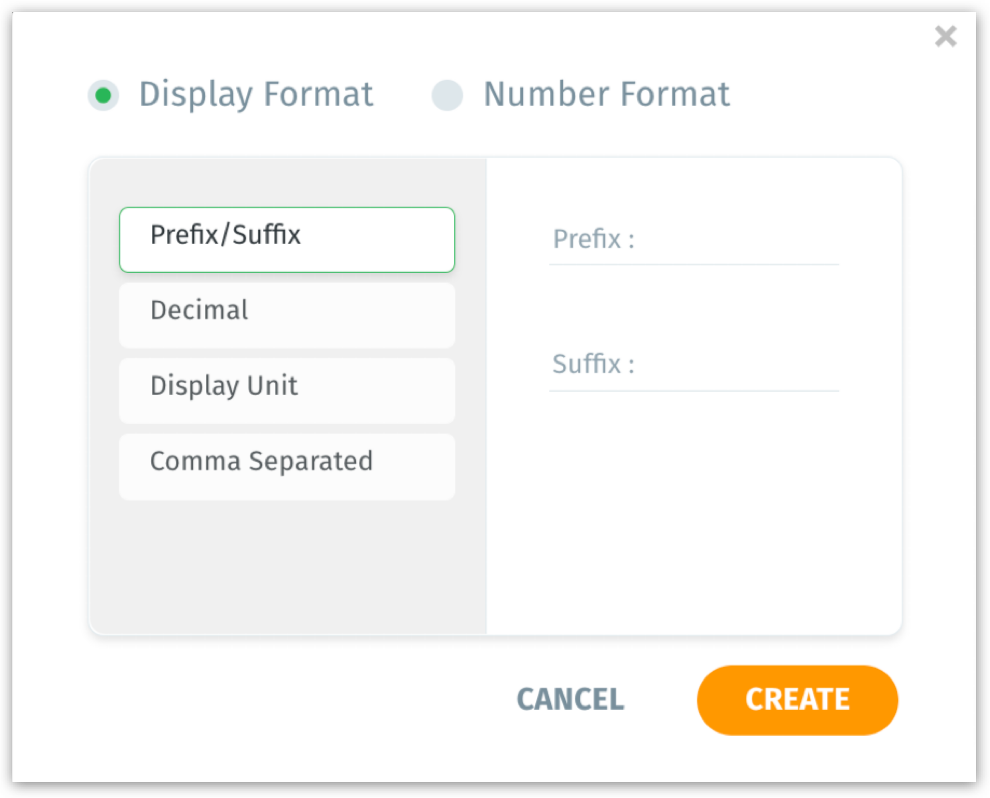
Data format
Data format indicates the format (e.g., prefix/suffix, comma separation, decimal units) in which the data is represented in a dataset.
From the metadata view,
- For any required column name, click on the dropdown under Data format.
- Choose the required data format from the list.
Special type
Based on the data type (integer, string, timestamp) of the column, a list of Special types will be displayed. If the column is used in a search query, the results will be displayed according to the selected Special type.
- If a Special type is assigned for integer, double, and string data types, search results will be displayed in Map charts instead of regular bar/line charts.
- If a Special type is assigned for timestamp data types, the column will be selected as the primary date column for time/date-related search queries.
Integer and double data type
- For any required column name, click on the dropdown under Special type.
- Select the required Special type from the list of options displayed:
- Map Longitude
- Map Latitude
- Zip
- If Map Latitude is selected, the following window will appear for you to choose the column for Map Longitude (and vice versa).
- Provide a name in the Geospatial Grouping Name field.
- Since the latitude column is already selected, choose the complementary longitude column from the dropdown under Select Longitude Column.
- Click on Select to continue or click on Cancel to dismiss.
- Now, if the column is used in a search query (under Search), the results will be displayed in the Map chart. According to the Special type selected, the values will be plotted on the chart.
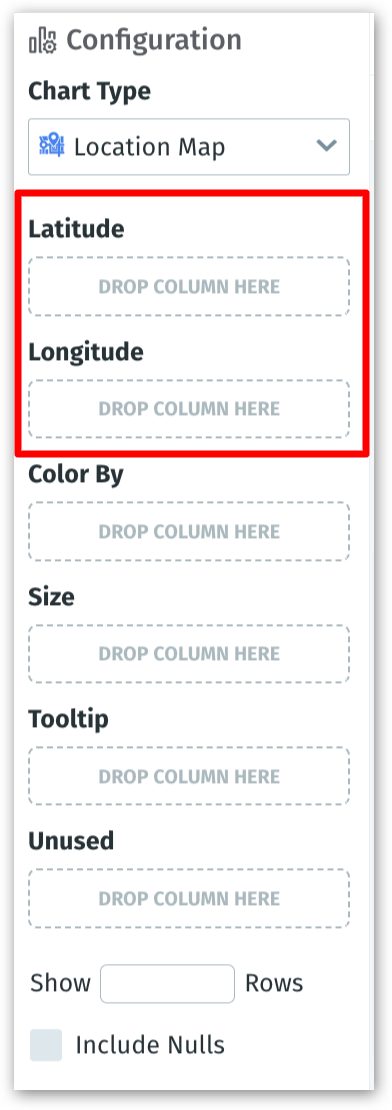
- While creating Location Maps chart type in a Vizpad (Explore)
- Columns can be added to Latitude and Longitude fields only if their Special type is set to Map Latitude/Map Longitude.
- Instead of drag-and-drop, when you double click the columns whose Special type is set to Map Latitude/Map Longitude from the Business View pane, they will be automatically added to the corresponding Latitude/Longitude fields.
String data type
- For any required column name, click on the dropdown under Special type.
- Select the required Special type from the list of options displayed:
- Country
- State
- City
- County
- Zip
- Now, if the column is used in a search query (under Search), then the results will be displayed in the Map chart. According to the Special type selected, the values will be plotted on the chart. For example, when you search
Show profit by country, instead of a regular bar/line chart, the results will be displayed in a Boundary Map chart.
Timestamp data type
- For any required column name, click on the dropdown under Special type.
- The chosen column will be picked as the primary date column for any time/date-related search queries entered in Search.
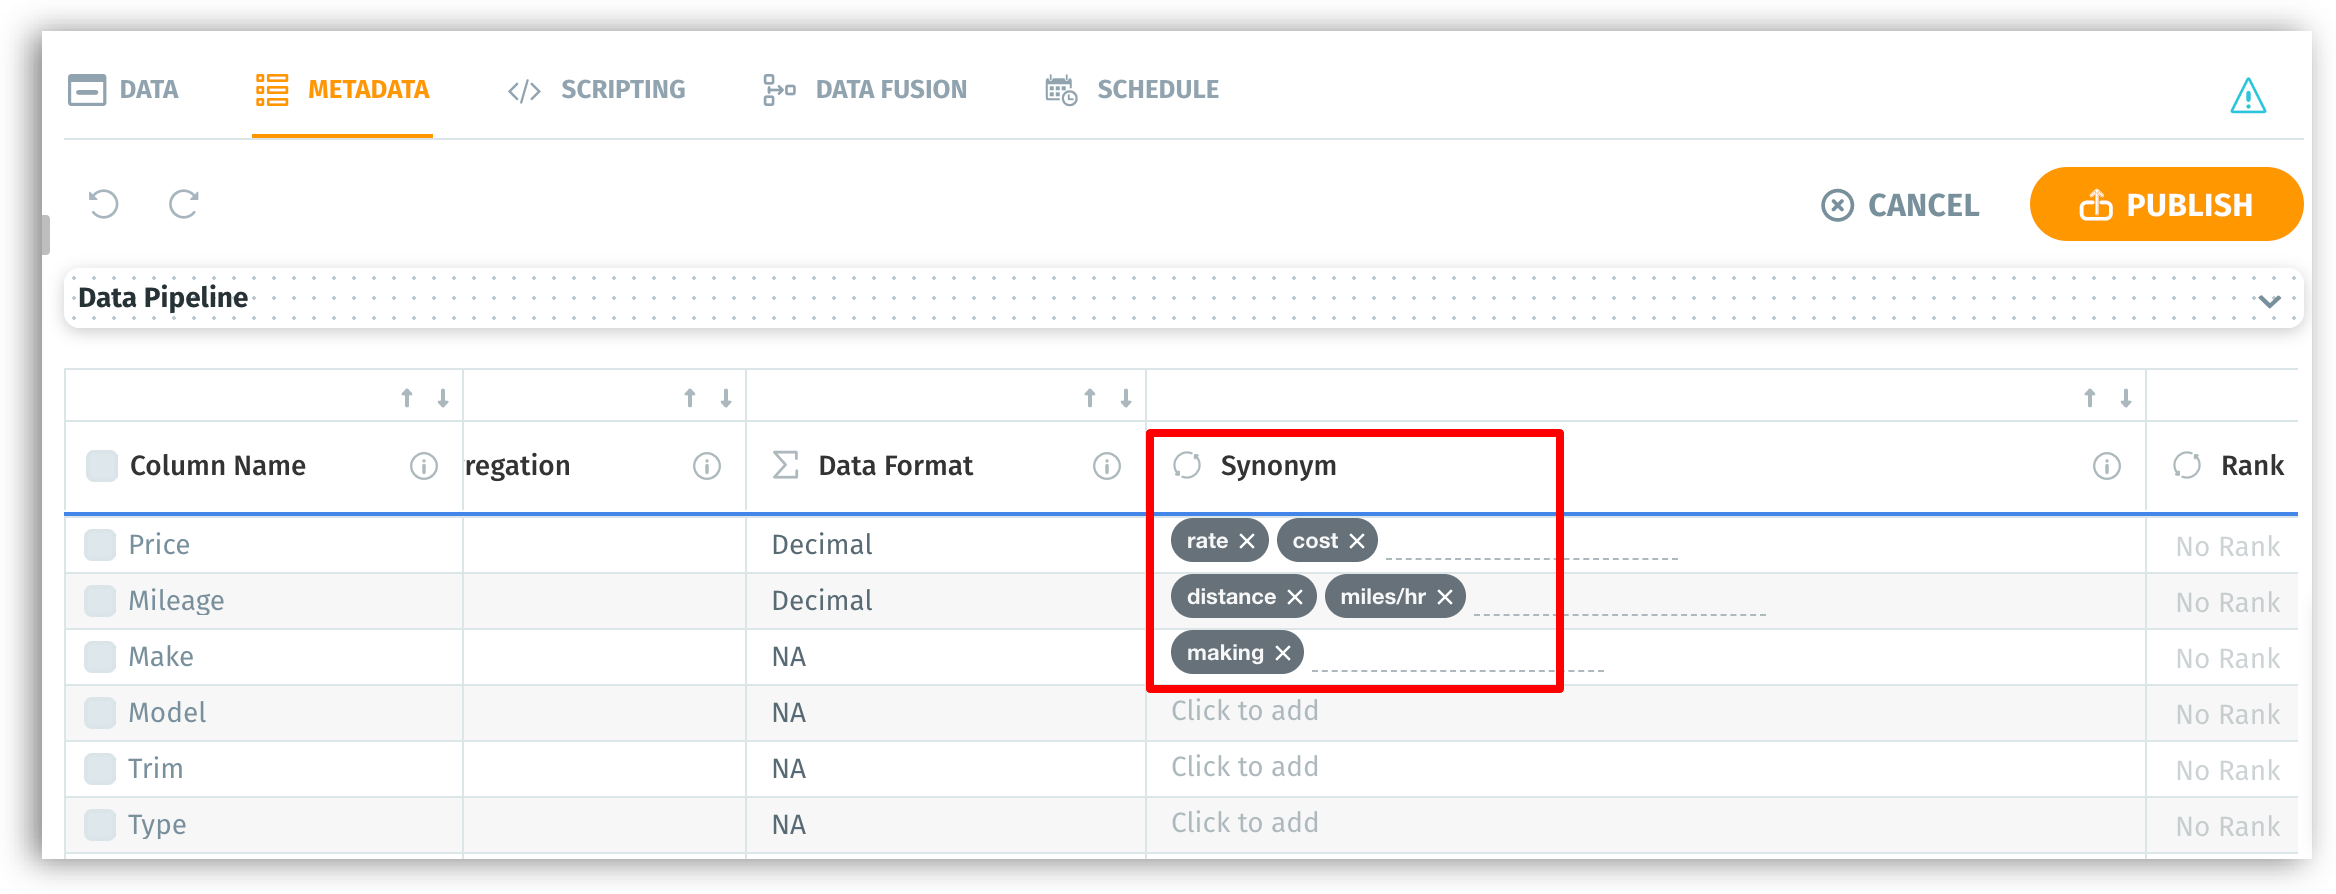
Synonyms
Sometimes, a category could be called using multiple names by different team members. Such additional names could be added under Synonyms. They are alternative names that you could provide for a column name. Synonyms can be used instead of the actual column name or display name in search queries.
From the metadata view,
- For any required column name, click on the Synonyms cell.
- Provide a synonym and press "Enter"/"Return". Include as many synonyms as required.
Rank
Tellius allows you to rank the columns (from 1 to 20) so that the prioritized columns would be used in Live Insights over the non-ranked columns. By default, there will be no ranking associated with any column in a live dataset. Each rank assigned to a column is unique, i.e., no two columns can have the same ranking.
From the metadata view,
- For any required column name, click on the dropdown No Rank under Rank.
- Choose the required ranking from 1 to 20.
While creating Live Insights, the rank of every column will be displayed under Column Selection.

If ranks (from 1 to 20) are provided, then the ranked columns will be considered. If the columns are not ranked, then Tellius will auto-select 20 columns.
Include in Insights
Select the columns that need to be considered for the creation of Insights under the Discover tab. The columns can also be included/excluded while creating Insights.
From the metadata view,
- If you want to include a column for the creation of Insights, click on the toggle button under Include in Insights.
- To exclude a column, switch the toggle to “No”.
- The excluded columns will be displayed in the Insights summary with the reason “Excluded configured in Data Prep”.
The columns included/excluded in this metadata view will be reflected when an Insight is created (Insight Configuration).
- Under Included, the columns selected in the metadata view will be displayed.
- The unselected columns will be displayed under Excluded columns, along with the reason for exclusion.
- Users have the flexibility to drag and drop the required columns from Included to Excluded and vice versa.
- The number of columns under Included and Excluded will also be displayed, along with the option to Select/Deselect all the columns.
A column can be excluded for multiple reasons. Tellius follows the below order of priority to exclude a column:
- Target column (excluded since the column is used as a target for insights)
- Cohort column (excluded since the column is used to form a cohort for comparison)
- Date column (excluded since the data type of a column is date or timestamp)
- Cardinality (excluded since the column consists of unique values - e.g., email ID)
- Data preparation (excluded since the user unselected it in the metadata view during data preparation)
- User excluded (since it was excluded during the creation of Insights)
- Personalization (Excluded by the user after the insight has been generated; from Is the Insight helpful —> Help Tellius learn —> Exclude columns)
- Correlated (since the column is correlated with some other column)
- Excluded in top features (only the top 6 key drivers are considered based on feature importance)
Once an Insight has been created, its corresponding details will be displayed in Insight Summary. It displays the included and excluded columns with the reason for exclusion.
Include in Predict
Select the columns that need to be considered for the creation of Models under Predict tab.
From the metadata view,
- If you want to include a column for Models, click on the toggle button under Include in Predict.
- To exclude a column, switch the toggle to “No”.
Index column
When a search query is executed, only the values of indexed columns are considered for processing the results of a query.
- The columns set to Default will be considered for the search results.
- The values of the column set to Don’t Index will be excluded from the search results.
From the metadata view,
- For the required column, click on the dropdown under Index Column.
- Choose the value as Default to include the column, and Don’t index to exclude the column.
Description
Column description helps you understand the context of each column. When you hover over any column across Tellius, the corresponding data description will be displayed in the tooltip along with the column type (measure/dimension). By default, there will be no description associated with a column.
The following are the places where the description will be displayed when hovered:
Search:
- When hovered over any column in Search guide, Search Inspector, search history, and the right panel where the list of columns in a Business View is displayed.
- When hovered over any axis label/ legend label on a chart.
Explore:
- When hovered over a column in the right panel where the list of columns in a Business View is displayed.
- When hovered over a column in the filter list on a chart.
To add description: From the metadata view,
- For the required column, click on Click to edit under Description.
- Provide the required description within 2000 characters.
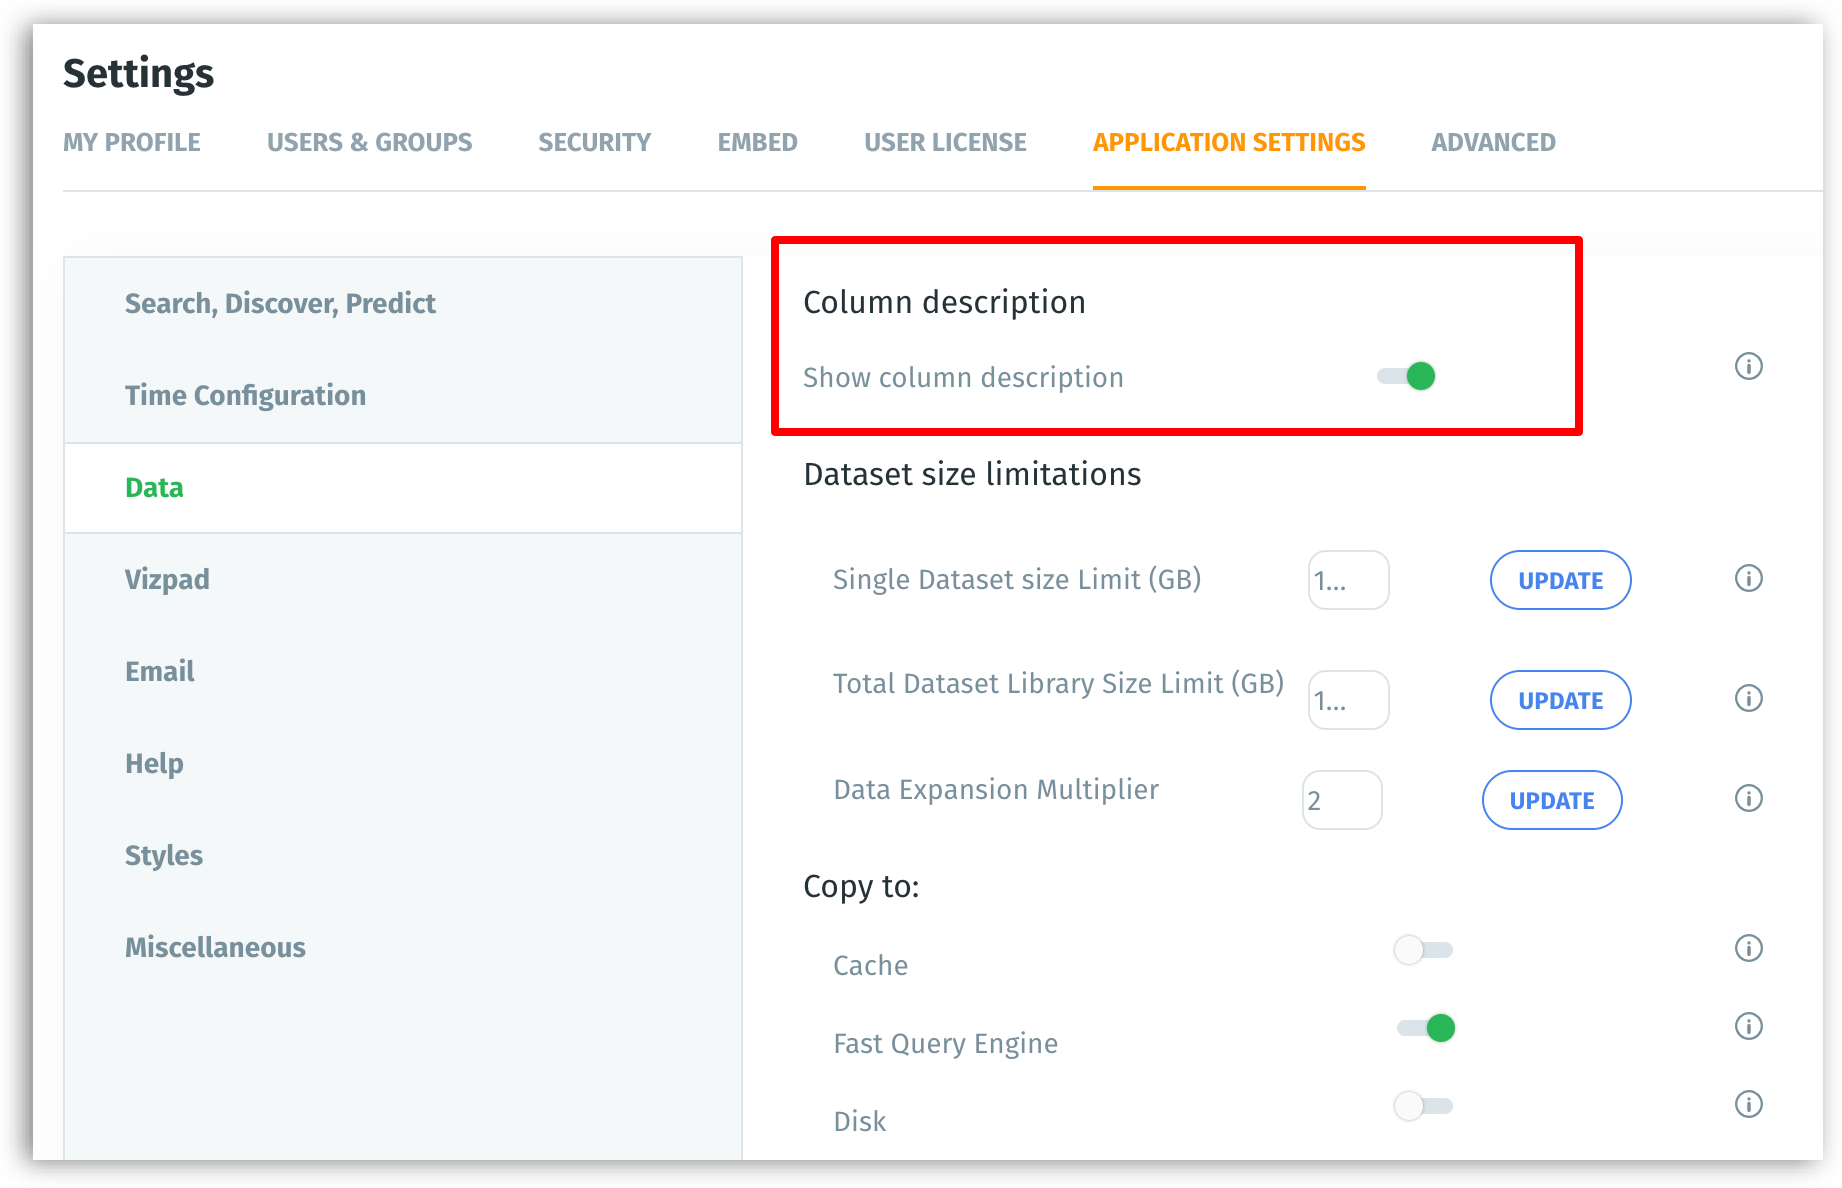
To hide the description tooltips, navigate Settings -> Application Settings -> Data and disable the Show Column Description toggle under Column description.
Bulk operation
From the metadata view, Tellius offers the flexibility to select multiple columns and apply changes to them as required. To perform bulk operations,
- Select the required columns by clicking on the checkbox near the Column name.
- The following metadata can be modified in bulk:
- Column type
- Feature type
- Aggregation
- Data format
- Include in Discovery
- Include in Insight
- Include in Predict