What's New
Changelog - 5.0.1
Release 5.0
Changelog - 4.3.4
Changelog - 4.3.3
Changelog - 4.3.2
Changelog - 4.3.1
Release 4.3 (Fall 2023)
Changelog - 4.2.7
Changelog - 4.2.6
Changelog - 4.2.5
Changelog - 4.2.4
Changelog - 4.2.3
Changelog - 4.2.2
Changelog - 4.2.1
Release 4.2
Changelog - 4.1.5
Changelog - 4.1.4
Changelog - 4.1.3
Changelog - 4.1.2
Changelog - 4.1.1
Release 4.1
Release 4.0
Release 3.9
Release 3.8
Release 3.7
Release 3.6
Release 3.5
Release 3.4
Release 3.3
Release 3.2
Release 3.1
Release 3.0
Release 2.4.1
Release 2.4
Free Cloud Trial
Release 1.8
Release 2.3
Release 2.2
Release 2.1
Release 2.0
Release 1.7
Release 1.6
Release 1.5
Getting Started
Quick Guide
Best Practices Guide
Search - Best Practices
Vizpads (Explore) - Best Practices
Insights (Discover) - Best Practices
Predict - Best Practices
Data - Best Practices
Glossary
Tellius 101
Navigating around Tellius
System requirements
Tellius Architecture
Installation steps for Tellius
Guided tours for quick onboarding
Customizing Tellius
Tellius Copilot 101
Search (Natural Language)
Search in Tellius
Guide Me
How to Search
Business View List / Columns
Query
Query
Percentage Queries
Time Period Queries
Live Query
Generating Insights-based queries from Search
Search Result
Discover Insights
Interactions
Chart Operations
Add to Vizpad
Table View
Switch Chart type
Change Chart Config
Apply Filters
Change Formatting
Measure Aggregation - Market Share Change
View Raw Data
Download/ Export
Embed URL
Partial Data for Visualization
Best-fit visual
Add to Vizpad
Adding the chart to a Vizpad
Customize the auto-picked columns
Search Query Inspector
Teach Tellius
GPT mode in Search
History
Guided Search
Add Guided Search Experience
Display Names in the Search Guide
Guided Search
Guided Search Syntax and Attributes
Deep Dive
Maps in Search
Search Keywords
Percentage Queries
Time Period Queries
Year-over-Year Analysis
Additional Filters
Pagination
List View In Search Results
Marketshare queries
Embed Search
Personalized Search
Search Cheat Sheet
Filters in Help Tellius Learn
Explore (Vizpads)
Dashboards in Tellius
Vizpad Creation
Create Interactive Content
Create Visualization Charts
List of Charts
Common Chart Types
Line Chart
Bar Chart
Pie Chart
Year-over-Year Functionality in Vizpad
Area Chart
Combo Chart
KPI Target Chart
Treemaps
Bubble Chart
Histogram
Heat-Map Charts
Scatter Chart
Other Charts
Cumulative line chart
Cohort Chart
Explainable AI Charts
For each chart
Create Visualization Charts
Global Filters
Embedded Filters
Other Content
Anomaly management for charts
Creating Interactive Content
Vizpad level Interactions
Viz level Interactions
Discover Insights
Drivers
Discover hidden insights - Genius Insights
How Genius Insights works
Discoveries in Insight
Anomalies on Trend
Interactions
Chart Operations
Switch Chart type
Change Chart Config
Apply Filters
Change Formatting
Add X/Y Axis Target Lines to Scatter Chart
Improvements to Conditional Formatting
Adding Annotations to Tables
Displaying query execution time
AI summaries
Embedding Vizpad
Vizpad Consumption
Collection of Interactive Content
Vizpad level Interactions
Global Filter on the fly
Global Resolutions
Refresh
Notifications / Alerts
Share
Download / Export
Unique name for Vizpads
Edit Column Width
Viz level Interactions
Importing bulk filter values
Multi-Business View Vizpads
Discover (Genius Insights)
Discoveries
What are discoveries
Type of Discoveries in Tellius
Create Discoveries
Kick-off Key Drivers
Edit Insights
Key Driver Insights
Components of Key Drivers
What are Key Drivers
Edit Key Driver Insights
Segment Drivers
Trend Drivers
Trend Insights (Why Insights)
Components of Trend Insights
WHAT: Top Contributors
WHY: Top Reasons
HOW: Top Recommendations
Seamlessly navigating to "Why" from "What"
Create Trend Insight
Edit Trend Insights
What are Trend Insights
Comparison Insights
Components of Comparison Insights
Create Comparison Insight
What are Comparison Insights
Edit Comparison Insights
Others Actions
Save
Refresh
Share Insights
Download
Adding Insights to Vizpad
Insights Enhancements
Embedding Insight
Impact Calculation for Top Contributors
Marketshare
Live Insights
Predict (Machine Learning)
Machine Learning
AutoML
How to create AutoML models
Leaderboard
Prediction
Others
What is AutoML
Point-n-Click Predict
Feed (Track Metrics)
Assistant (Conversations)
Tellius on Mobile devices
Data (Connect, Transform, Model)
Connectors
Connector Setup
Google BigQuery
Google Cloud SQL
Connecting to a PostgreSQL Cloud SQL Instance
Connecting to an MSSQL Cloud SQL Instance
Connecting to a MySQL Cloud SQL Instance
Snowflake
PrivateLink
Snowflake Best Practices
OAuth support for Snowflake
Integrating Snowflake with Azure AD via OAuth
Integrating Snowflake with Okta via OAuth
Edit Connector
Live Connect
Data Import
Cache
Direct Business View
JDBC connector for PrestoDB
Amazon S3
Looker SQL Interface
Databricks
Connecting to an AlloyDB Cluster
List of Connectors by Type
Tables Connections
Custom SQL
Schedule Connector Refresh
Share Connections
Datasets
Load Datasets
Configure Datasets (Measure/Dimensions)
Transform Datasets
Create Business View
Share Datasets
Copy Datasets
Delete Datasets
Swapping datasources
Metadata migration
Data Prep
Datasets
Data Profiling / Statistics
Transformations
Dataset Transform
Aggregate Transforms
Calculated Columns
SQL Transform
Python Transform
Create Hierarchies
Filter Data
SQL Code Snippets
Multiple Datasets Scripting SQL
Column Transforms
Column Metadata
Column type
Feature type
Aggregation
Data type
Special Types
Synonym
Rename Column
Filter Column
Delete Column
Variable Display Names
Other Functions
Metadata View
Dataset Information
Dataset Preview
Alter Pipeline Stage
Edit / Publish Datasets
Data Pipeline (Visual)
Alerts
Partitioning for JDBC Datasets
Export Dataset
Write-back capabilities
Data Fusion
Schedule Refresh
Business Views
Create Business View
Create Business View
Datasets Preview & List
Add datasets to Model
Joins
Column selection
Column configuration
Primary Date
Geo-tagging state/country/city
Save to Fast Query Engine
Publish
Business View
What is Data Model
BV Visual Representation (Preview)
BV Data Sample
Learnings (from Teach Me)
Custom Calculations (Report-level Calc)
Predictions on BV
BV Refresh
Export/ Download Business View
Share Business View
URL in Business View
Request Edit Access
Projects (Organize Content)
Monitor Tellius
Embedding Tellius
Embedding
Settings
About Tellius
User Profile
Admin Settings
Manage Users
Team (Users)
Details & Role
Create a new user
Edit user details
Assigning the user data to another user
Restricting the dataset for a user
Deleting a user
Assign User Objects
Teammates (Groups)
Authentication & Authorization
Application & Advanced Settings
Data
Machine Learning
Genius Insights
Usage tracking & Support
CDN
Download Business View, Dataset, and Insights for Live BV
Customize Help
Impersonate
Data Size Estimation and Calculation
Miscellaneous Application Settings
Configuration for time/date-related results
Dataflow Access
Enable In-memory operations on Live sources
Language Support
Administration
Setup & Configuration
Installation Guide
AWS Marketplace
Autoscaling
Backup and Restore
Help & Support
FAQ
Data Preparation FAQs
Environment FAQs
Search FAQs
Vizpads FAQs
Data Caching
Security FAQs
Embedding FAQs
Insights FAQs
Tellius Product Roadmap
Help and Support System
Guided Tours
Product Videos
Articles & Docs
Provide Feedback
Connect with Tellius team
Support Process
Notifications
Getting Started Videos
Getting Started
Tellius Connect
Tellius Data Overview Video
Connecting to Flat Files Video
Connecting to Data Sources Video
Live Connections Video
Data Refresh and Scheduling Video
Tellius Prep
Getting Started with Tellius Prep Video
Transformations, Indicators, Signatures, Aggregations and Filters Video
SQL and Python Video
Working with Dates Video
Data Fusion Video
Business View Video
Business Mapping Video
Report Level Calculations Video
Writeback to DB
Natural Language Search
Getting Started with Search Video
How-To Search Video
Customizing Search Results Video
Search Interactions Video
Help Tellius Learn
Explore - Vizpads
Getting Started with Vizpads Video
Creating Vizpads Video
Creating and Configuring Visualizations Video
Viz-Level Interactions Video
Vizpad-Level Interactions Video
Auto Insights
Getting Started with Auto Insights Video
Discovery Insights Video
Segment Insights Video
Trend Insights Video
Comparison Insights Video
Iterate on Insights Video
Tellius Feed Video
Predict - ML Modeling
Getting Started with Predict Video
AutoML Configuration Video
AutoML Leaderboard Video
Point-n-Click Regression Video
Point-n-Click Classification Video
Point-n-Click Clustering Video
Point-n-Click Time Series Video
Point-n-Click PythonML Video
PredictAPI Video
Apply ML Model Video
ML Refresh and Schedule Video
Admin
Best Practices & FAQs
API Documentation
Vizpad APIs
User & user groups APIs
Machine Learning APIs
Fall 2023 (4.3)
Table of Contents
- All Categories
- What's New
- Changelog - 4.2.3
Changelog - 4.2.3

We're excited to announce the release of Tellius v4.2.3, a substantial step forward in providing an enhanced, intuitive, and streamlined user experience. We've introduced new features, including robust search functionality across various sections, additional formatting options for charts, and the ability to handle calculated columns in bulk. We believe these changes will improve your data management and visualization capabilities.
🚀 New features
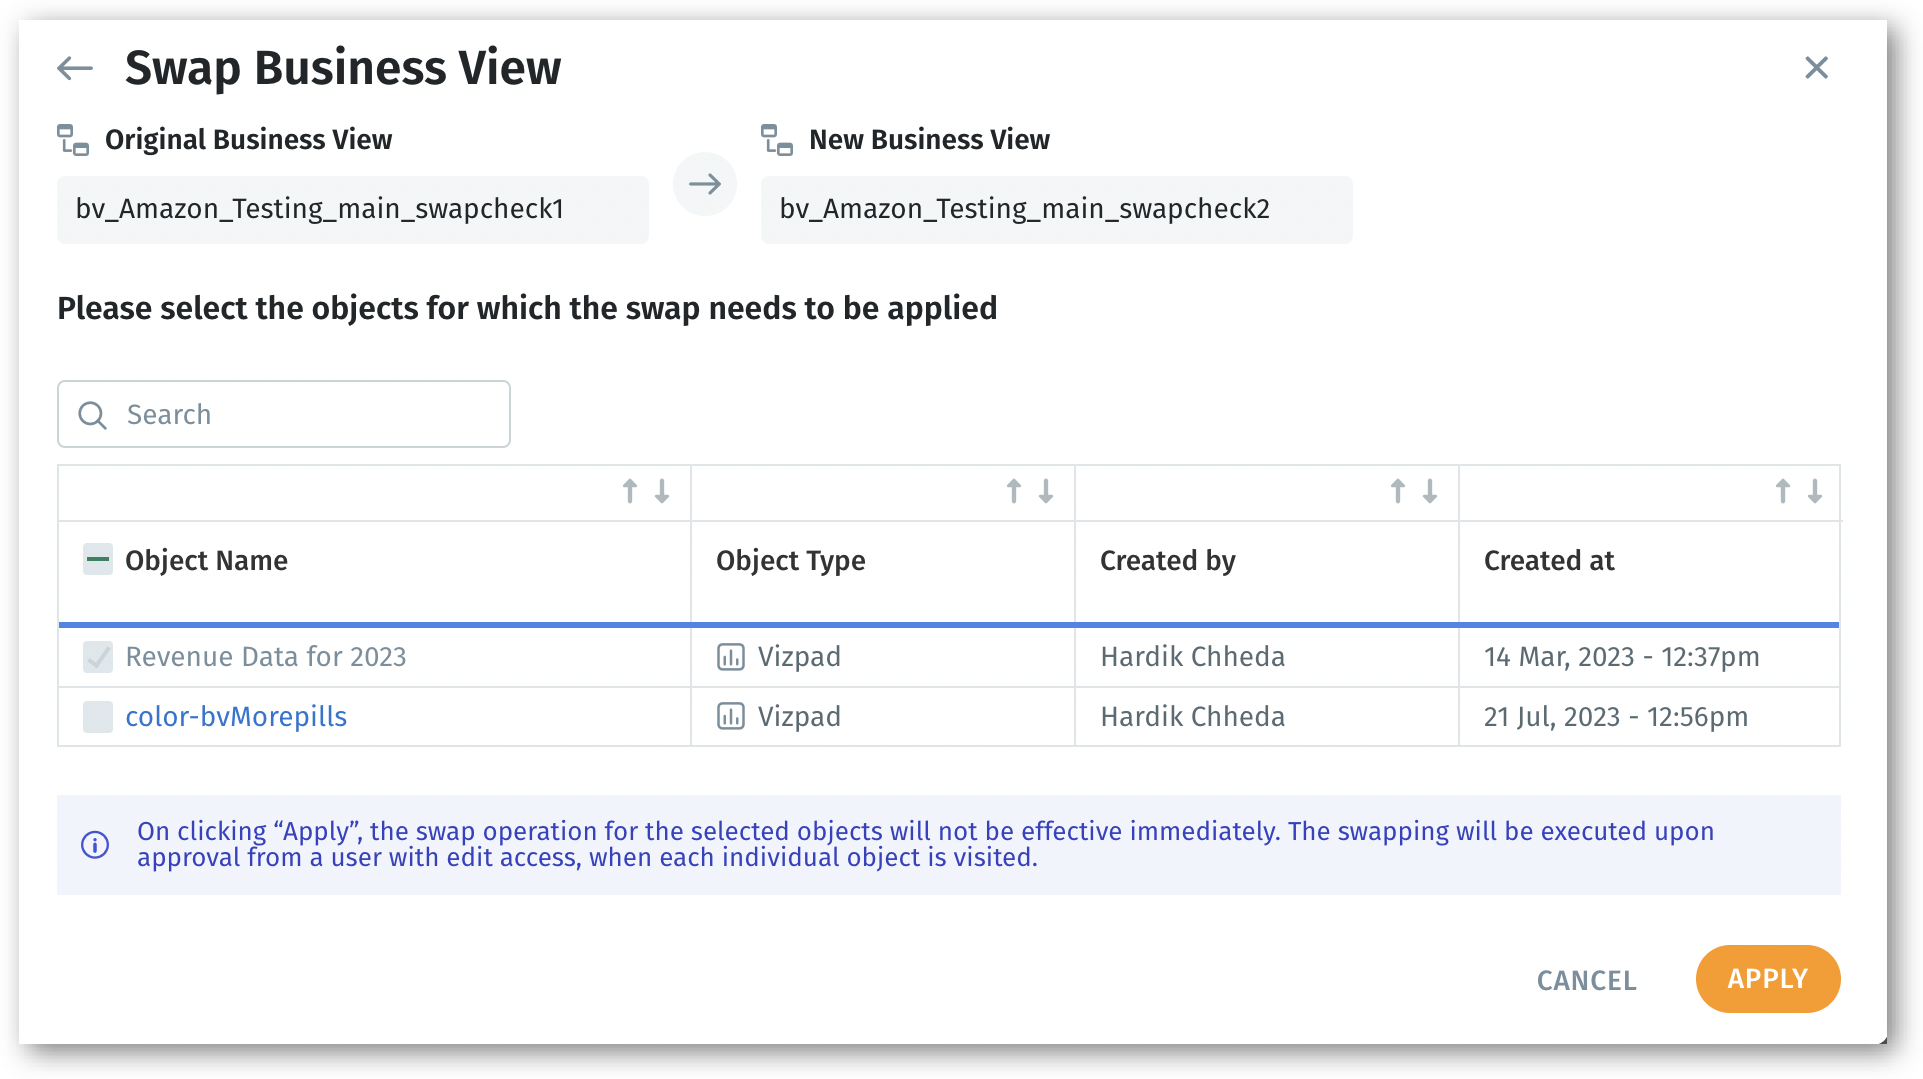
Swapping of Business Views for multiple objects
While swapping the underlying Business View of any object, users can simultaneously select multiple objects (Vizpads/Insights/Models) for which the Business Views need to be swapped. The swapping operation of the selected objects can be set up and will be effective once it is approved by a user with edit access.
Google CloudSQL + AlloyDB connectors
We are excited to introduce CloudSQL Connectors, further enhancing our commitment to seamless integration.
Google Cloud Platform's (GCP) Cloud SQL simplifies the process of setting up, managing, and administering relational databases on Google Cloud Platform. With this release, we've integrated CloudSQL connectors to directly access your MySQL, MSSQL, and PostgreSQL Cloud SQL instances from the Tellius platform. Additionally, we’ve introduced a new connector for AlloyDB, which allows you to establish a connection from Tellius to your AlloyDB cluster using the AlloyDB Auth Proxy.
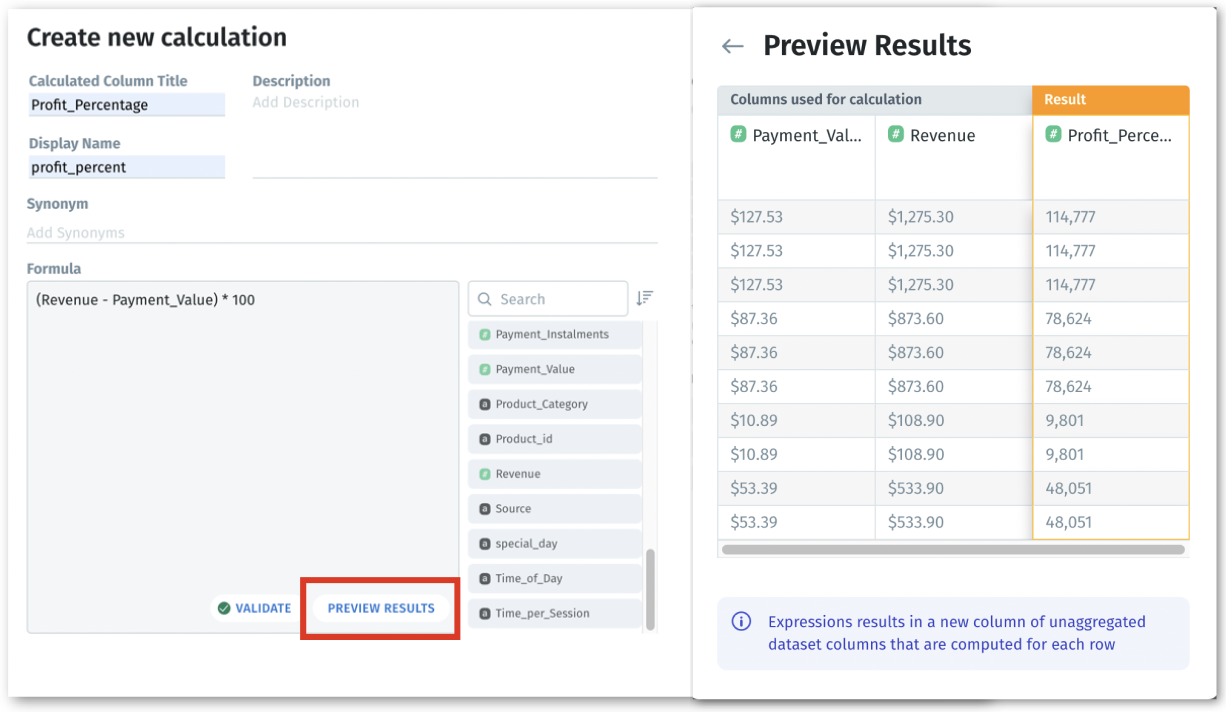
Bulk operation and sample data for calculated columns
To streamline the data management process, we have added the ability to add or delete calculated columns in bulk. While creating a new calculated column, after validating the formula, users can also preview the results for a limited set of data.
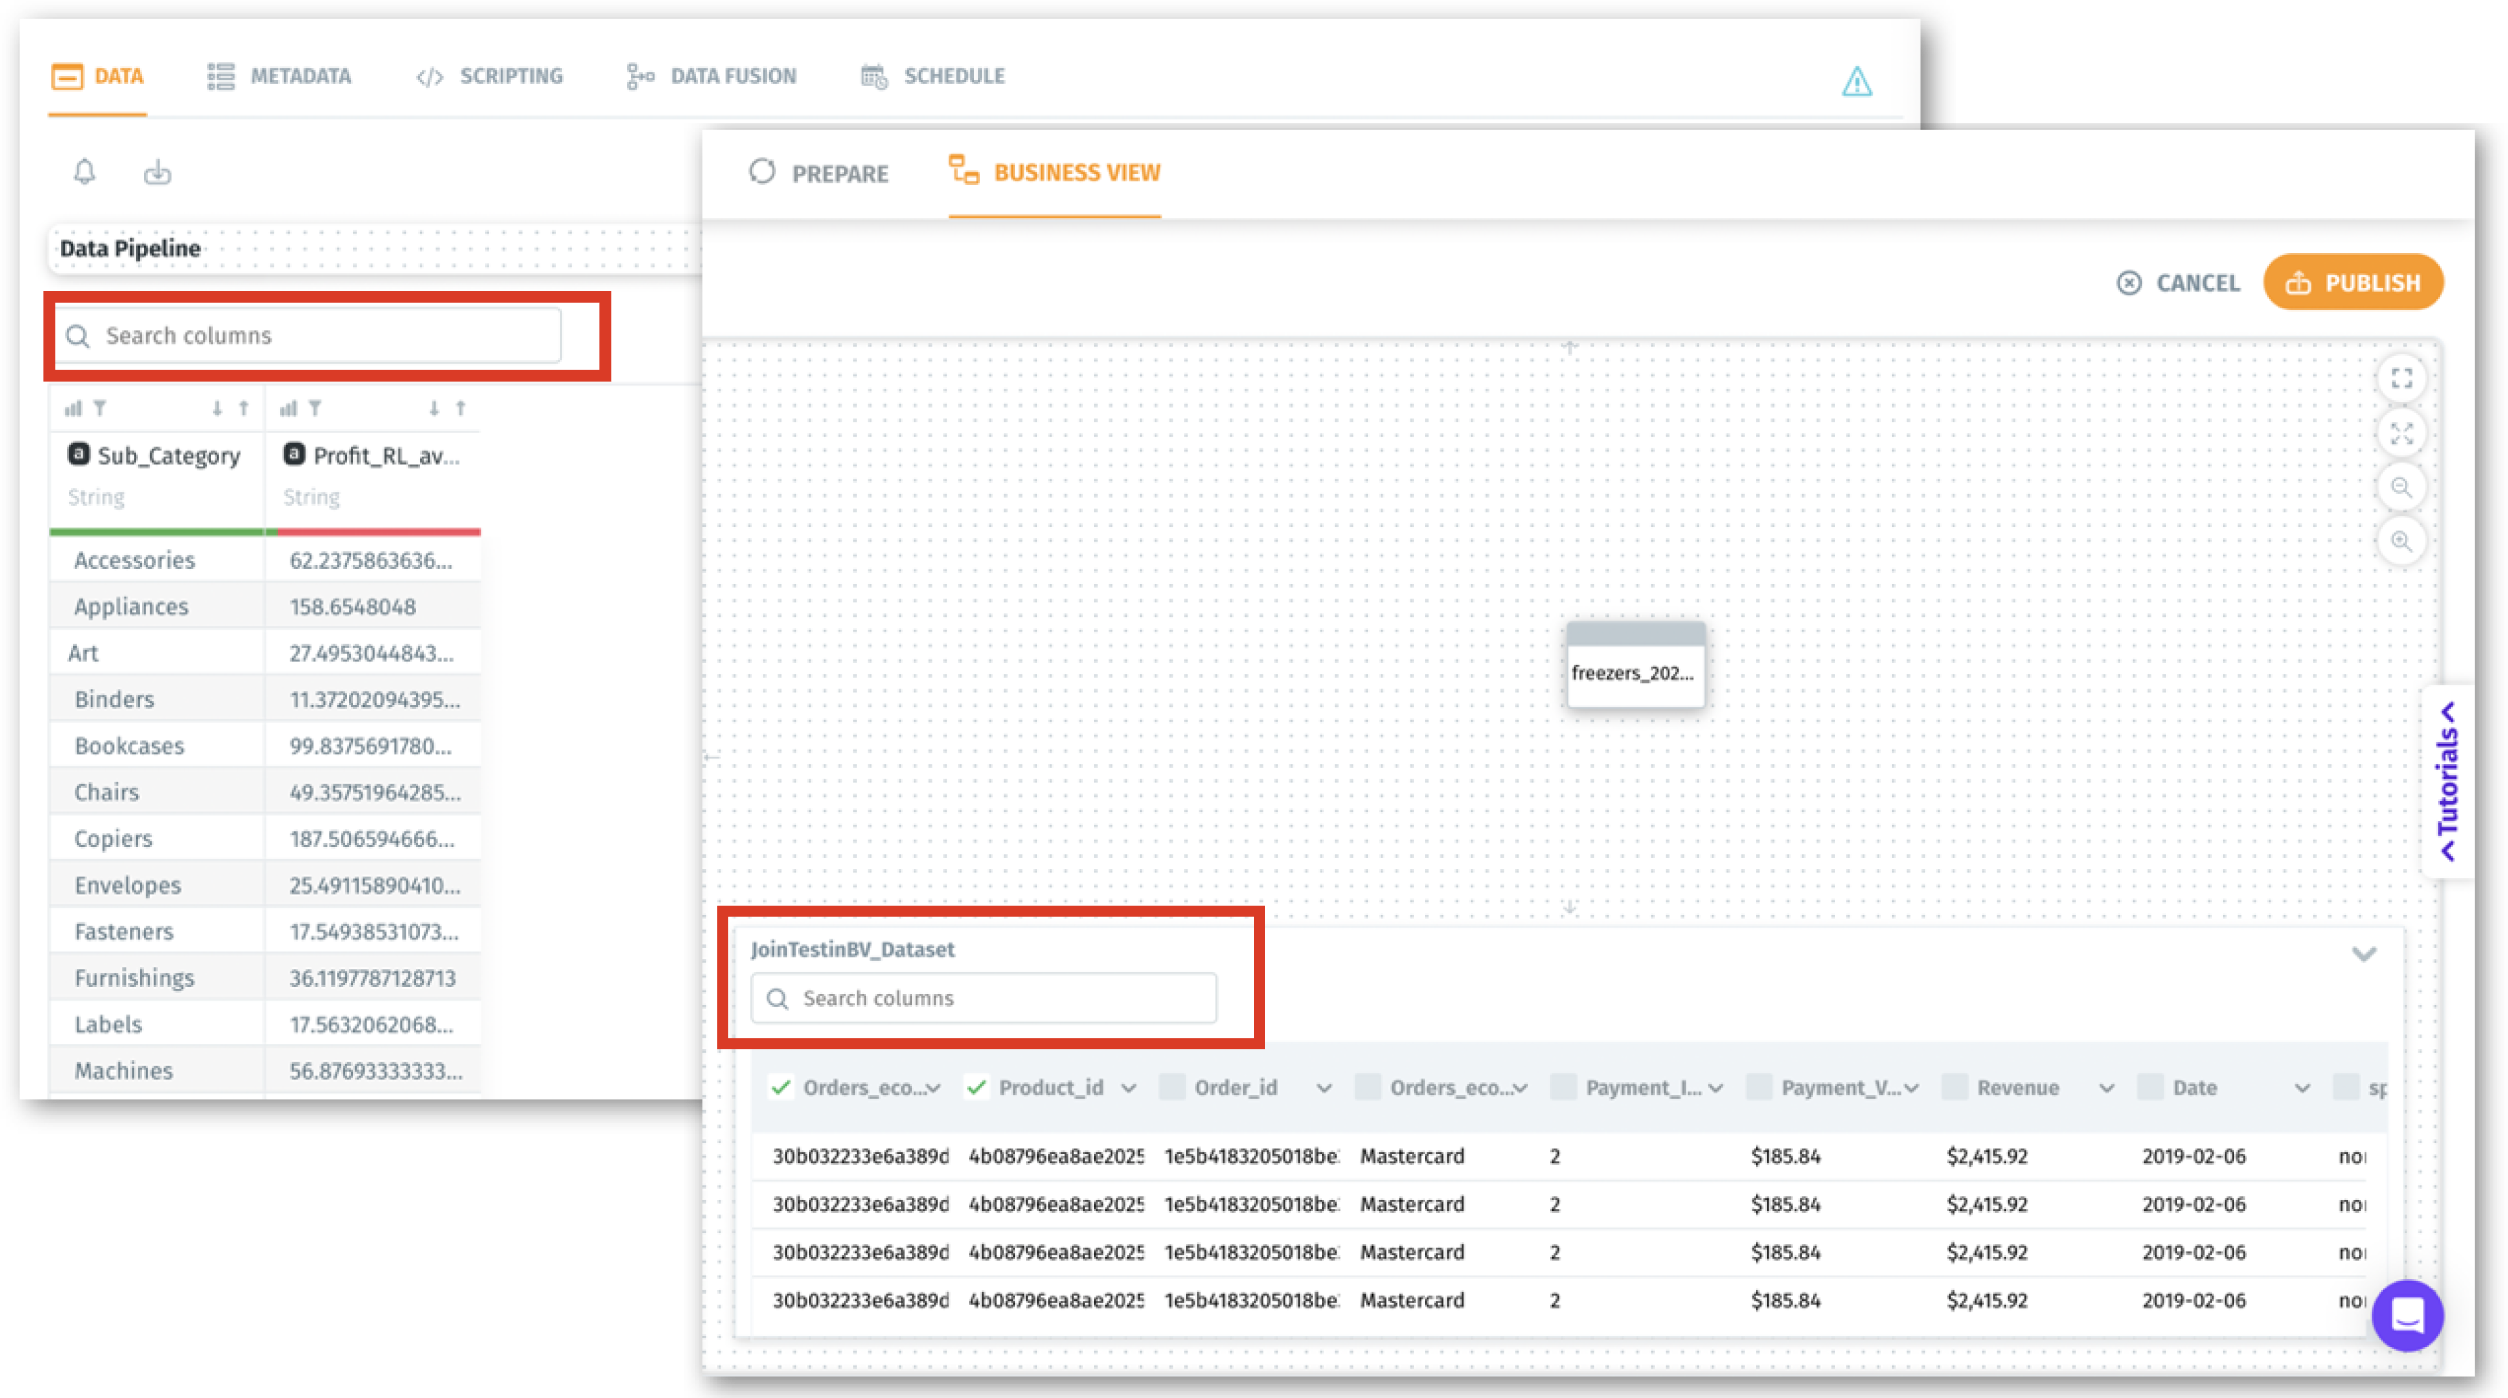
Integrated search functionality
We've introduced a search bar for columns in the Prepare tab and Business View tab (Edit mode) of the Data section. This feature will make navigating and finding the required columns significantly easier.
Axis selection for measures
Users now have the option to choose the Y1 or Y2 axis for the measures in bar and line charts. After enabling Dual Axis for the chart, users can switch between Y1 and Y2 for the selected measures. This capability allows for greater flexibility and customization when representing their data.
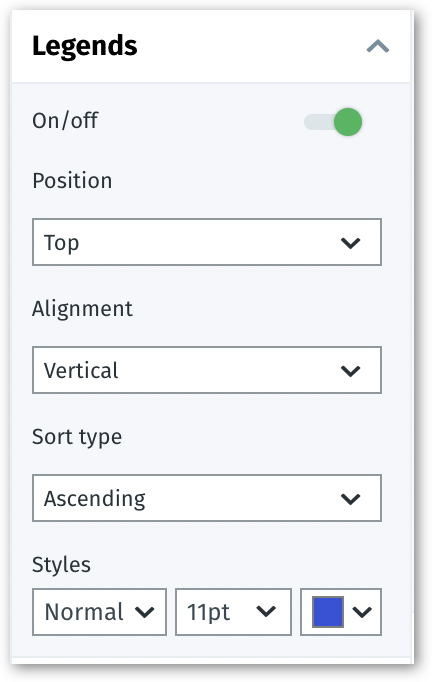
Custom legend positioning and sorting
Users can now customize the position of the legends in their charts. Additionally, users can also sort these legends according to their preference.
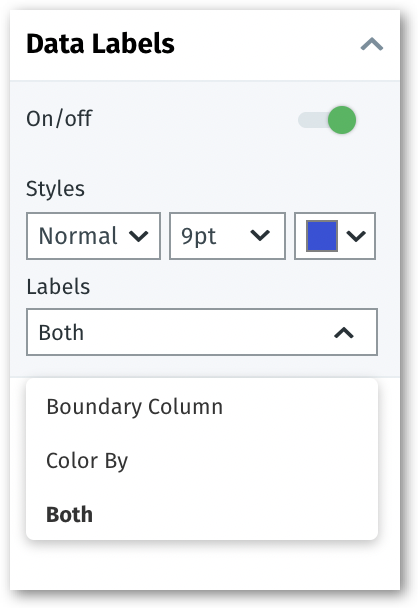
Customizable data labels for boundary maps
To provide better clarity, we've included customization of data labels for the boundary map, enabling you to quickly and easily identify specific regions on the map.
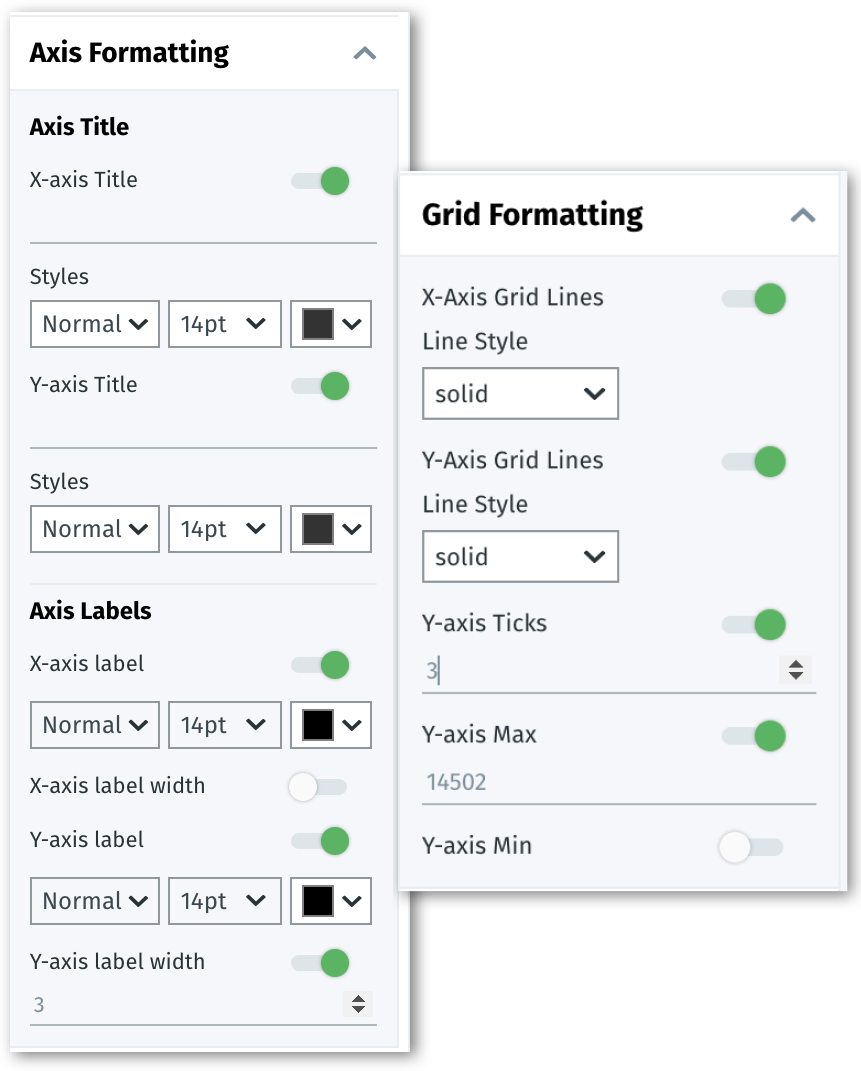
📈 Enhancements
- Axis formatting and grid formatting have been incorporated into bar conversion charts. Additionally, grid formatting has been extended to histogram and confidence range charts.
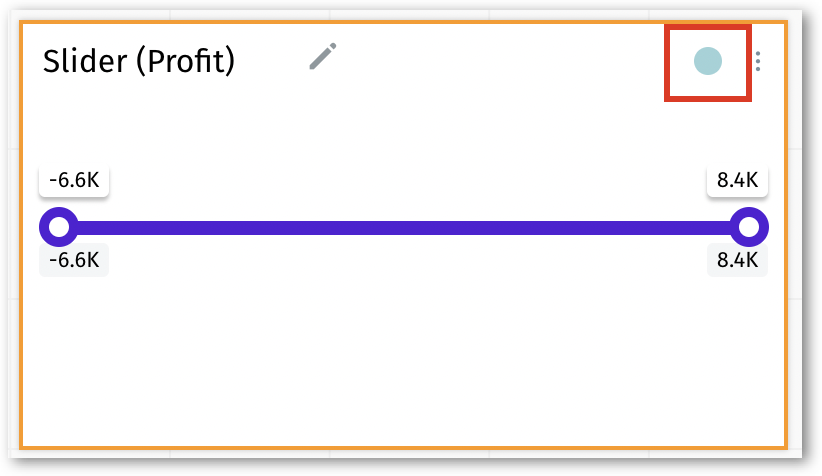
- The values displayed in the slider range control filters now inherit the formatting applied on the underlying Business View. For example, in the screenshot below, it inherits the suffix "K" for the numeric values. Also, the Business View names in the form of colored circles will be displayed in the top right corner.
- When you're dealing with more than 1000 filter values in a control filter, the total count will now be displayed as '999+' instead of the exact count.
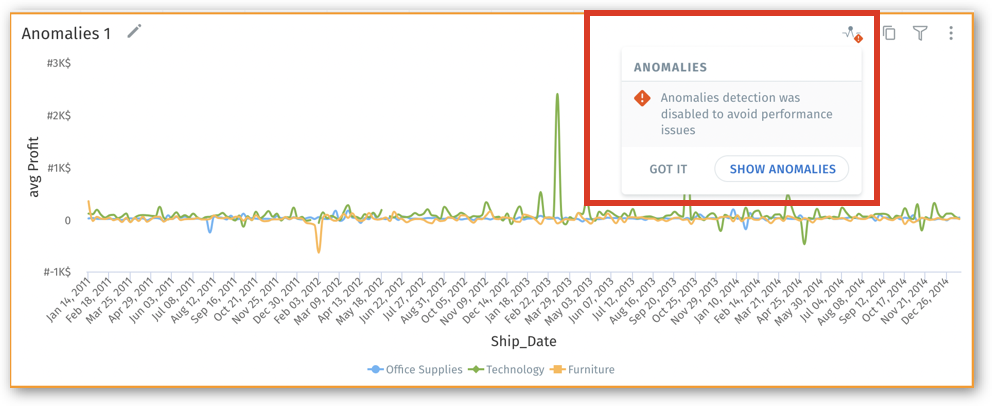
- Improved the visibility and positioning of the anomaly warning message in Search and Vizpads.
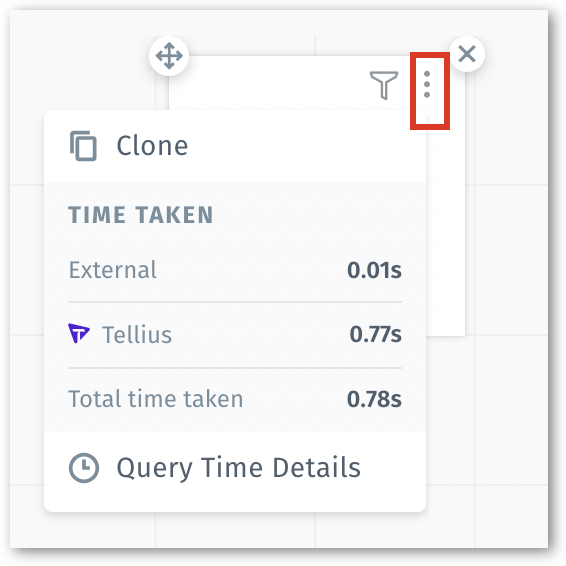
- In Vizpads, the alignment of viz icons in charts with 2x2 dimensions has been improved. The options can be found in the three-dot kebab menu as follows.
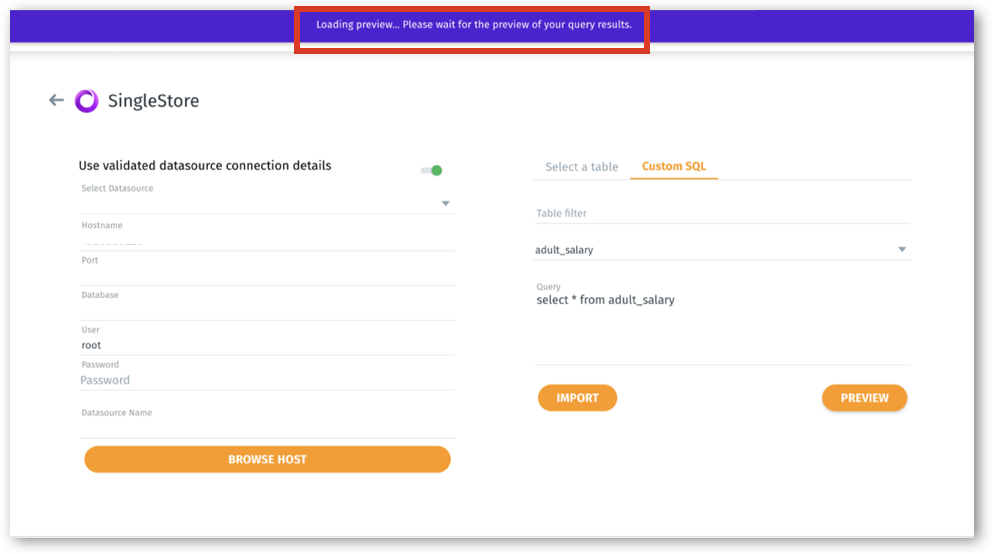
- A notification message will be displayed when users click on "Preview" for custom SQL queries.
- In multi-Business View Vizpads, users can now add charts upto 30 different Business Views.
- Users can now include five or more measures in a line chart.
- To ensure seamless navigation through long lists, we've introduced "virtual scrolling." With this, only the items that are visible in the viewport will be loaded and rendered. As you scroll, new items come into view and are loaded dynamically, improving the performance and responsiveness of the platform.
- The unused objects in memory have been identified and removed to achieve a substantial reduction in heap memory usage. This helps the platform to perform better with quicker load times, smoother navigation, and an overall more responsive user experience.
- Multiple control filters can be added for a single column in a Vizpad for more flexibility. However, please note that multi-select control filters can be paired with dropdown lists but not be paired with single-select control filters. The same holds true vice versa.
🛠️ Minor fixes
- The grid layout in the Search Guide section will consistently maintain a 3x3 format, regardless of screen size changes.
- The Configuration panel will be displayed by default when a new chart is added to a Vizpad, regardless of the previously active tab.
- In Tellius Copilot, the issue with validating SQL/Python code has been fixed. Additionally, the auto-generated queries have been improved.
- During key driver insight creation, the issue with displaying column names when switching between measures and dimensions has been resolved.
- Any new Feed creation with a changed "Include attachment" setting, previously set by another user, will be considered a new Feed.
- In Vizpads, improved the handling of min and max states of slider range control filters.
- The Create Dataflow option has been removed from the users permissions/roles table.
- The issue with updating the title of a control filter after switching its type has been resolved.
- In Vizpads, the issue with displaying consistent time taken to load charts when switching between multiple pages has been resolved.
- Subscribers will no longer see the “Delete” option for Feeds that are not created by them.
- The pop-up message that’s displayed when sharing a Project in “Edit” and “View” mode has been updated.
- The issue with displaying the benchmark line in Vizpad charts when the value is out of the Y-axis range has been fixed.
- Resolved the issue of incorrect duplication warnings in display names after dataset replacement.
- Fixed the issue where formatting applied to one chart was replicated on other charts in a Vizpad.
- Resolved an issue where the boundary map chart for states used incorrect color for max value.
- Improved the tooltip positioning over global filter pills in the Edit mode of Vizpads.
- Eliminated an issue that caused infinite scrolling on tooltips for tables with dimension columns containing large values.
- Resolved the issue where the description tooltips obstructed the fields in the Configuration panel in Vizpads.
- The screen that displays Insights results now supports longer column names with ellipsis and tooltips for easier reading.
- Removed incorrect anomaly warnings when dimension columns are used as x-axes in line charts.
- Fixed the positioning of the text cursor while typing in a text viz in Vizpads.
- The issue with creating ML models from Vizpad has been resolved.
- Resolved the tooltip issues on multiple Insights UI screens.
- Resolved the issue that caused the KPI target chart to lose target values after being exported to PDF/PNG/JPG.
- Special characters are now accepted in the display names of calculated columns.
- In Vizpads, the overlapping issue in the conditional formatting pop-up has been rectified.
- The issue with limited space in the “What” section of an Insight description has been resolved.
- In the results description of Insights, the issue with showing display names has been resolved.
- The issue with displaying Search Guide categories in Edit mode has been fixed.
- Removed the blank alert that appeared for a newly created dataset on the Prepare page.