What's New
Changelog - 5.0.1
Release 5.0
Changelog - 4.3.4
Changelog - 4.3.3
Changelog - 4.3.2
Changelog - 4.3.1
Release 4.3 (Fall 2023)
Changelog - 4.2.7
Changelog - 4.2.6
Changelog - 4.2.5
Changelog - 4.2.4
Changelog - 4.2.3
Changelog - 4.2.2
Changelog - 4.2.1
Release 4.2
Changelog - 4.1.5
Changelog - 4.1.4
Changelog - 4.1.3
Changelog - 4.1.2
Changelog - 4.1.1
Release 4.1
Release 4.0
Release 3.9
Release 3.8
Release 3.7
Release 3.6
Release 3.5
Release 3.4
Release 3.3
Release 3.2
Release 3.1
Release 3.0
Release 2.4.1
Release 2.4
Free Cloud Trial
Release 1.8
Release 2.3
Release 2.2
Release 2.1
Release 2.0
Release 1.7
Release 1.6
Release 1.5
Getting Started
Quick Guide
Best Practices Guide
Search - Best Practices
Vizpads (Explore) - Best Practices
Insights (Discover) - Best Practices
Predict - Best Practices
Data - Best Practices
Glossary
Tellius 101
Navigating around Tellius
System requirements
Tellius Architecture
Installation steps for Tellius
Guided tours for quick onboarding
Customizing Tellius
Tellius Copilot 101
Search (Natural Language)
Search in Tellius
Guide Me
How to Search
Business View List / Columns
Query
Query
Percentage Queries
Time Period Queries
Live Query
Generating Insights-based queries from Search
Search Result
Discover Insights
Interactions
Chart Operations
Add to Vizpad
Table View
Switch Chart type
Change Chart Config
Apply Filters
Change Formatting
Measure Aggregation - Market Share Change
View Raw Data
Download/ Export
Embed URL
Partial Data for Visualization
Best-fit visual
Add to Vizpad
Adding the chart to a Vizpad
Customize the auto-picked columns
Search Query Inspector
Teach Tellius
GPT mode in Search
History
Guided Search
Add Guided Search Experience
Display Names in the Search Guide
Guided Search
Guided Search Syntax and Attributes
Deep Dive
Maps in Search
Search Keywords
Percentage Queries
Time Period Queries
Year-over-Year Analysis
Additional Filters
Pagination
List View In Search Results
Marketshare queries
Embed Search
Personalized Search
Search Cheat Sheet
Filters in Help Tellius Learn
Explore (Vizpads)
Dashboards in Tellius
Vizpad Creation
Create Interactive Content
Create Visualization Charts
List of Charts
Common Chart Types
Line Chart
Bar Chart
Pie Chart
Year-over-Year Functionality in Vizpad
Area Chart
Combo Chart
KPI Target Chart
Treemaps
Bubble Chart
Histogram
Heat-Map Charts
Scatter Chart
Other Charts
Cumulative line chart
Cohort Chart
Explainable AI Charts
For each chart
Create Visualization Charts
Global Filters
Embedded Filters
Other Content
Anomaly management for charts
Creating Interactive Content
Vizpad level Interactions
Viz level Interactions
Discover Insights
Drivers
Discover hidden insights - Genius Insights
How Genius Insights works
Discoveries in Insight
Anomalies on Trend
Interactions
Chart Operations
Switch Chart type
Change Chart Config
Apply Filters
Change Formatting
Add X/Y Axis Target Lines to Scatter Chart
Improvements to Conditional Formatting
Adding Annotations to Tables
Displaying query execution time
AI summaries
Embedding Vizpad
Vizpad Consumption
Collection of Interactive Content
Vizpad level Interactions
Global Filter on the fly
Global Resolutions
Refresh
Notifications / Alerts
Share
Download / Export
Unique name for Vizpads
Edit Column Width
Viz level Interactions
Importing bulk filter values
Multi-Business View Vizpads
Discover (Genius Insights)
Discoveries
What are discoveries
Type of Discoveries in Tellius
Create Discoveries
Kick-off Key Drivers
Edit Insights
Key Driver Insights
Components of Key Drivers
What are Key Drivers
Edit Key Driver Insights
Segment Drivers
Trend Drivers
Trend Insights (Why Insights)
Components of Trend Insights
WHAT: Top Contributors
WHY: Top Reasons
HOW: Top Recommendations
Seamlessly navigating to "Why" from "What"
Create Trend Insight
Edit Trend Insights
What are Trend Insights
Comparison Insights
Components of Comparison Insights
Create Comparison Insight
What are Comparison Insights
Edit Comparison Insights
Others Actions
Save
Refresh
Share Insights
Download
Adding Insights to Vizpad
Insights Enhancements
Embedding Insight
Impact Calculation for Top Contributors
Marketshare
Live Insights
Predict (Machine Learning)
Machine Learning
AutoML
How to create AutoML models
Leaderboard
Prediction
Others
What is AutoML
Point-n-Click Predict
Feed (Track Metrics)
Assistant (Conversations)
Tellius on Mobile devices
Data (Connect, Transform, Model)
Connectors
Connector Setup
Google BigQuery
Google Cloud SQL
Connecting to a PostgreSQL Cloud SQL Instance
Connecting to an MSSQL Cloud SQL Instance
Connecting to a MySQL Cloud SQL Instance
Snowflake
PrivateLink
Snowflake Best Practices
OAuth support for Snowflake
Integrating Snowflake with Azure AD via OAuth
Integrating Snowflake with Okta via OAuth
Edit Connector
Live Connect
Data Import
Cache
Direct Business View
JDBC connector for PrestoDB
Amazon S3
Looker SQL Interface
Databricks
Connecting to an AlloyDB Cluster
List of Connectors by Type
Tables Connections
Custom SQL
Schedule Connector Refresh
Share Connections
Datasets
Load Datasets
Configure Datasets (Measure/Dimensions)
Transform Datasets
Create Business View
Share Datasets
Copy Datasets
Delete Datasets
Swapping datasources
Metadata migration
Data Prep
Datasets
Data Profiling / Statistics
Transformations
Dataset Transform
Aggregate Transforms
Calculated Columns
SQL Transform
Python Transform
Create Hierarchies
Filter Data
SQL Code Snippets
Multiple Datasets Scripting SQL
Column Transforms
Column Metadata
Column type
Feature type
Aggregation
Data type
Special Types
Synonym
Rename Column
Filter Column
Delete Column
Variable Display Names
Other Functions
Metadata View
Dataset Information
Dataset Preview
Alter Pipeline Stage
Edit / Publish Datasets
Data Pipeline (Visual)
Alerts
Partitioning for JDBC Datasets
Export Dataset
Write-back capabilities
Data Fusion
Schedule Refresh
Business Views
Create Business View
Create Business View
Datasets Preview & List
Add datasets to Model
Joins
Column selection
Column configuration
Primary Date
Geo-tagging state/country/city
Save to Fast Query Engine
Publish
Business View
What is Data Model
BV Visual Representation (Preview)
BV Data Sample
Learnings (from Teach Me)
Custom Calculations (Report-level Calc)
Predictions on BV
BV Refresh
Export/ Download Business View
Share Business View
URL in Business View
Request Edit Access
Projects (Organize Content)
Monitor Tellius
Embedding Tellius
Embedding
Settings
About Tellius
User Profile
Admin Settings
Manage Users
Team (Users)
Details & Role
Create a new user
Edit user details
Assigning the user data to another user
Restricting the dataset for a user
Deleting a user
Assign User Objects
Teammates (Groups)
Authentication & Authorization
Application & Advanced Settings
Data
Machine Learning
Genius Insights
Usage tracking & Support
CDN
Download Business View, Dataset, and Insights for Live BV
Customize Help
Impersonate
Data Size Estimation and Calculation
Miscellaneous Application Settings
Configuration for time/date-related results
Dataflow Access
Enable In-memory operations on Live sources
Language Support
Administration
Setup & Configuration
Installation Guide
AWS Marketplace
Autoscaling
Backup and Restore
Help & Support
FAQ
Data Preparation FAQs
Environment FAQs
Search FAQs
Vizpads FAQs
Data Caching
Security FAQs
Embedding FAQs
Insights FAQs
Tellius Product Roadmap
Help and Support System
Guided Tours
Product Videos
Articles & Docs
Provide Feedback
Connect with Tellius team
Support Process
Notifications
Getting Started Videos
Getting Started
Tellius Connect
Tellius Data Overview Video
Connecting to Flat Files Video
Connecting to Data Sources Video
Live Connections Video
Data Refresh and Scheduling Video
Tellius Prep
Getting Started with Tellius Prep Video
Transformations, Indicators, Signatures, Aggregations and Filters Video
SQL and Python Video
Working with Dates Video
Data Fusion Video
Business View Video
Business Mapping Video
Report Level Calculations Video
Writeback to DB
Natural Language Search
Getting Started with Search Video
How-To Search Video
Customizing Search Results Video
Search Interactions Video
Help Tellius Learn
Explore - Vizpads
Getting Started with Vizpads Video
Creating Vizpads Video
Creating and Configuring Visualizations Video
Viz-Level Interactions Video
Vizpad-Level Interactions Video
Auto Insights
Getting Started with Auto Insights Video
Discovery Insights Video
Segment Insights Video
Trend Insights Video
Comparison Insights Video
Iterate on Insights Video
Tellius Feed Video
Predict - ML Modeling
Getting Started with Predict Video
AutoML Configuration Video
AutoML Leaderboard Video
Point-n-Click Regression Video
Point-n-Click Classification Video
Point-n-Click Clustering Video
Point-n-Click Time Series Video
Point-n-Click PythonML Video
PredictAPI Video
Apply ML Model Video
ML Refresh and Schedule Video
Admin
Best Practices & FAQs
API Documentation
Vizpad APIs
User & user groups APIs
Machine Learning APIs
Fall 2023 (4.3)
Table of Contents
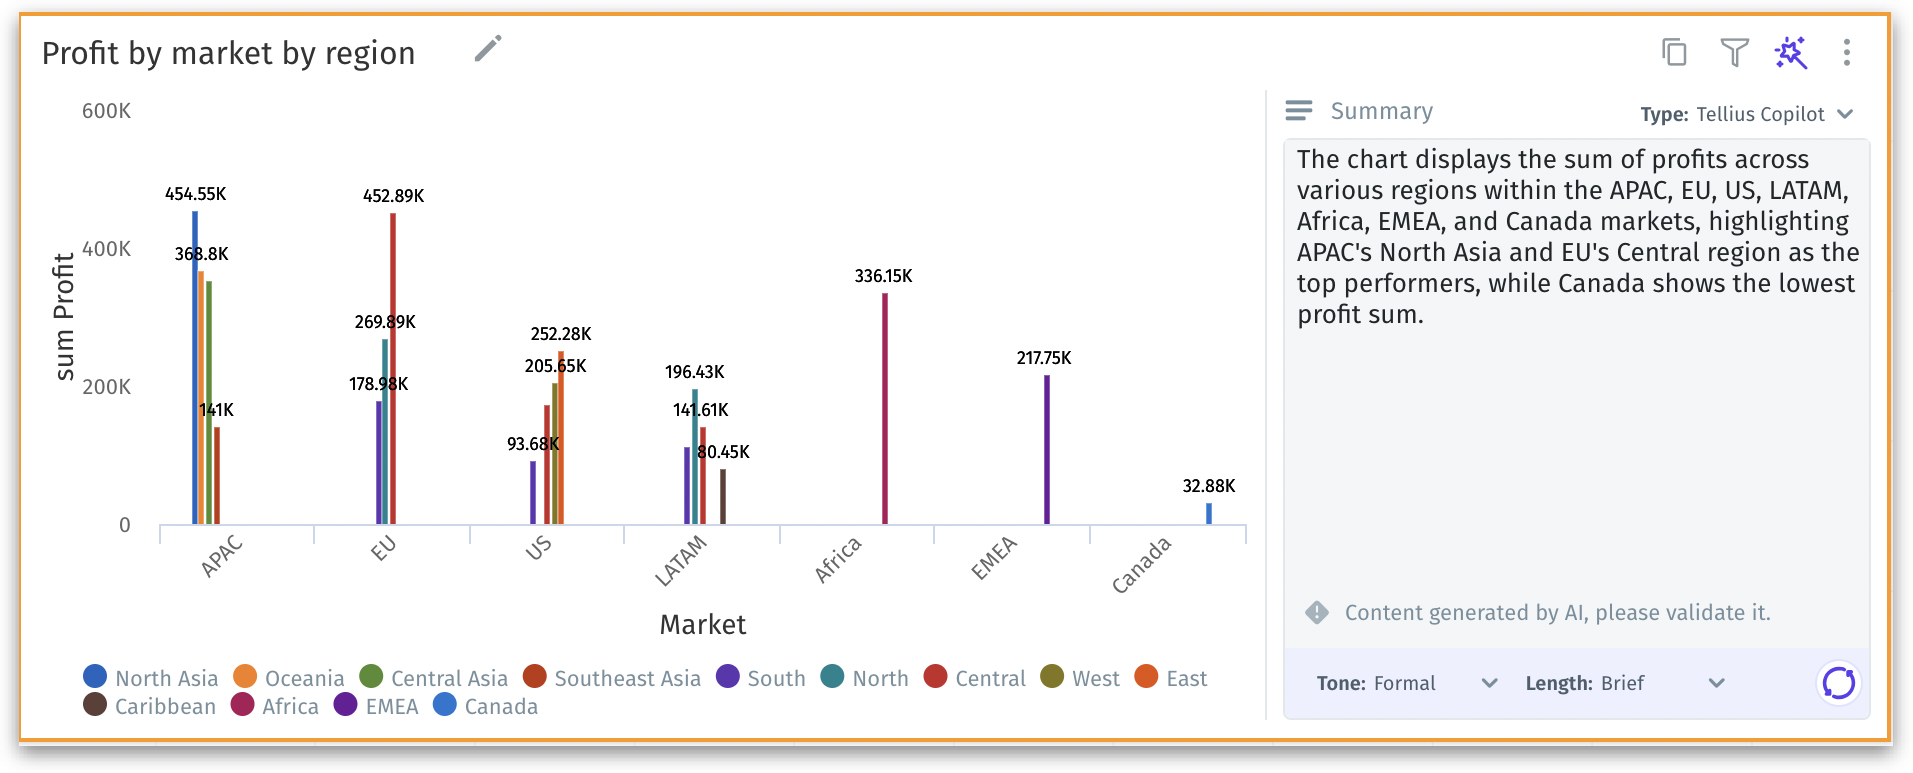
AI summaries

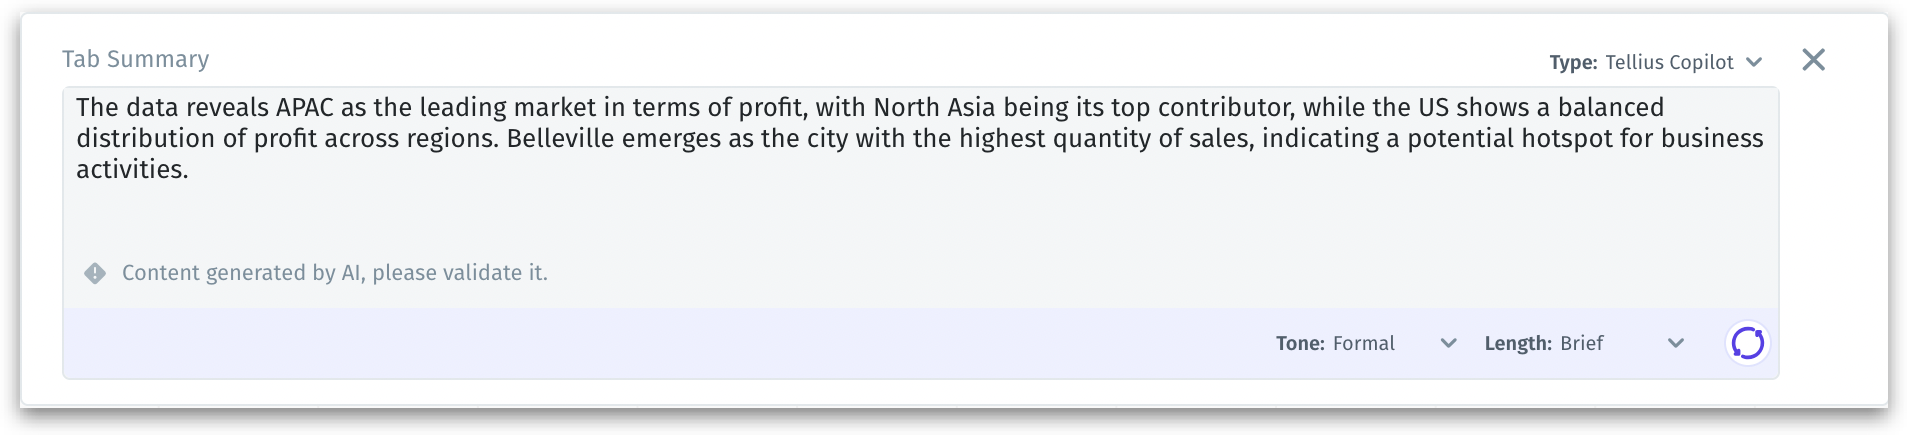
Tellius Copilot's AI-generated summaries provide an immediate snapshot of critical data points and highlight important trends and outliers present in the associated chart. Copilot creates tailored, digestible summaries that simplify the comprehension of charts and tabs.
Chart summary
- After creating the required chart in a Vizpad, you can find the purple colored wand on the top right corner of the chart.
- Click on "Add AI summary". Tellius Copilot will analyze the chart and generate digestible summary explaining the chart.
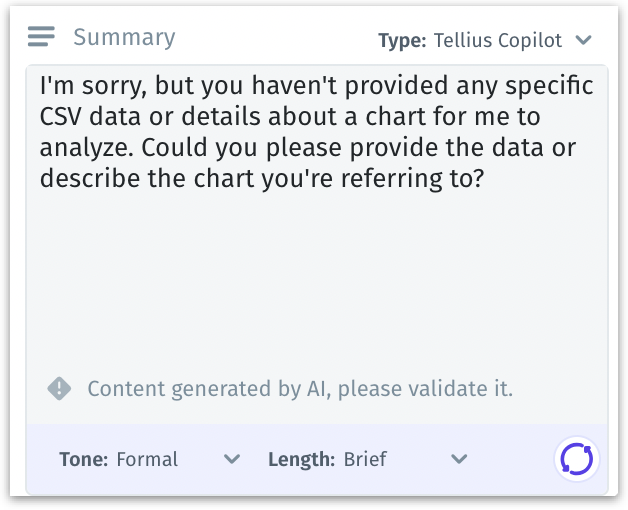
- If you haven't provided enough details for the chart, the following content will be displayed.
- By default, the tone and length of the chart will be set to "Formal" and "Brief".
- Click on the Tone dropdown to change the tone of the summary.
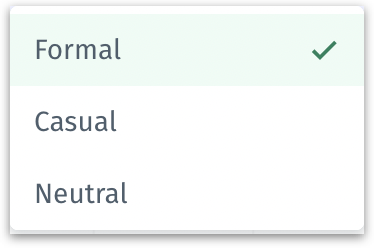
- Formal - Denotes a professional and structured approach
- Casual - Implies a relaxed and conversational style
- Neutral - Represents a balanced tone
- Click on the Brief dropdown to change the length of the summary.
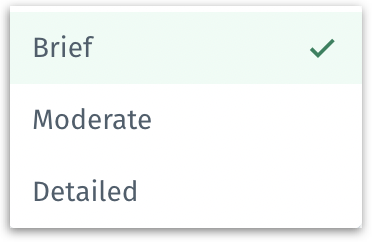
- Brief - Provides a concise overview, focusing on the key points for a quick understanding
- Moderate - Offers a balanced summary, including essential details for a comprehensive insight.
- Detailed - Delivers an in-depth analysis, covering all aspects for thorough comprehension
- Click on the Regenarate summary icon next to the Length dropdown to regenerate a different version of the summary.
- Click on the Hide AI summary to hide the generated summary. Once hidden, the previous summary cannot be retrieved and has to be generated anew.
- Click on the generated summary to edit it as required.
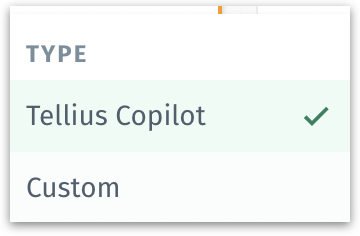
- By default, the Type is set to Tellius Copilot. If you want to provide your own summary/annotations to the chart, change the Type to Custom.
- Click on the three-dot kebab menu on every chart, and the following menu will be displayed.
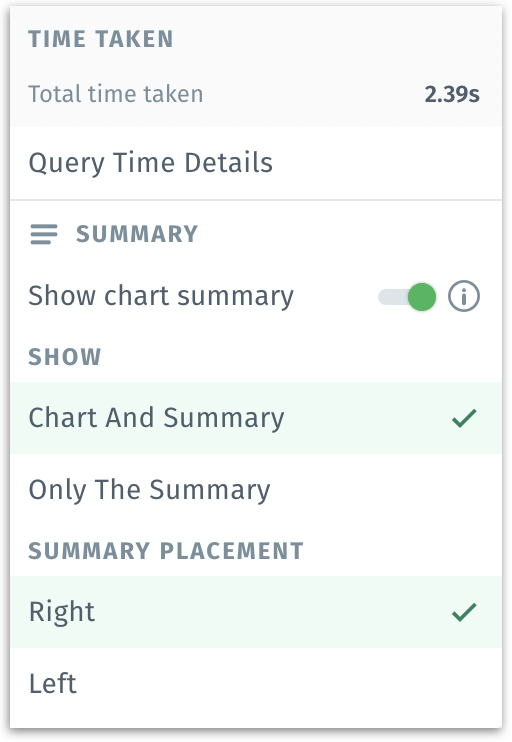
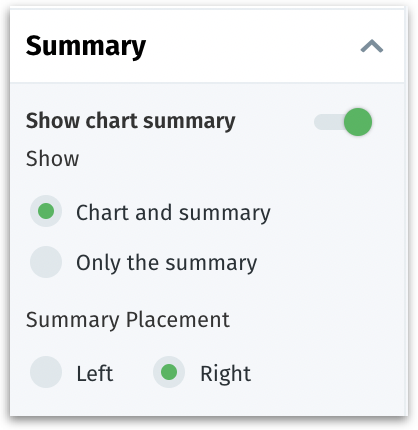
- Show chart summary: This toggle controls the visibility of the summary in your report.
- Chart And Summary: Choose this option to display both the chart and its accompanying summary.
- Only The Summary: Choose this option if you prefer to view just the summary without the chart.
- Summary Placement: Determine where the summary should be displayed.
- Right: Click here if you prefer the summary to be displayed on the right side of the chart.
- Left: Click here if you prefer the summary to be displayed on the left side of the chart.
- The above options can also be found under Formatting --> Summary.
Tab summary
In a similar way, summaries for the entire tab can also be generated. All the options available for chart summaries are also applicable to tab summaries.
- Click on Show tab summary in the top left corner of a Vizpad and the Copilot will generate a summary that gives an overview of all the charts present in the tab.
- The tone and length of the summary can be changed as required. The tab summary can also be regenerated as required.
- Copilot-generated summary can be edited. Also, the type of summary can be changed to Custom to include user-generated summaries.
- Click on the Close (X) button to remove the tab summary.