What's New
Changelog - 5.0.1
Release 5.0
Changelog - 4.3.4
Changelog - 4.3.3
Changelog - 4.3.2
Changelog - 4.3.1
Release 4.3 (Fall 2023)
Changelog - 4.2.7
Changelog - 4.2.6
Changelog - 4.2.5
Changelog - 4.2.4
Changelog - 4.2.3
Changelog - 4.2.2
Changelog - 4.2.1
Release 4.2
Changelog - 4.1.5
Changelog - 4.1.4
Changelog - 4.1.3
Changelog - 4.1.2
Changelog - 4.1.1
Release 4.1
Release 4.0
Release 3.9
Release 3.8
Release 3.7
Release 3.6
Release 3.5
Release 3.4
Release 3.3
Release 3.2
Release 3.1
Release 3.0
Release 2.4.1
Release 2.4
Free Cloud Trial
Release 1.8
Release 2.3
Release 2.2
Release 2.1
Release 2.0
Release 1.7
Release 1.6
Release 1.5
Getting Started
Quick Guide
Best Practices Guide
Search - Best Practices
Vizpads (Explore) - Best Practices
Insights (Discover) - Best Practices
Predict - Best Practices
Data - Best Practices
Glossary
Tellius 101
Navigating around Tellius
System requirements
Tellius Architecture
Installation steps for Tellius
Guided tours for quick onboarding
Customizing Tellius
Tellius Copilot 101
Search (Natural Language)
Search in Tellius
Guide Me
How to Search
Business View List / Columns
Query
Query
Percentage Queries
Time Period Queries
Live Query
Generating Insights-based queries from Search
Search Result
Discover Insights
Interactions
Chart Operations
Add to Vizpad
Table View
Switch Chart type
Change Chart Config
Apply Filters
Change Formatting
Measure Aggregation - Market Share Change
View Raw Data
Download/ Export
Embed URL
Partial Data for Visualization
Best-fit visual
Add to Vizpad
Adding the chart to a Vizpad
Customize the auto-picked columns
Search Query Inspector
Teach Tellius
GPT mode in Search
History
Guided Search
Add Guided Search Experience
Display Names in the Search Guide
Guided Search
Guided Search Syntax and Attributes
Deep Dive
Maps in Search
Search Keywords
Percentage Queries
Time Period Queries
Year-over-Year Analysis
Additional Filters
Pagination
List View In Search Results
Marketshare queries
Embed Search
Personalized Search
Search Cheat Sheet
Filters in Help Tellius Learn
Explore (Vizpads)
Dashboards in Tellius
Vizpad Creation
Create Interactive Content
Create Visualization Charts
List of Charts
Common Chart Types
Line Chart
Bar Chart
Pie Chart
Year-over-Year Functionality in Vizpad
Area Chart
Combo Chart
KPI Target Chart
Treemaps
Bubble Chart
Histogram
Heat-Map Charts
Scatter Chart
Other Charts
Cumulative line chart
Cohort Chart
Explainable AI Charts
For each chart
Create Visualization Charts
Global Filters
Embedded Filters
Other Content
Anomaly management for charts
Creating Interactive Content
Vizpad level Interactions
Viz level Interactions
Discover Insights
Drivers
Discover hidden insights - Genius Insights
How Genius Insights works
Discoveries in Insight
Anomalies on Trend
Interactions
Chart Operations
Switch Chart type
Change Chart Config
Apply Filters
Change Formatting
Add X/Y Axis Target Lines to Scatter Chart
Improvements to Conditional Formatting
Adding Annotations to Tables
Displaying query execution time
AI summaries
Embedding Vizpad
Vizpad Consumption
Collection of Interactive Content
Vizpad level Interactions
Global Filter on the fly
Global Resolutions
Refresh
Notifications / Alerts
Share
Download / Export
Unique name for Vizpads
Edit Column Width
Viz level Interactions
Importing bulk filter values
Multi-Business View Vizpads
Discover (Genius Insights)
Discoveries
What are discoveries
Type of Discoveries in Tellius
Create Discoveries
Kick-off Key Drivers
Edit Insights
Key Driver Insights
Components of Key Drivers
What are Key Drivers
Edit Key Driver Insights
Segment Drivers
Trend Drivers
Trend Insights (Why Insights)
Components of Trend Insights
WHAT: Top Contributors
WHY: Top Reasons
HOW: Top Recommendations
Seamlessly navigating to "Why" from "What"
Create Trend Insight
Edit Trend Insights
What are Trend Insights
Comparison Insights
Components of Comparison Insights
Create Comparison Insight
What are Comparison Insights
Edit Comparison Insights
Others Actions
Save
Refresh
Share Insights
Download
Adding Insights to Vizpad
Insights Enhancements
Embedding Insight
Impact Calculation for Top Contributors
Marketshare
Live Insights
Predict (Machine Learning)
Machine Learning
AutoML
How to create AutoML models
Leaderboard
Prediction
Others
What is AutoML
Point-n-Click Predict
Feed (Track Metrics)
Assistant (Conversations)
Tellius on Mobile devices
Data (Connect, Transform, Model)
Connectors
Connector Setup
Google BigQuery
Google Cloud SQL
Connecting to a PostgreSQL Cloud SQL Instance
Connecting to an MSSQL Cloud SQL Instance
Connecting to a MySQL Cloud SQL Instance
Snowflake
PrivateLink
Snowflake Best Practices
OAuth support for Snowflake
Integrating Snowflake with Azure AD via OAuth
Integrating Snowflake with Okta via OAuth
Edit Connector
Live Connect
Data Import
Cache
Direct Business View
JDBC connector for PrestoDB
Amazon S3
Looker SQL Interface
Databricks
Connecting to an AlloyDB Cluster
List of Connectors by Type
Tables Connections
Custom SQL
Schedule Connector Refresh
Share Connections
Datasets
Load Datasets
Configure Datasets (Measure/Dimensions)
Transform Datasets
Create Business View
Share Datasets
Copy Datasets
Delete Datasets
Swapping datasources
Metadata migration
Data Prep
Datasets
Data Profiling / Statistics
Transformations
Dataset Transform
Aggregate Transforms
Calculated Columns
SQL Transform
Python Transform
Create Hierarchies
Filter Data
SQL Code Snippets
Multiple Datasets Scripting SQL
Column Transforms
Column Metadata
Column type
Feature type
Aggregation
Data type
Special Types
Synonym
Rename Column
Filter Column
Delete Column
Variable Display Names
Other Functions
Metadata View
Dataset Information
Dataset Preview
Alter Pipeline Stage
Edit / Publish Datasets
Data Pipeline (Visual)
Alerts
Partitioning for JDBC Datasets
Export Dataset
Write-back capabilities
Data Fusion
Schedule Refresh
Business Views
Create Business View
Create Business View
Datasets Preview & List
Add datasets to Model
Joins
Column selection
Column configuration
Primary Date
Geo-tagging state/country/city
Save to Fast Query Engine
Publish
Business View
What is Data Model
BV Visual Representation (Preview)
BV Data Sample
Learnings (from Teach Me)
Custom Calculations (Report-level Calc)
Predictions on BV
BV Refresh
Export/ Download Business View
Share Business View
URL in Business View
Request Edit Access
Projects (Organize Content)
Monitor Tellius
Embedding Tellius
Embedding
Settings
About Tellius
User Profile
Admin Settings
Manage Users
Team (Users)
Details & Role
Create a new user
Edit user details
Assigning the user data to another user
Restricting the dataset for a user
Deleting a user
Assign User Objects
Teammates (Groups)
Authentication & Authorization
Application & Advanced Settings
Data
Machine Learning
Genius Insights
Usage tracking & Support
CDN
Download Business View, Dataset, and Insights for Live BV
Customize Help
Impersonate
Data Size Estimation and Calculation
Miscellaneous Application Settings
Configuration for time/date-related results
Dataflow Access
Enable In-memory operations on Live sources
Language Support
Administration
Setup & Configuration
Installation Guide
AWS Marketplace
Autoscaling
Backup and Restore
Help & Support
FAQ
Data Preparation FAQs
Environment FAQs
Search FAQs
Vizpads FAQs
Data Caching
Security FAQs
Embedding FAQs
Insights FAQs
Tellius Product Roadmap
Help and Support System
Guided Tours
Product Videos
Articles & Docs
Provide Feedback
Connect with Tellius team
Support Process
Notifications
Getting Started Videos
Getting Started
Tellius Connect
Tellius Data Overview Video
Connecting to Flat Files Video
Connecting to Data Sources Video
Live Connections Video
Data Refresh and Scheduling Video
Tellius Prep
Getting Started with Tellius Prep Video
Transformations, Indicators, Signatures, Aggregations and Filters Video
SQL and Python Video
Working with Dates Video
Data Fusion Video
Business View Video
Business Mapping Video
Report Level Calculations Video
Writeback to DB
Natural Language Search
Getting Started with Search Video
How-To Search Video
Customizing Search Results Video
Search Interactions Video
Help Tellius Learn
Explore - Vizpads
Getting Started with Vizpads Video
Creating Vizpads Video
Creating and Configuring Visualizations Video
Viz-Level Interactions Video
Vizpad-Level Interactions Video
Auto Insights
Getting Started with Auto Insights Video
Discovery Insights Video
Segment Insights Video
Trend Insights Video
Comparison Insights Video
Iterate on Insights Video
Tellius Feed Video
Predict - ML Modeling
Getting Started with Predict Video
AutoML Configuration Video
AutoML Leaderboard Video
Point-n-Click Regression Video
Point-n-Click Classification Video
Point-n-Click Clustering Video
Point-n-Click Time Series Video
Point-n-Click PythonML Video
PredictAPI Video
Apply ML Model Video
ML Refresh and Schedule Video
Admin
Best Practices & FAQs
API Documentation
Vizpad APIs
User & user groups APIs
Machine Learning APIs
Fall 2023 (4.3)
- All Categories
- What's New
- Release 3.8
Release 3.8
 Updated
by Hardik Chheda
Updated
by Hardik Chheda
We are thrilled to announce our newest release, 3.8. In this release, we've introduced Live Insights, Support for tablet devices, and many more features across the board. Read more below!
Search
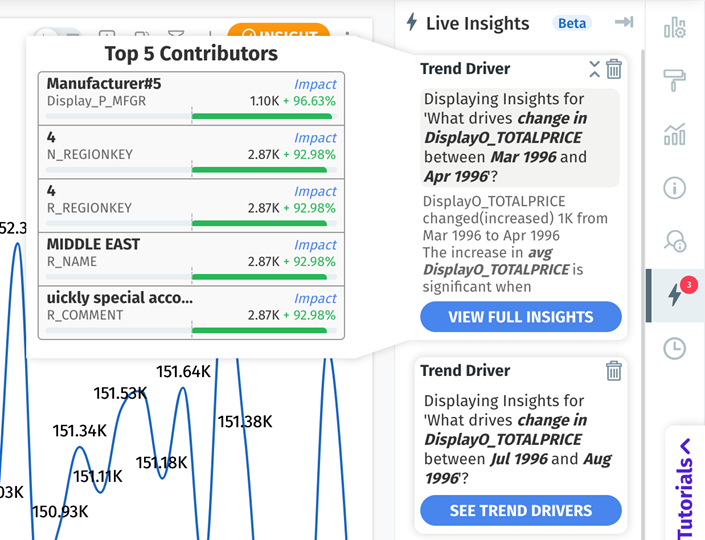
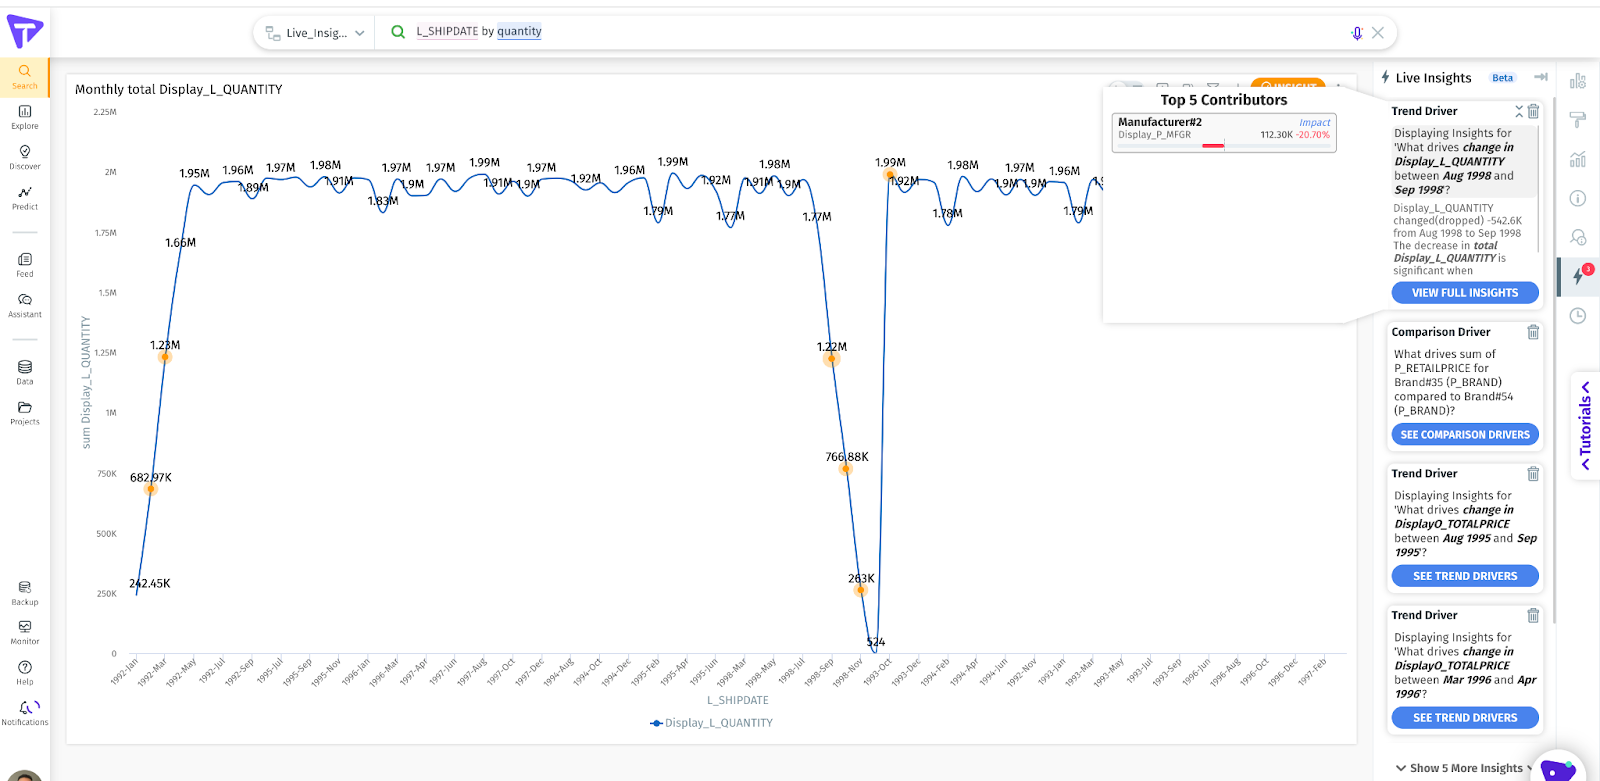
Live Insights
Live Insights automatically analyze millions of data combinations without extracting/moving the data from its source. These insights are available for Trend Insights, Cohort Insights, and Anomalies.
Identify changes in trends: You can diagnose why important metrics and key performance indicators are changing.
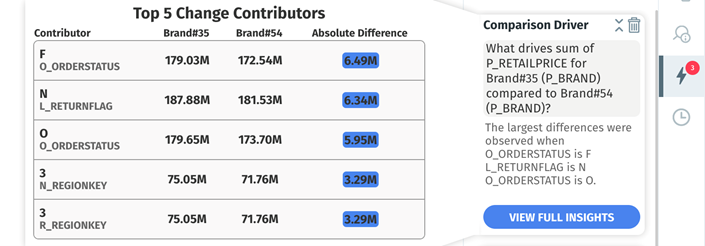
Compare cohorts of data: You can identify the underlying key differences between different groups and cross-sections of data by Cohort Analysis.
Detect Anomalous Changes: Anomaly detection is a process to identify anomalies in time-series data sets that differ from the norm. You can proactively uncover unexpected shifts by having the system continuously monitor data to highlight anomalies and the underlying reasons at a granular level.
Learn more here
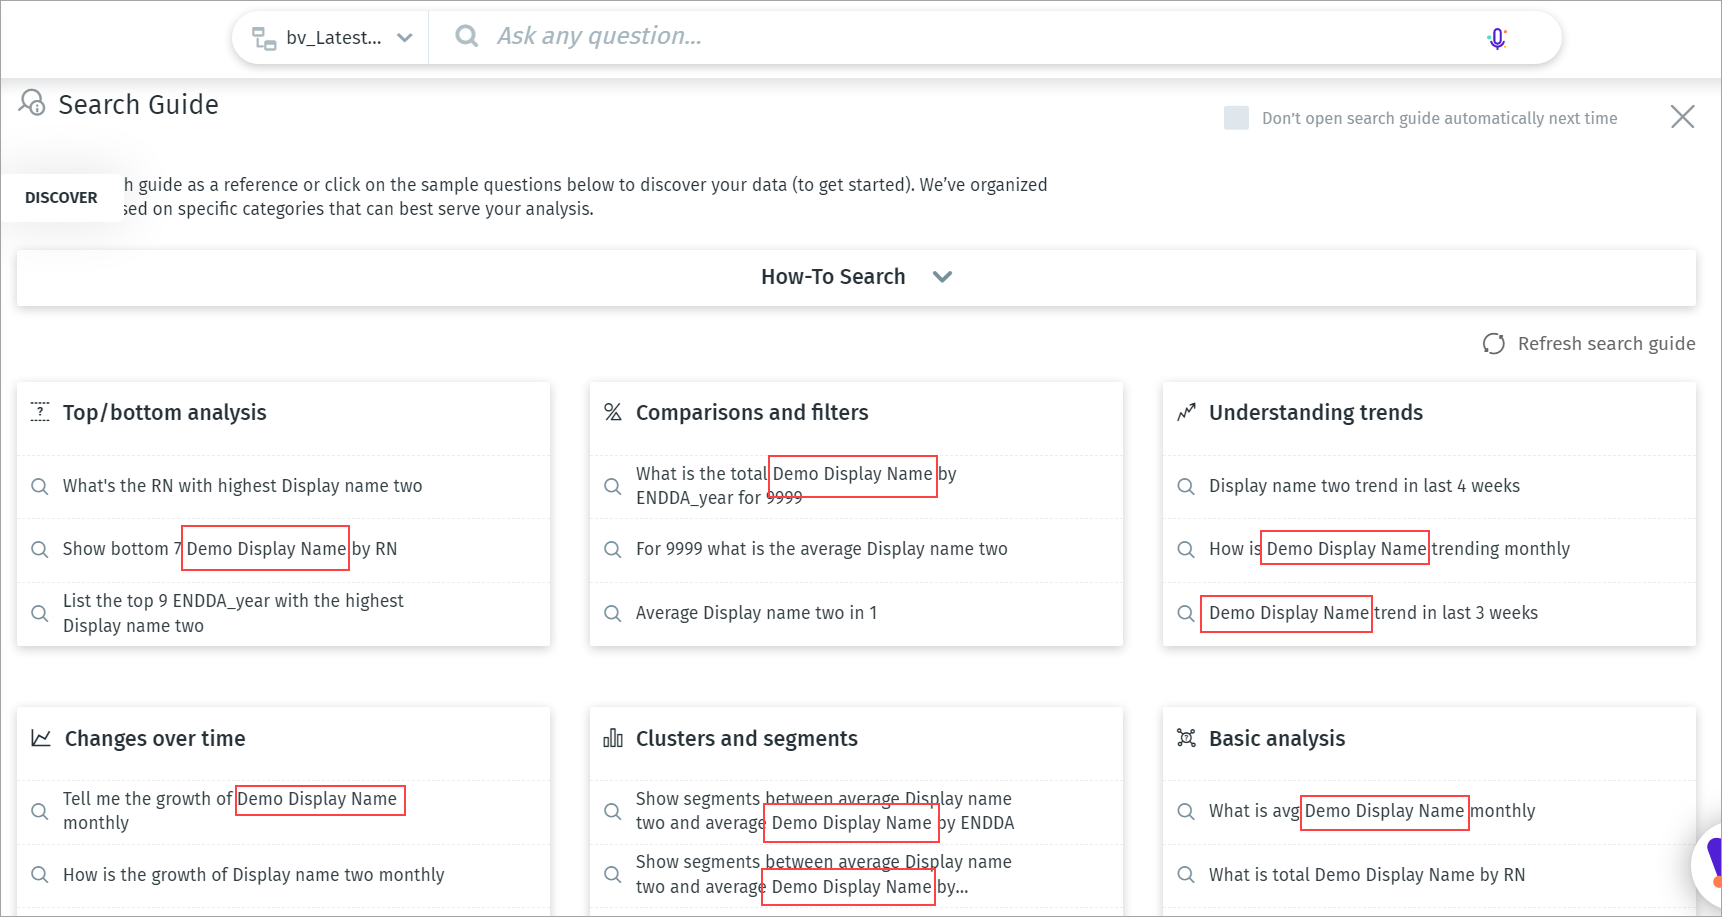
Display Names in Search Guide
Search Guide now uses the display names instead of original column names wherever available.
Learn more here
Vizpad
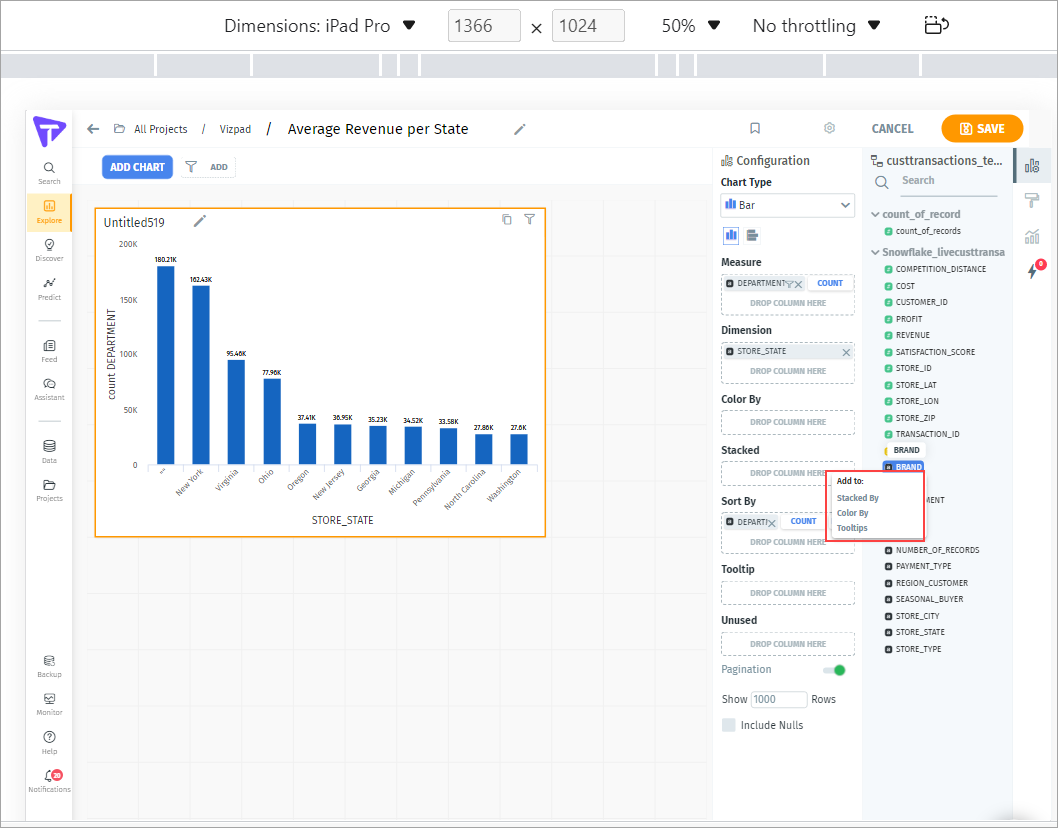
Support for tablet devices
Tellius has introduced touch-enabled menu-based interactions for devices such as iPad and other tablets. The changes will be most visible in Vizpads and Search modules.
Learn more here
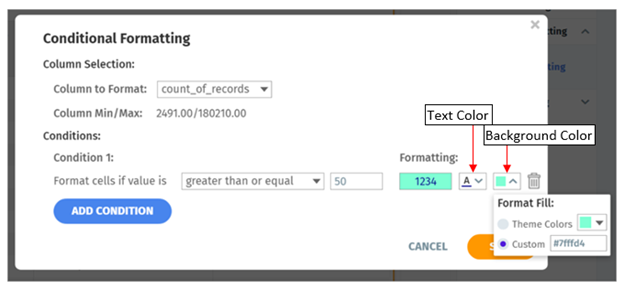
Improvements to Conditional Formatting
Instead of using theme colors, users can specify the hex code (#ffffff) to update the background and text colors in any chart.
Learn more here
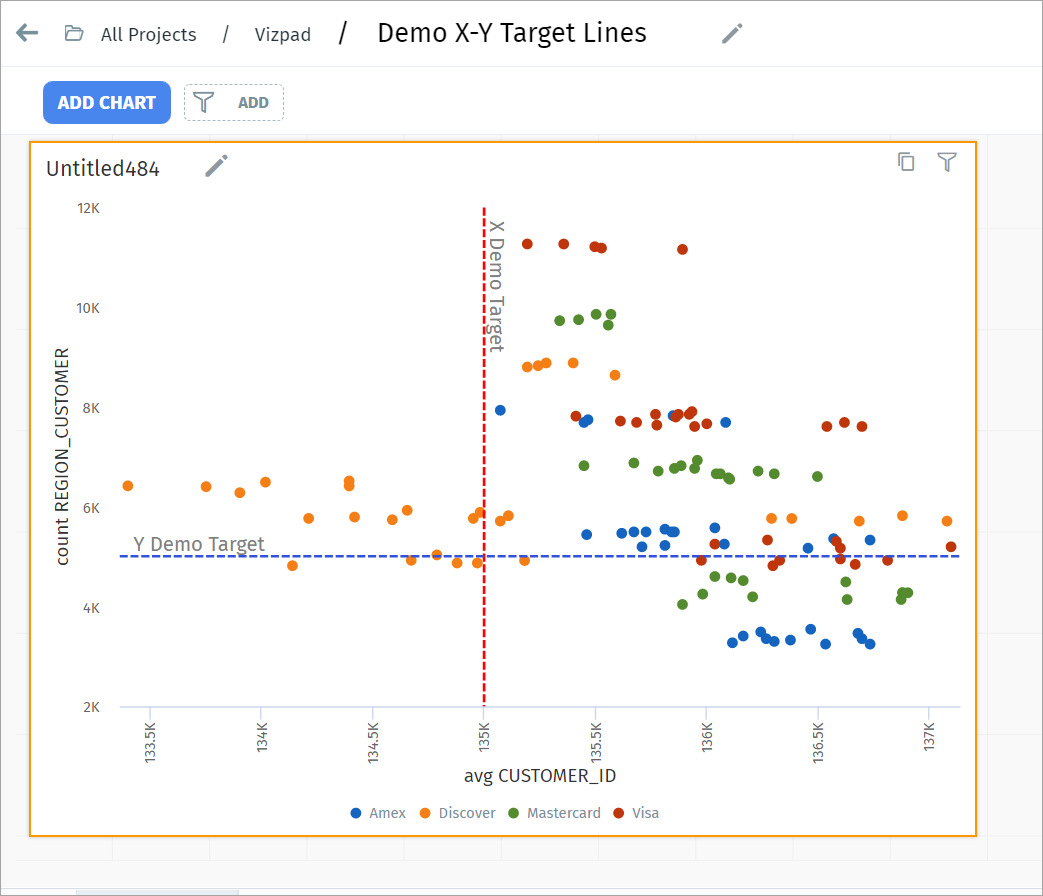
X/Y axis Target Lines
Users can add X and Y target lines for measure columns in the Scatter chart.
Learn more here
Unique name for Vizpads
Users need to provide a unique name to save new Vizpads. Auto-generated default names cannot be used. Learn more here
Improvements to Vizpad Performance
Major improvements were made to Vizpad performance, including lazy loading of charts as well as grouping many other interactions calls.
Data
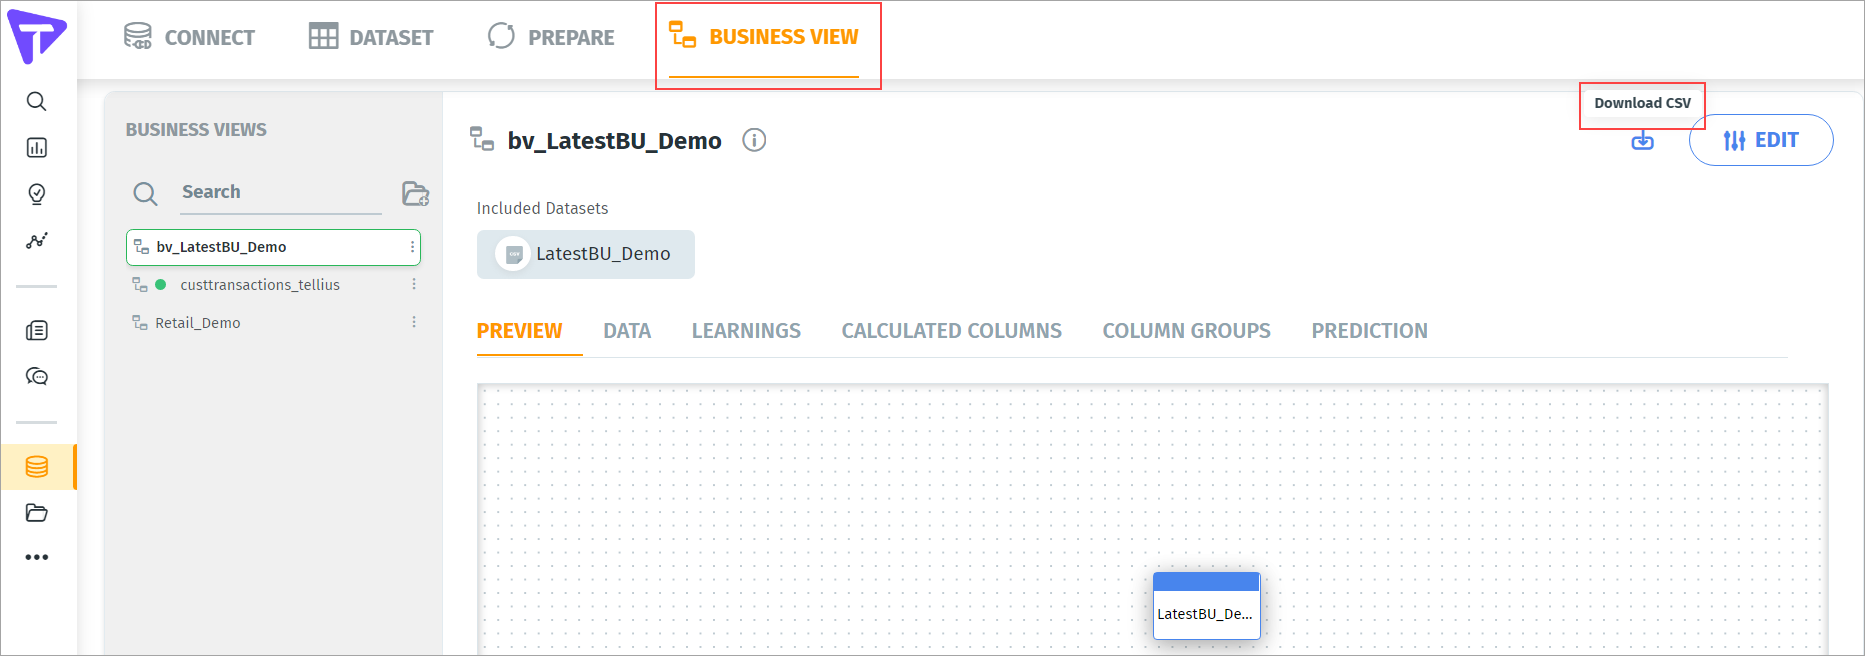
Download Business View, Dataset, and Insights for Live BV
Users can download various objects, such as Datasets, Business Views, and Insights for Business Views with Live connectivity.
Learn more here
Admin
Change Start Day of the Week
Chart results for date resolution queries are based on the time configuration set up for the environment. This date is used to mark the start of a week for time-based calculations.
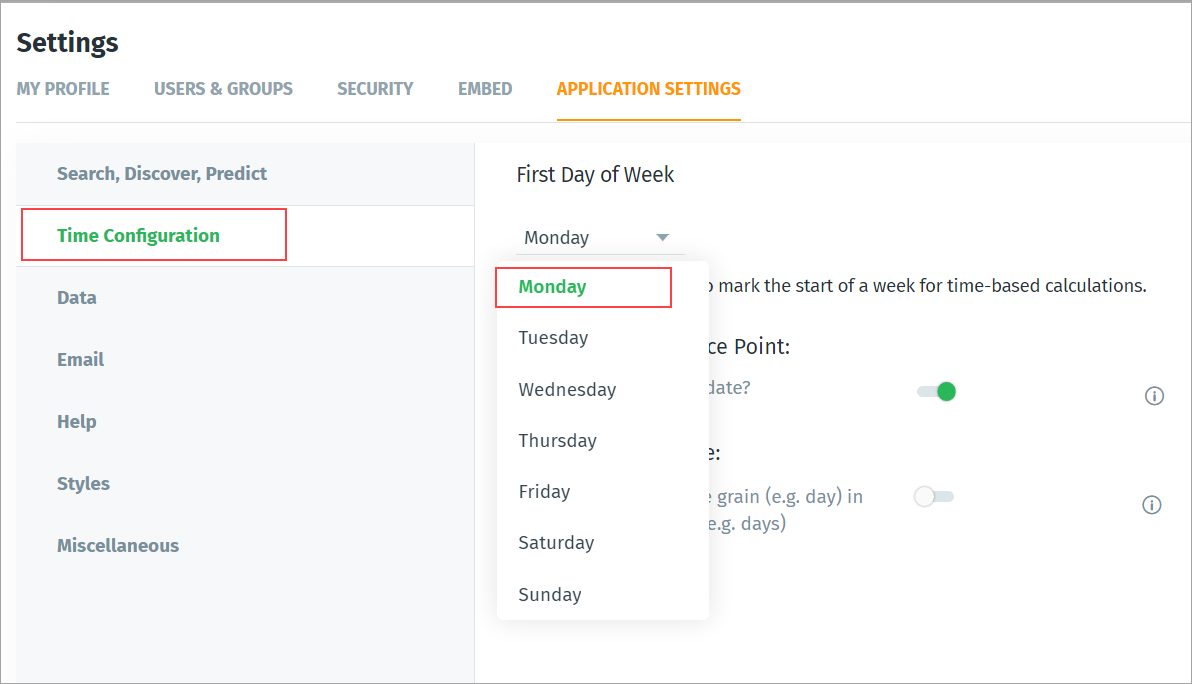
Learn more here
Customize Help
Administrators can customize the Help experience by providing links to custom assets such as internal documentation and videos. These custom links/assets replace Tellius provided help and videos that currently assist the users in understanding the product.

Learn more here
Assign User Objects
Users can re-assign their content to a different user. Transfer of content ownership is critical in cases when a user is being removed from the system. Before transferring ownership and deleting a user, the preview pane lists out all the content owned by the user.
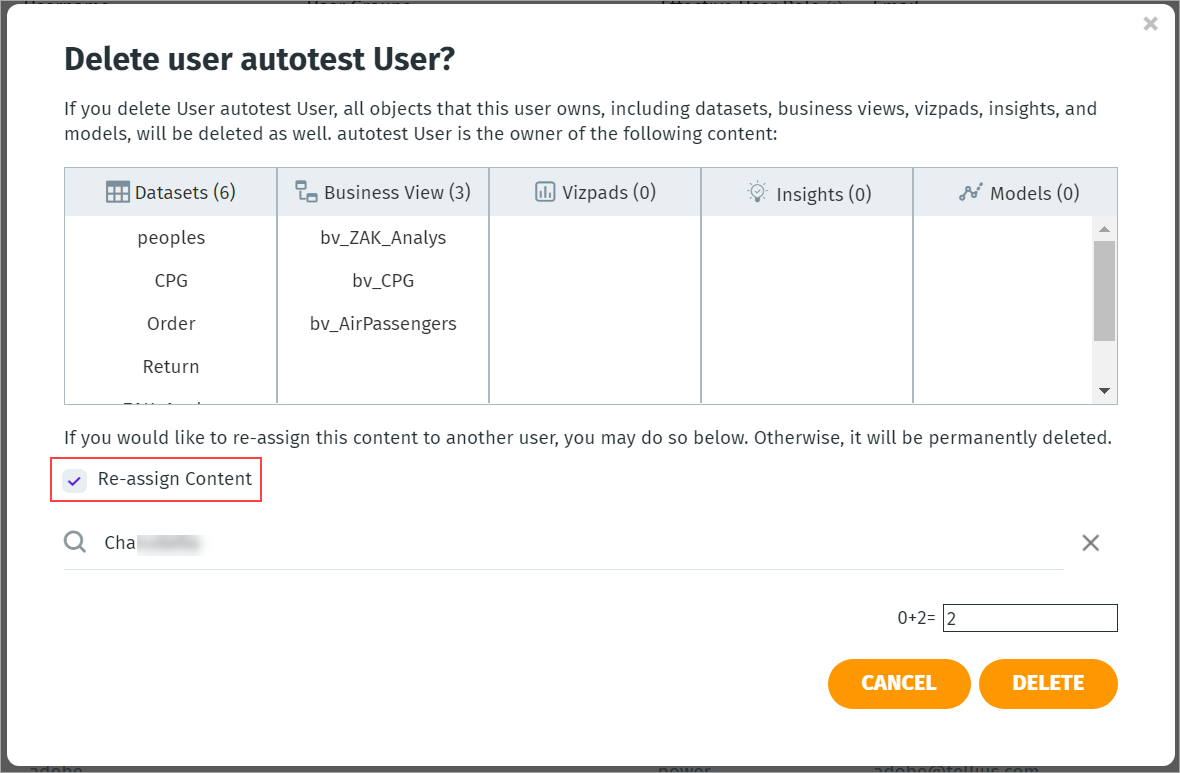
Learn more here
Enable In-memory operations on Live sources
This configuration enables in-memory operations such as Discover, Insights, and ML on Live Business Views.
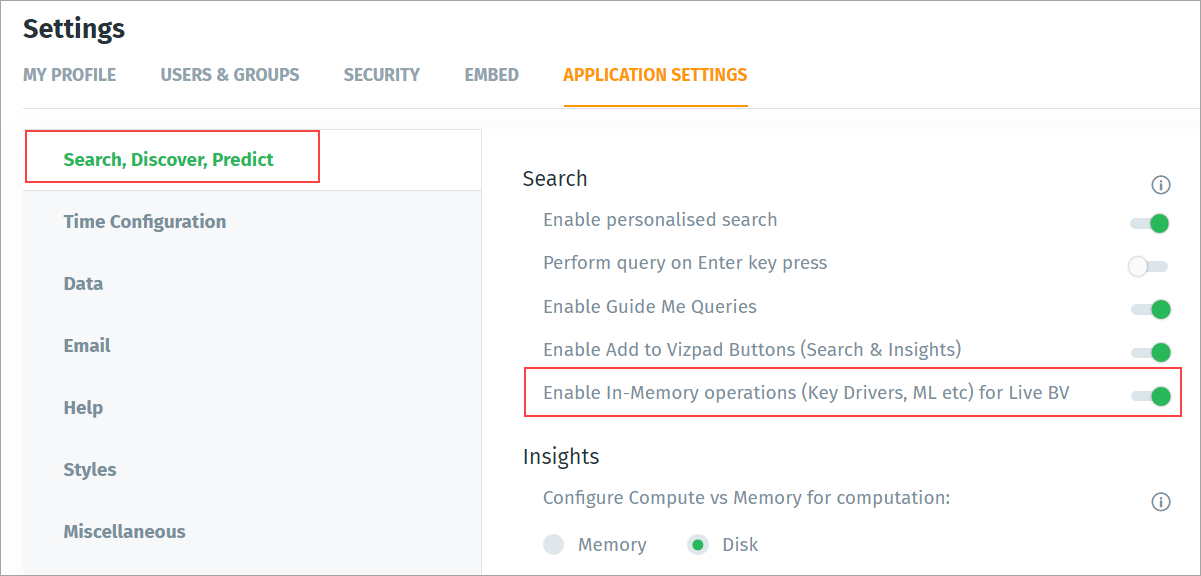
Learn more here
Minimum Effective User role for Sharing
The minimum effective role for sharing configuration determines the lowest level of role needed to share objects between users. Any user with a role below the level of the effective role will be unable to share content.
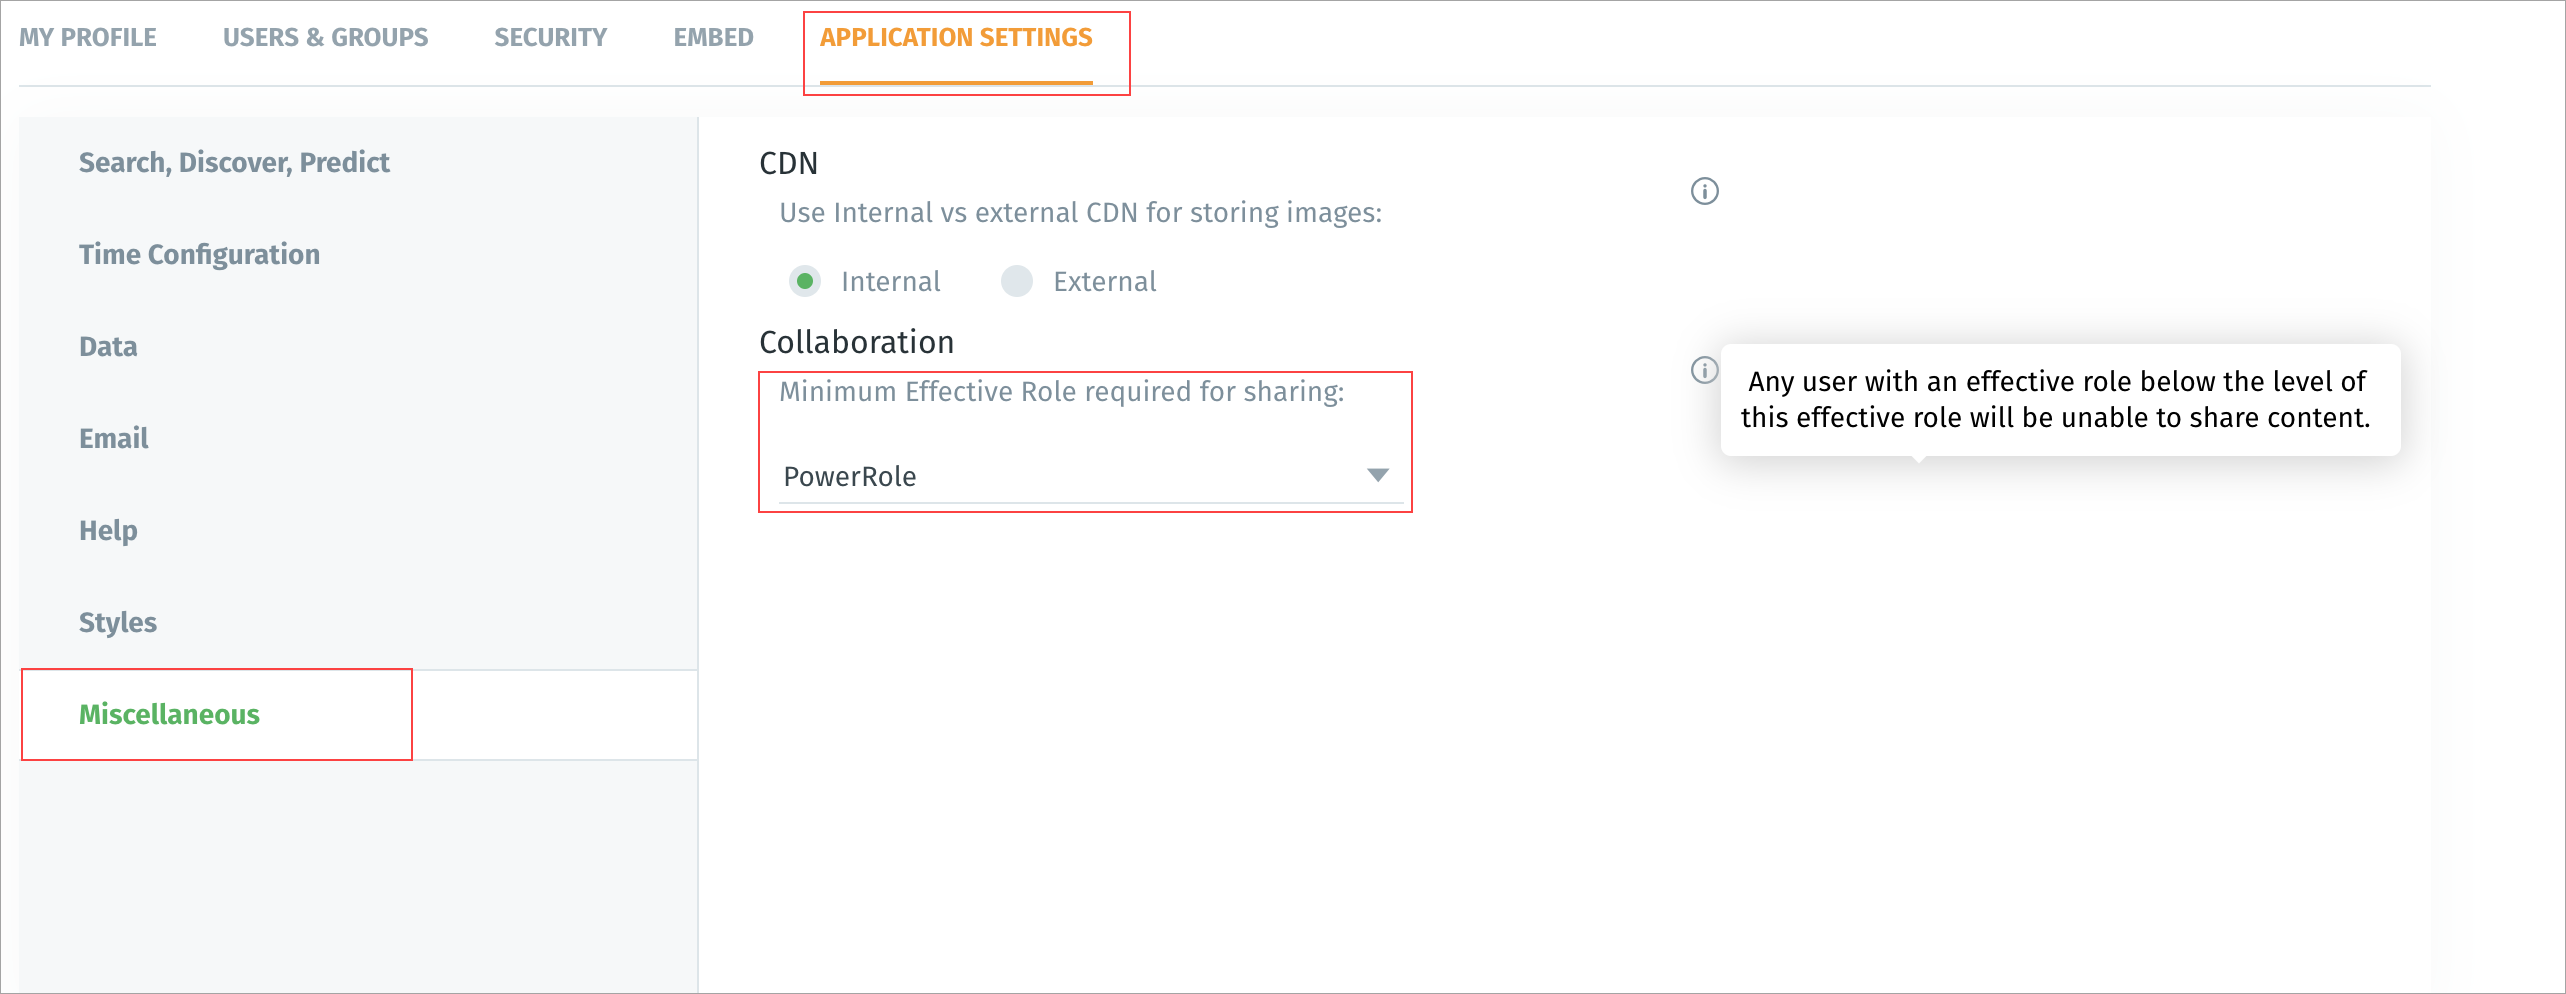
Learn more here
Users with the View role are restricted from creating Alerts
In Tellius, a role is a collection of permissions allowed to any specific user or group. Every user is assigned a specific role and they can perform a set of operations.
Users with the View role can view objects that are shared with them. Such users are now restricted from creating Alerts.
Update Time-to-Live for Caches
Time To Live (TTL) is the time that Tellius stores an object in a caching system before deleting or refreshing the cache.
- TTL for non-live Business Views is set to 30 days
- TTL for caching the query results for Live Business Views is set to 60 minutes
After TTL, the cache is removed and the queries are executed directly on the Datasource.
Insights
Improvements to Insights Algorithms
When measures are ratios or averages, there are cases where the absolute change can be on the higher side, but the impact of that on the overall change between the two time periods or cohorts can be very small due to low population. Our prior algorithms highlighted potential top contributors based on the absolute difference.
With 3.9, we've updated our Insights algorithm. Impact scores for potential top contributors that represent a very small amount or a very large amount of the data are considered as not interesting and hence suppressed. This modification includes an exponential decay factor below a certain low population threshold and above a certain high population threshold. The exponential decay has a similar effect to simply filtering out candidate top contributors outside of these limits but allows for smoother suppression around the limits.
For example, in case of `Change in average interest rate` between Q1 and Q2, the top contributor based on the absolute change might be "state = XYZ", but the number of loans associated with that state might be 0.01% of the overall data. Such low population contributors will be filtered out with the updated algorithm.
Fixed Issues
Version Updates
- Log4j version (existing version number) is updated to the 2.7.1 version to remediate vulnerabilities in the older version of Log4j.
- Delta Lake JDBC driver updated from (existing) to 2.6.22 to address Log4j issues.
- Spark updated from 2.4.5 to 3.0.3
- Python Upgrade to 3.8.15
Retain predictions when adding/updating calculated columns
If a Model prediction is applied to the Business View, it adds prediction columns to the BusinessView, which can be used for visualization or further analysis. These columns were removed when adding or updating calculated columns to such a business view. This issue has been resolved.
SSO users added to the Usage Data Model
New users created using SSO were not added to the Users table in our Usage Data Model. This issue has been resolved.