Tellius
Tellius 5.5
Tellius 5.5
  • 🚩Getting Started
    • 👋Say Hello to Tellius
      • Glossary
      • Tellius 101
      • Navigating around Tellius
    • ⚡Quick Start Guides
      • Search
      • Vizpads (Explore)
      • Insights (Discover)
    • ✅Best Practices
      • Search
      • Vizpads (Explore)
      • Insights (Discover)
      • Predict
      • Data
    • ⬇️Initial Setup
      • Tellius architecture
      • System requirements
      • Installation steps for Tellius
      • Customizing Tellius
    • Universal Search
    • 🏠Tellius Home Page
    • ❓FAQs
      • Kaiya Conversational AI
      • Data Preparation FAQs
      • Environment FAQs
      • Search FAQs
      • Vizpads FAQs
      • Data Caching FAQs
      • Embedding FAQs
      • Insights FAQs
  • Kaiya
    • ♟️Understanding AI Agents & Agentic Flows
      • Glossary
      • Composer
      • 🗝️Triggering an agentic workflow
      • The art of possible
    • 🤹Kaiya conversational AI
      • Triggering Insights with "Why" questions
      • Mastering Kaiya conversational AI
      • 📒Kaiya Learnings
      • Kaiya Terms of Service
      • Best practices
  • 🔍Search
    • 👋Get familiar with our Search interface
    • 🤔Understanding Tellius Search
    • 📍Search Guide
    • 🚀Executing a search query
      • Selecting a Business View
      • Typing a search query
      • Constructing effective search queries
      • Marketshare queries
    • 🔑Analyzing search results
      • Understanding search results
      • Search Inspector
      • Time taken to execute a query
      • Interacting with the resulting chart
    • 📊Know your charts in Tellius
      • Understanding Tellius charts
      • Variations of a chart type
      • Building charts from Configuration pane
      • List of chart-specific fields
      • Adding columns to fields in Configuration pane
      • Absolute and percentage change aggregations
      • Requirements of charts
      • Switching to another chart
      • Formatting charts
      • Advanced Analytics
      • Cumulative line chart
    • 🧑‍🏫Help Tellius learn
    • 🕵️‍♂️Search history
    • 🎙️Voice-driven search
    • 🔴Live Query mode
  • 📈Vizpads (Explore)
    • 🙋Meet Vizpads!
    • 👋Get familiar with our Vizpads
    • #️⃣Measures, dimensions, date columns
    • ✨Creating Vizpads
    • 🌐Applying global filters
      • Filters in multi-BV Vizpads
      • Filters using common columns
    • 📌Applying local filters
    • 📅Date picker in filters
      • Customizing the calendar view
    • ✅Control filters
      • Multi-select list
      • Single-select list
      • Range slider
      • Dropdown list
    • 👁️Actions in View mode
      • Interacting with the charts
      • Exporting tables
    • 📝Actions in Edit mode
      • 🗨️Viz-level actions
      • Copy to Clipboard
    • 🔧Anomaly management for line charts
      • Instance level
      • Vizpad level
      • Chart level
    • ⏳Time taken to load a chart
      • Instance level
      • Vizpad level
      • Chart level
    • ♟️Working with sample datasets
    • 🔁Swapping Business View of charts
      • Swapping only the current Vizpad
      • Swapping multiple objects
      • Configuring the time of swap
    • 🤖Explainable AI charts
  • 💡Insights (Discover)
    • 👋Get familiar with our Insights
    • ❓Understanding the types of Insights
    • 🕵️‍♂️Discovery Insights
      • Impact Calculation for Top Contributors
    • ➕How to create new Insights
      • 🔛Creating Discovery Insight
      • 🔑Creating Key Driver Insights
      • 〰️Creating Trend Insights
      • 👯Creating Comparison Insights
    • 🧮The art of selecting columns for Insights
      • ➡️How to include/exclude columns?
  • 🔢Data
    • 👋Get familiar with our Data module
    • 🥂Connect
    • 🪹Create new datasource
      • Connecting to Oracle database
      • Connecting to MySQL database
      • Connecting to MS SQL database
      • Connecting to Postgres SQL database
      • Connecting to Teradata
      • Connecting to Redshift
        • Access S3 Data with Redshift Spectrum
      • Connecting to Hive
      • Connecting to Azure Blob Storage
      • Connecting to Spark SQL
      • Connecting to generic JDBC
      • Connecting to Salesforce
      • Connecting to Google cloud SQL
        • Connecting to a PostgreSQL cloud SQL instance
        • Connecting to an MSSQL cloud SQL instance
        • Connecting to a MySQL Cloud SQL Instance
      • Connecting to Amazon S3
      • Connecting to Google BigQuery
        • Steps to connect to a Google BigQuery database
      • Connecting to Snowflake
        • OAuth support for Snowflake
        • Integrating Snowflake with Azure AD via OAuth
        • Integrating Snowflake with Okta via OAuth
        • Azure PrivateLink
        • AWS PrivateLink
        • Best practices
      • Connecting to Databricks
      • Connecting to Databricks Delta Lake
      • Connecting to an AlloyDB Cluster
      • Connecting to HDFS
      • Connecting to Looker SQL Interface
      • Loading Excel sheets
      • 🚧Understanding partitioning your data
    • ⏳Time-to-Live (TTL) and Caching
    • 🌷Refreshing a datasource
    • 🪺Managing your datasets
      • Swapping datasources
    • 🐣Preparing your datasets
      • 🤾Actions that can be done on a dataset
      • Data Pipeline
      • SQL code snippets
      • ✍️Writeback window
      • 🧩Editing Prepare → Data
      • Handling null or mismatched values
      • Metadata view
      • List of icons and their actions
        • Functions
        • SQL Transform
        • Python Transform
        • Standard Aggregation
        • Creating Hierarchies
      • Dataset Scripting
      • Fusioning your datasets
      • Scheduling refresh for datasets
    • 🐥Preparing your Business Views
      • 🌟Create a new Business View
      • Creating calculated columns
      • Creating dynamic parameters
      • Scheduling refresh for Business Views
      • Setting up custom calendars
      • Custom Calendars for Live Connections
    • Tellius Engine: Comparison of In-Memory vs. Live Mode
    • User roles and permissions
    • Refresh pipeline
  • Feed
    • 📩What is a Feed in Tellius?
    • ❗Alerts on the detection of anomalies
    • 📥Actions done on a tracking Feed
    • 🖲️Track a new metric
  • Assistant
    • 💁Introducing Tellius Assistant
    • 🎤Voice-based Assistant
    • 💬Interacting with Assistant
    • ↖️Selecting Business View
  • Embedding Tellius
    • What you should know before embedding
    • Embedding URL
      • 📊Embedding Vizpads
        • Apply and delete filters
        • Vizpad-related actionTypes
        • Edit, save, and share a Vizpad
        • Keep, remove, drill sections
        • Adding a Viz to a Vizpad
        • Row-level policy filters
      • 💡Embedding Insights
        • Creating and Viewing Insights
      • 🔎Embedding Search
        • Search query execution
      • Embedding Assistant
      • 🪄Embedding Kaiya
      • Embedding Feed
  • API
    • Insights APIs
    • Search APIs
    • Authentication API (Login API)
  • ✨What's New
    • Release 5.5
    • Release 5.4
      • Patches 5.4.0.1 to 5.4.0.4
      • Patch 5.4.0.5
      • Patch 5.4.1
      • Patches 5.4.1.1 and 5.4.1.2
    • Release 5.3
      • Patch 5.3.1
      • Patch 5.3.2
      • Patch 5.3.3
    • Release 5.2
      • Patch 5.2.1
      • Patch 5.2.2
    • Release 5.1
      • Patch 5.1.1
      • Patch 5.1.2
      • Patch 5.1.3
    • Release 5.0
      • Patch 5.0.1
      • Patch 5.0.2
      • Patch 5.0.3
      • Patch 5.0.4
      • Patch 5.0.5
    • Release 4.3 (Fall 2023)
      • Patch 4.3.1
      • Patch 4.3.2
      • Patch 4.3.3
      • Patch 4.3.4
    • Release 4.2
      • Patch 4.2.1
      • Patch 4.2.2
      • Patch 4.2.3
      • Patch 4.2.4
      • Patch 4.2.5
      • Patch 4.2.6
      • Patch 4.2.7
    • Release 4.1
      • Patch 4.1.1
      • Patch 4.1.2
      • Patch 4.1.3
      • Patch 4.1.4
      • Patch 4.1.5
    • Release 4.0
Powered by GitBook

© 2025 Tellius

On this page
  • View the metrics being tracked
  • Actions that can be done to a Feed being tracked
Was this helpful?

  1. Feed

Actions done on a tracking Feed

Manage your metrics - know how to view or delete the existing metrics

PreviousAlerts on the detection of anomaliesNextTrack a new metric

Last updated 3 days ago

Was this helpful?

View the metrics being tracked

  1. Click on the Feed tab on the left pane and the list of existing Feeds will be displayed. 

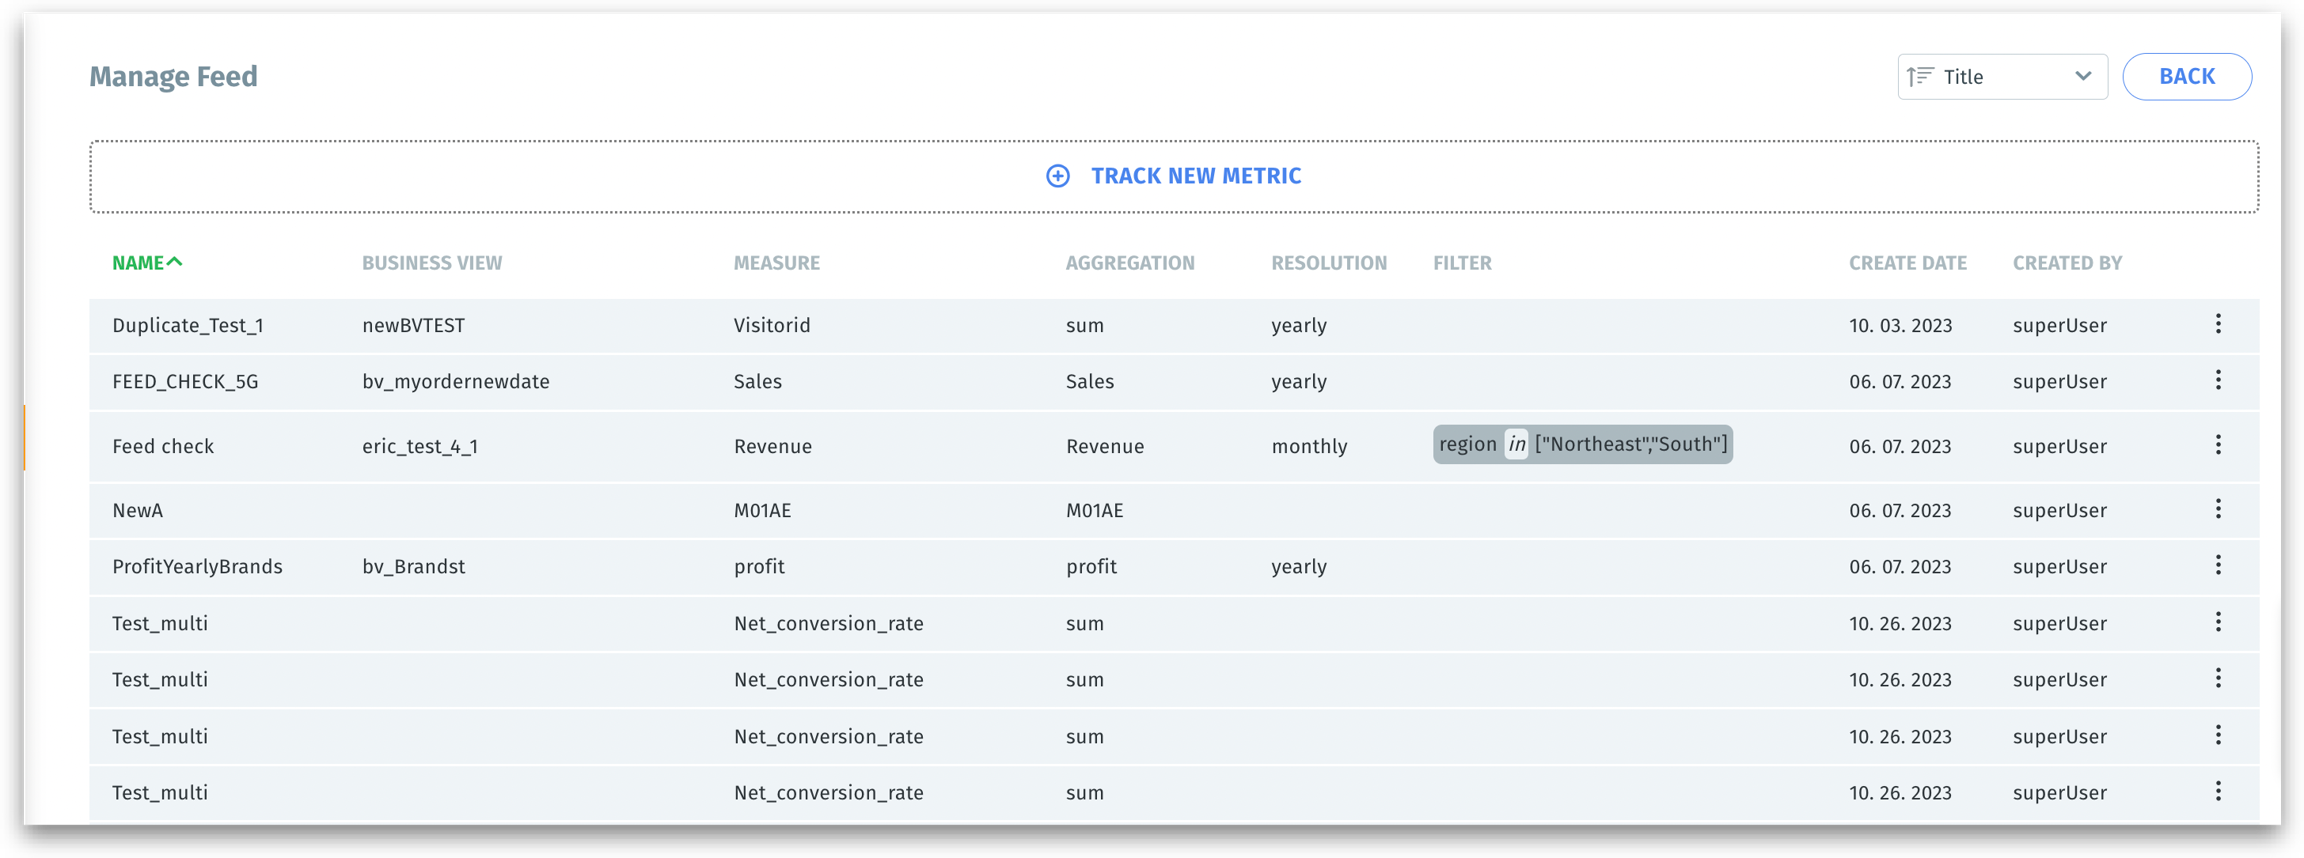
  2. Click on Manage Feeds in the top right corner. The list of existing metrics being tracked will be displayed with the following details:

  • Name - name of the Feed

  • Business View - Business View associated with the Feed

  • Measure - metric being tracked

  • Aggregation - aggregation followed for the measure

  • Resolution - the frequency by which the metric is monitored

  • Filter - filters applied (if any)

  • Create date - the date when the Feed was created

  • Created by - the creator of the Feed

Actions that can be done to a Feed being tracked
  1. Navigate to Feed → Manage Feed.

  2. A list of metrics that are currently being tracked will be displayed.

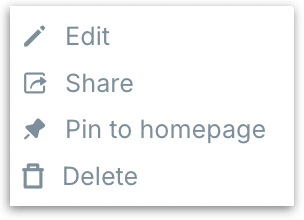
  3. Click on the three-dot (kebab) menu, and you will find the following options:

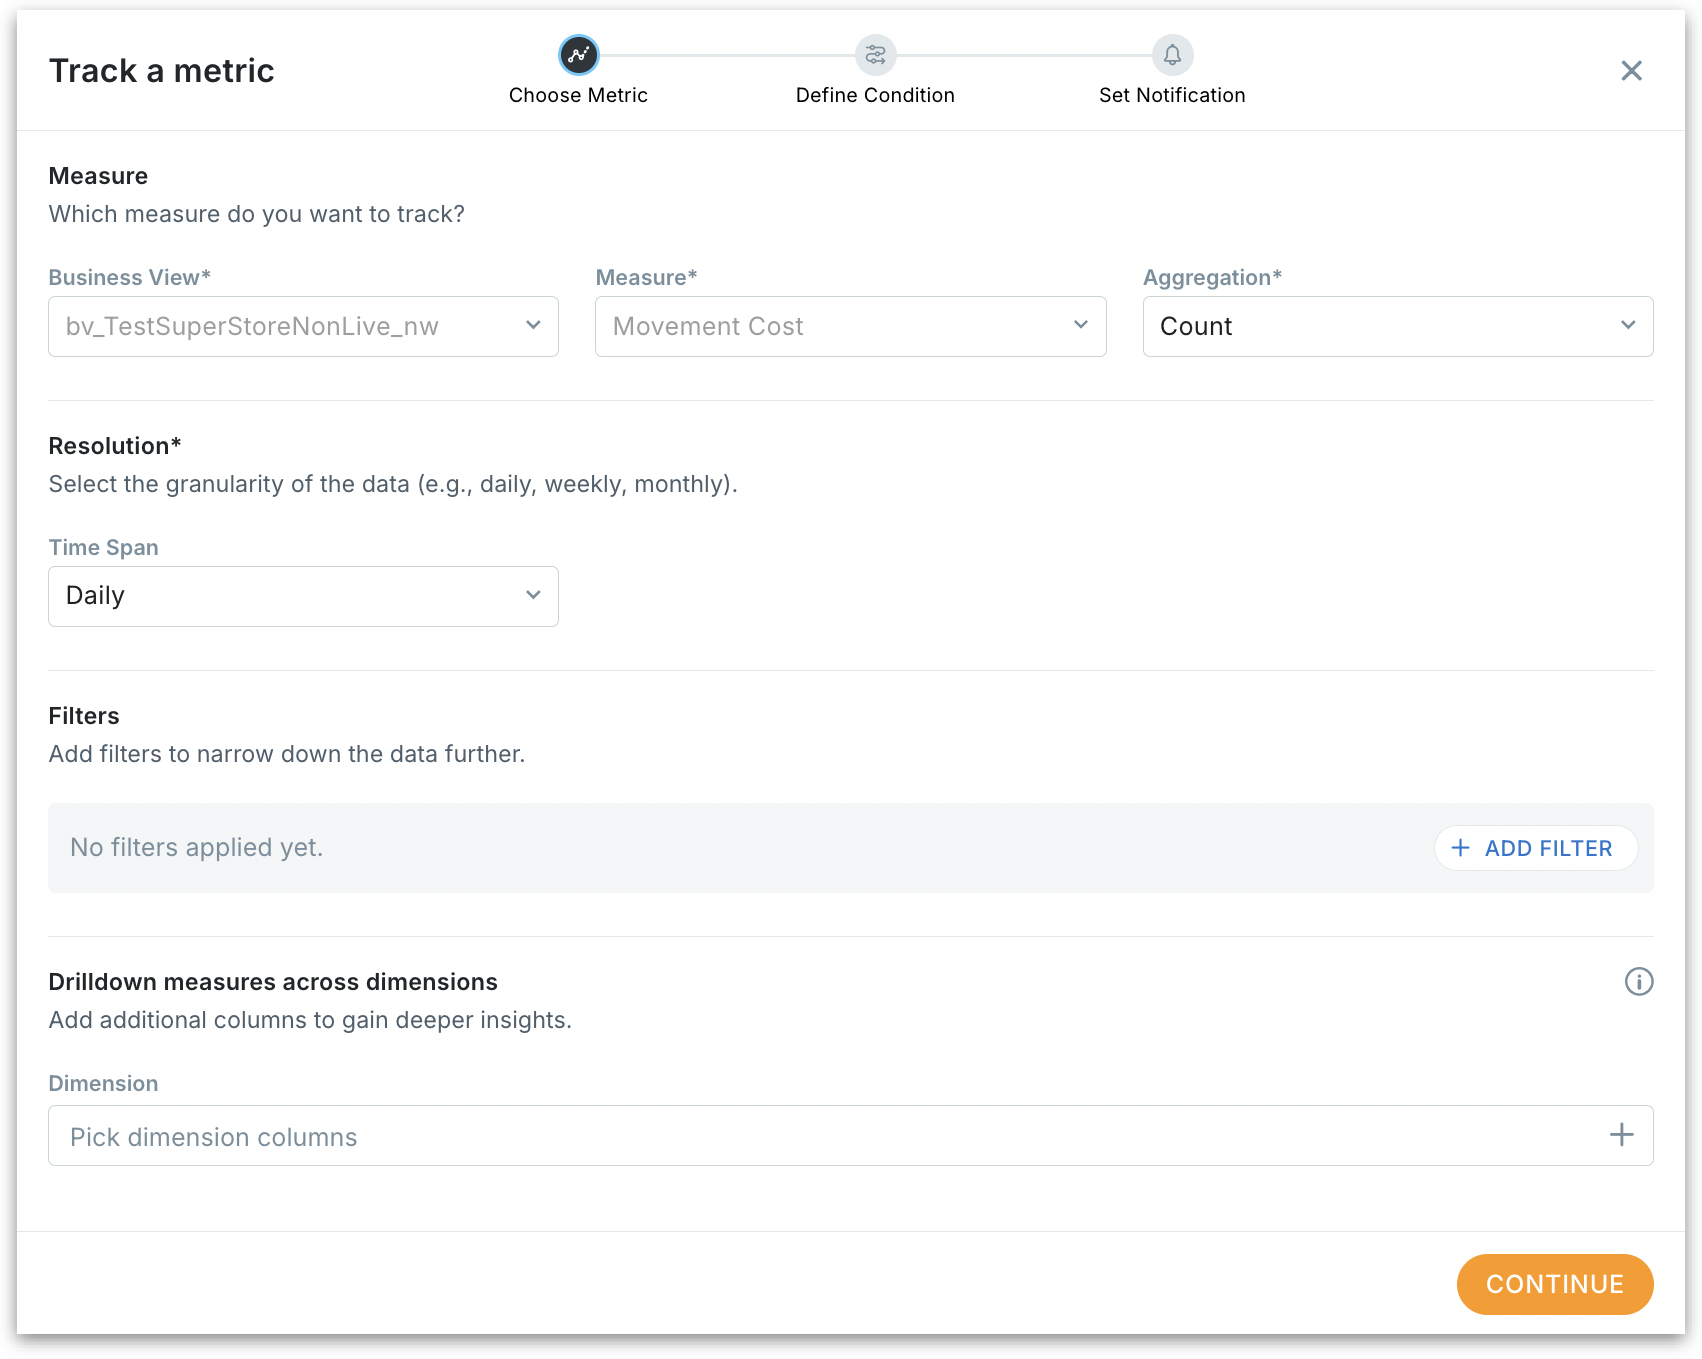
  • Edit: To edit a Feed being tracked, click on Edit and the following Track a metric window appears where you can make the intended changes.

  • Share: Click on Share, then enter the name, username, or email address of the people you want to share the Feed with. Mention whether the users can view or edit.

  • Pin to homepage: Pins the Feed to the homepage so that you can track the KPI metric under "Tracked Metrics" right when you log in.

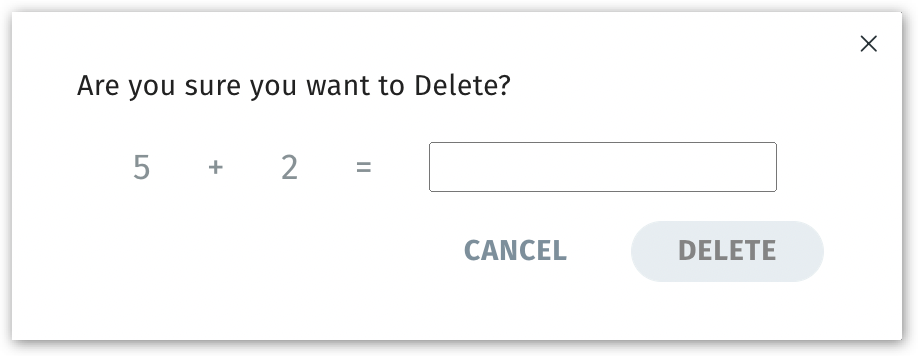
  • Delete: Click on Delete and the following will be displayed. In the confirmation window, provide the correct answer for the given question.

📥
List of metrics being tracked
Feed actions
Edit Feed
Share Feed
Confirmation window