🖲️Track a new metric
Set up Feeds to track key metrics over time in Tellius, define smart anomaly or threshold-based conditions, and schedule email alerts with rich summaries.
From v4.3, users can track and get notified of anomalies in calculated columns. While creating a new Feed, user-created calculated columns will be available in the list of measures to track, the list of columns during column selection, and the list of filters. Also, market share can be set as an aggregation for the tracked measures during Feed creation.
Tellius “Feed” lets you monitor specific metrics over time and get alerts when important patterns, trends, or anomalies occur. You can set thresholds, use smart prediction-based triggers, and receive email notifications with visual insights attached.
The following is the step-by-step process of creating a Feed into three key steps:
Choose Metric
Define Condition
Set Notification
Choose Metric
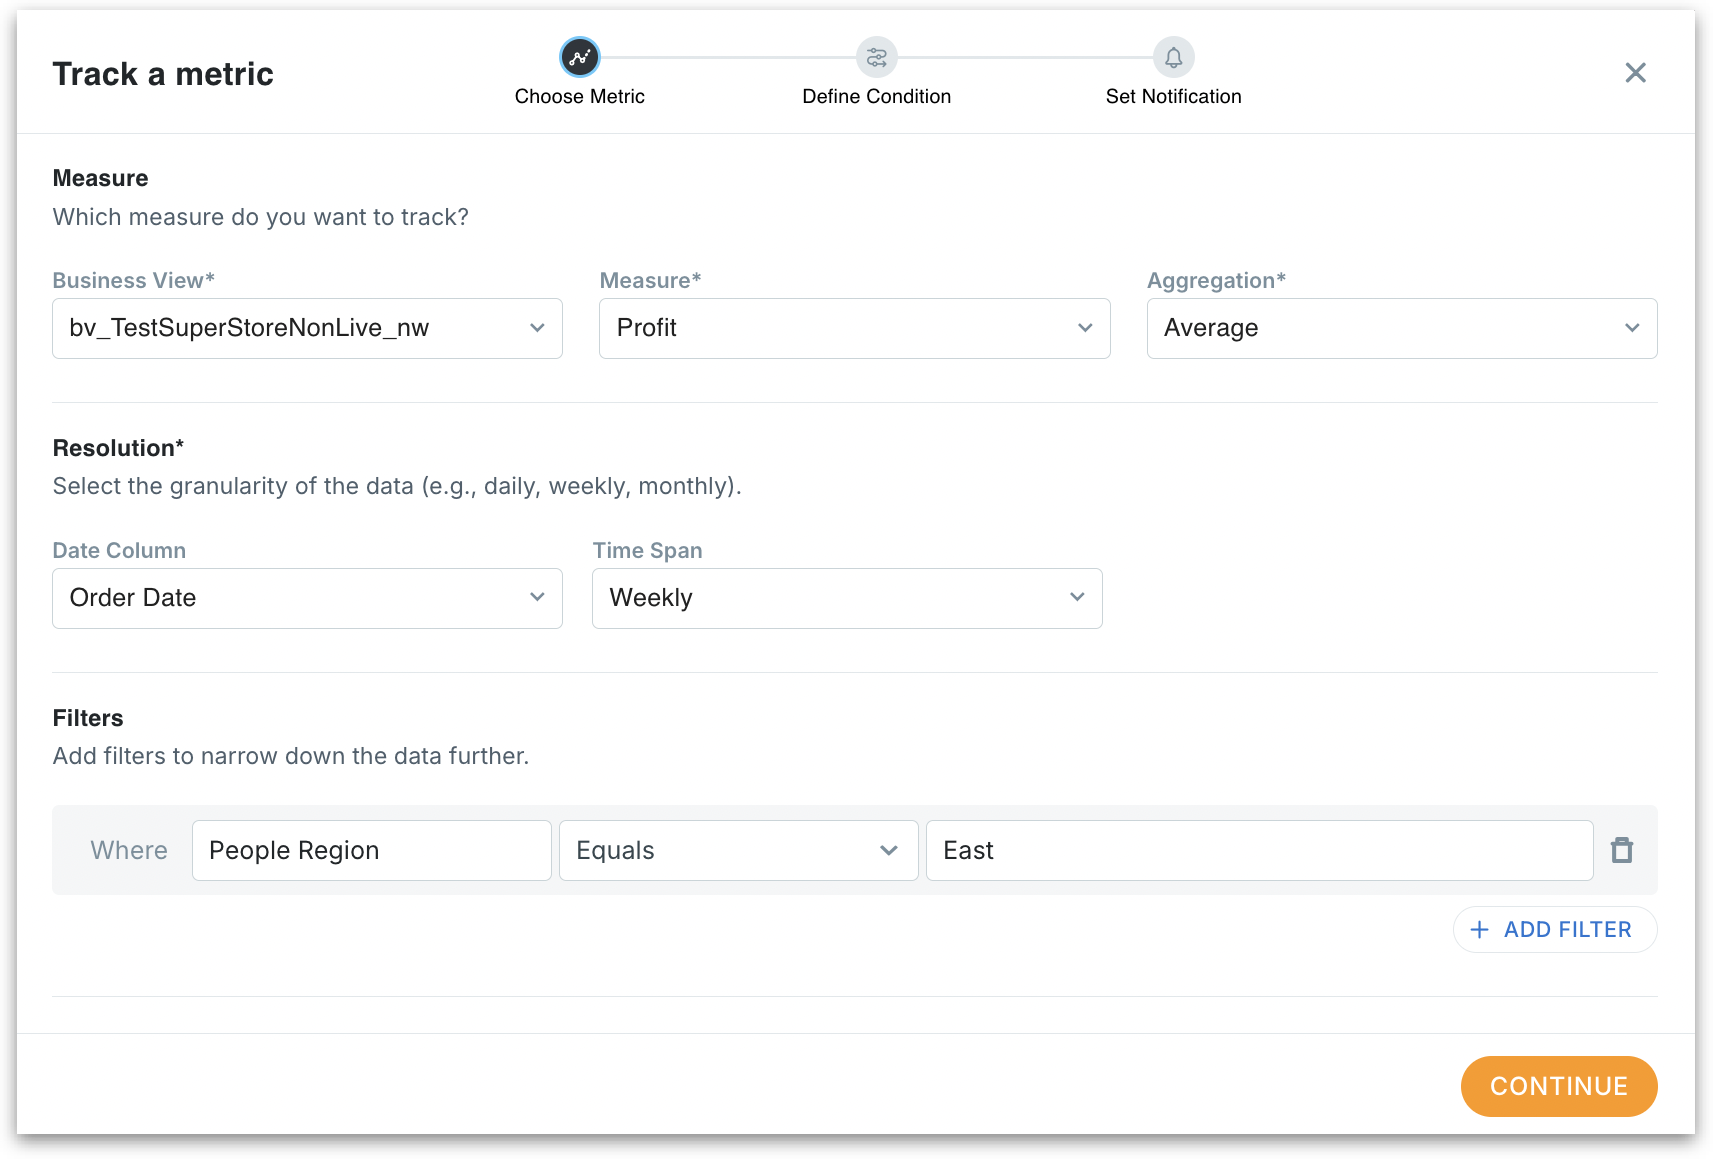
Measure Section: This is where you define the metric you want to track. Select the required Business View, Measure, and Aggregation. This is the specific numeric field you want to monitor, that can be aggregated over time.
Date Column: Choose the date that matches the metric’s event. This is the timestamp used to bucket data by the Time Span you choose (daily, weekly, monthly etc.). All aggregations and comparisons run on this column. For example, if you are tracking weekly Sales, set Date Column = Order_Date and Time Span = Weekly.
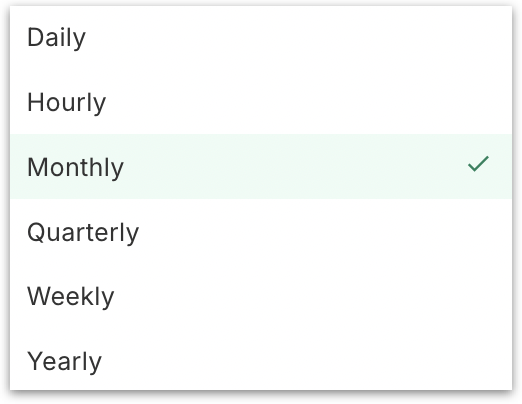
Time Span: This field controls the granularity at which Tellius aggregates and evaluates your selected metric. It determines the time window size for analyzing metric values. For example, if set to Monthly, Tellius will compute one aggregated value per month.
Filters (Optional): Apply filters to narrow the scope of the metric. Example: Only track “Movement Cost” where Ship Mode contains First Class. You can add multiple filters with “+ Add Filter”.
Define Condition
This step decides when to trigger the Feed alert.
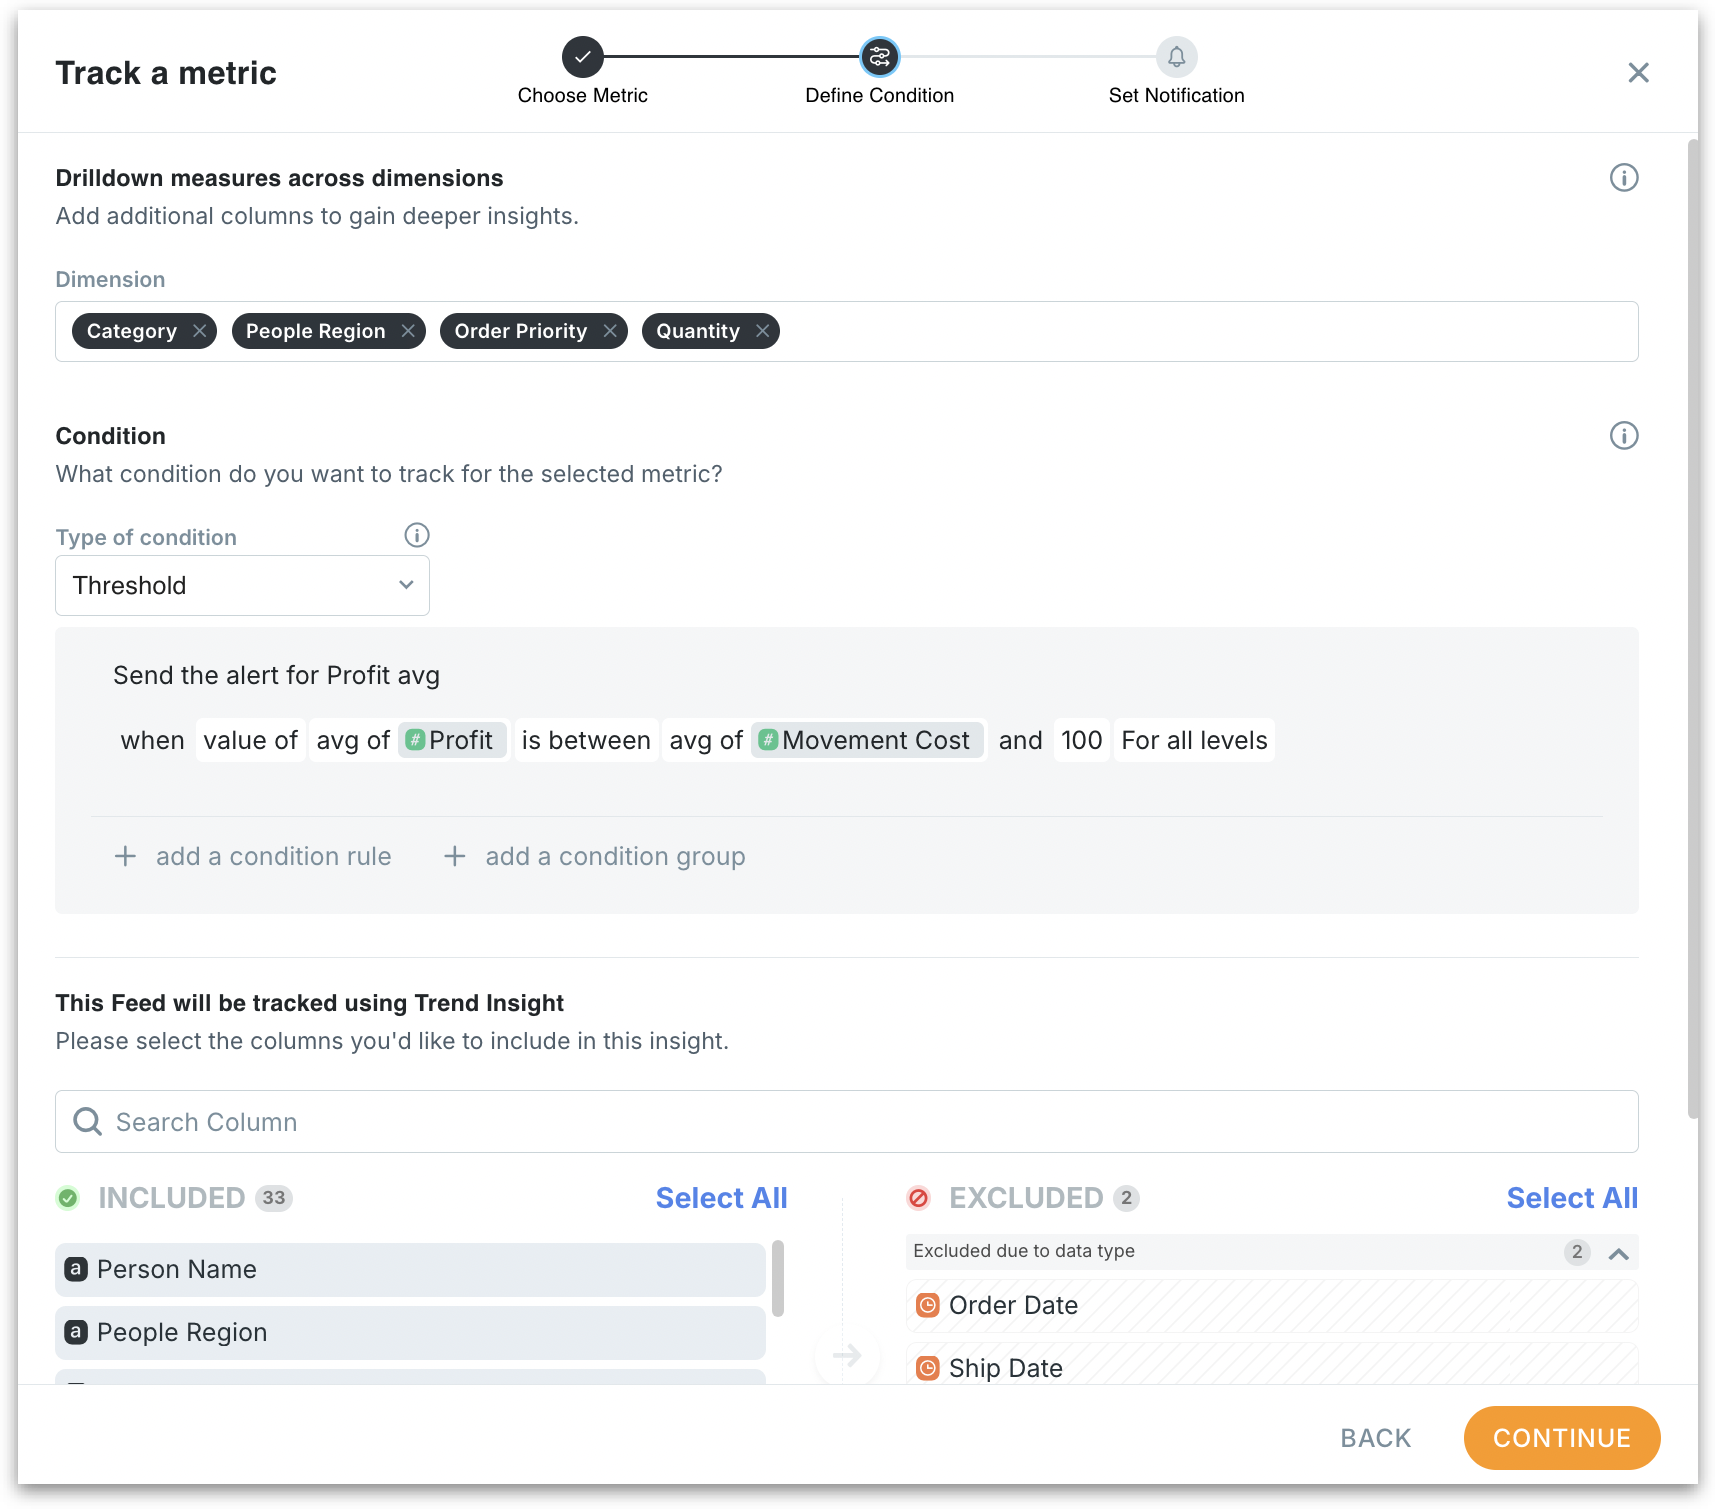
Drilldown measures across dimensions
Add additional dimensions to break down and track the metric. Tellius will monitor how the metric behaves across each distinct value within these dimensions to highlight key segments.
Tellius can track not just the overall metric, but also how it changes for each item in those columns. For example, if you’re tracking Sales, adding Region will let you know which regions had the biggest increases or drops in Sales. It helps you see where the changes are happening within your data.
Type of condition
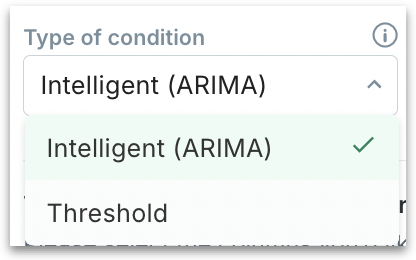
Intelligent (ARIMA): Uses time-series forecasting to automatically detect unusual patterns or spikes. Great when you want smart detection without setting fixed thresholds.
Threshold-based conditions: Choose this if you want to trigger an alert when the metric matches a set of condition(s). A similar sentence will be displayed by default when you select threshold-based condition.

The sentence defines a rule that compares an LHS value to one or more RHS values.
The LHS is the metric you are testing at evaluation time (for example, average Shipping_Cost for each City this week).
The RHS is the target you compare against (for example, a fixed number like 100, or another aggregated metric like average Movement Cost).
+ add a condition rule: Adds another line that is AND/OR-ed with the current rule inside the same group.
+ add a condition group: Starts a new block that is AND/OR-ed with the previous group(s).
This lets you express logic like: trigger if (A AND B) OR (C).
Editable parts in the example sentence
Profit avg
This is the metric being monitored. You can click it to change the column or the aggregation.
value of
This token introduces the LHS, i.e., the value we will measure and test. It is always followed by the column/aggregation.
Based on value: Simply checks whether the current value of the metric meets a specific condition (like >1000). Example: Notify me if Revenue exceeds $5000 this month.
Based on change: Tracks if the difference between the current value and the previous period’s value crosses your set threshold. Example: Alert me if Sales increase or decrease by 100 units compared to last month.
Based on % change: Triggers when the percentage change between the current value and the previous period exceeds your limit. Example: Notify me if Profit drops by more than 10% compared to the previous week.
Based on Absolute Change: Similar to "Based on change", but strictly tracks the size of the change, regardless of direction (positive or negative). Example: Alert me if Sales move up or down by more than 200, no matter if it's an increase or decrease.
avg of Profit
This is the LHS metric itself. Choose the column and aggregation whose values you want to test.
avg of Movement Cost and 100
These are the RHS targets. Each RHS can be either a Fixed value (numeric threshold against which the metric is compared using the operator) or a Column + aggregation (a dynamic, data-driven baseline).
For all levels
Granularity scope: This determines where the rule is checked. “For all levels” evaluates the rule at the overall level. When you select levels, the rule is evaluated per value of those dimensions, and alerts fire only where the condition is true.
Column Selection for Trend Insight
Choose which columns to include in the Insight generation. Tellius will use these to explain why a trend is happening by breaking down metric behavior across these columns.
Included: Columns used for identifying patterns or segments contributing to the trend.
Excluded: Some columns (e.g., date columns) are automatically excluded due to incompatibility with tracking logic.
Set Notification
This step controls how and when you’ll be notified about metric changes. This section allows you to define when the alert for your tracked metric should be triggered—based on how your data is updated or your own timing preferences.
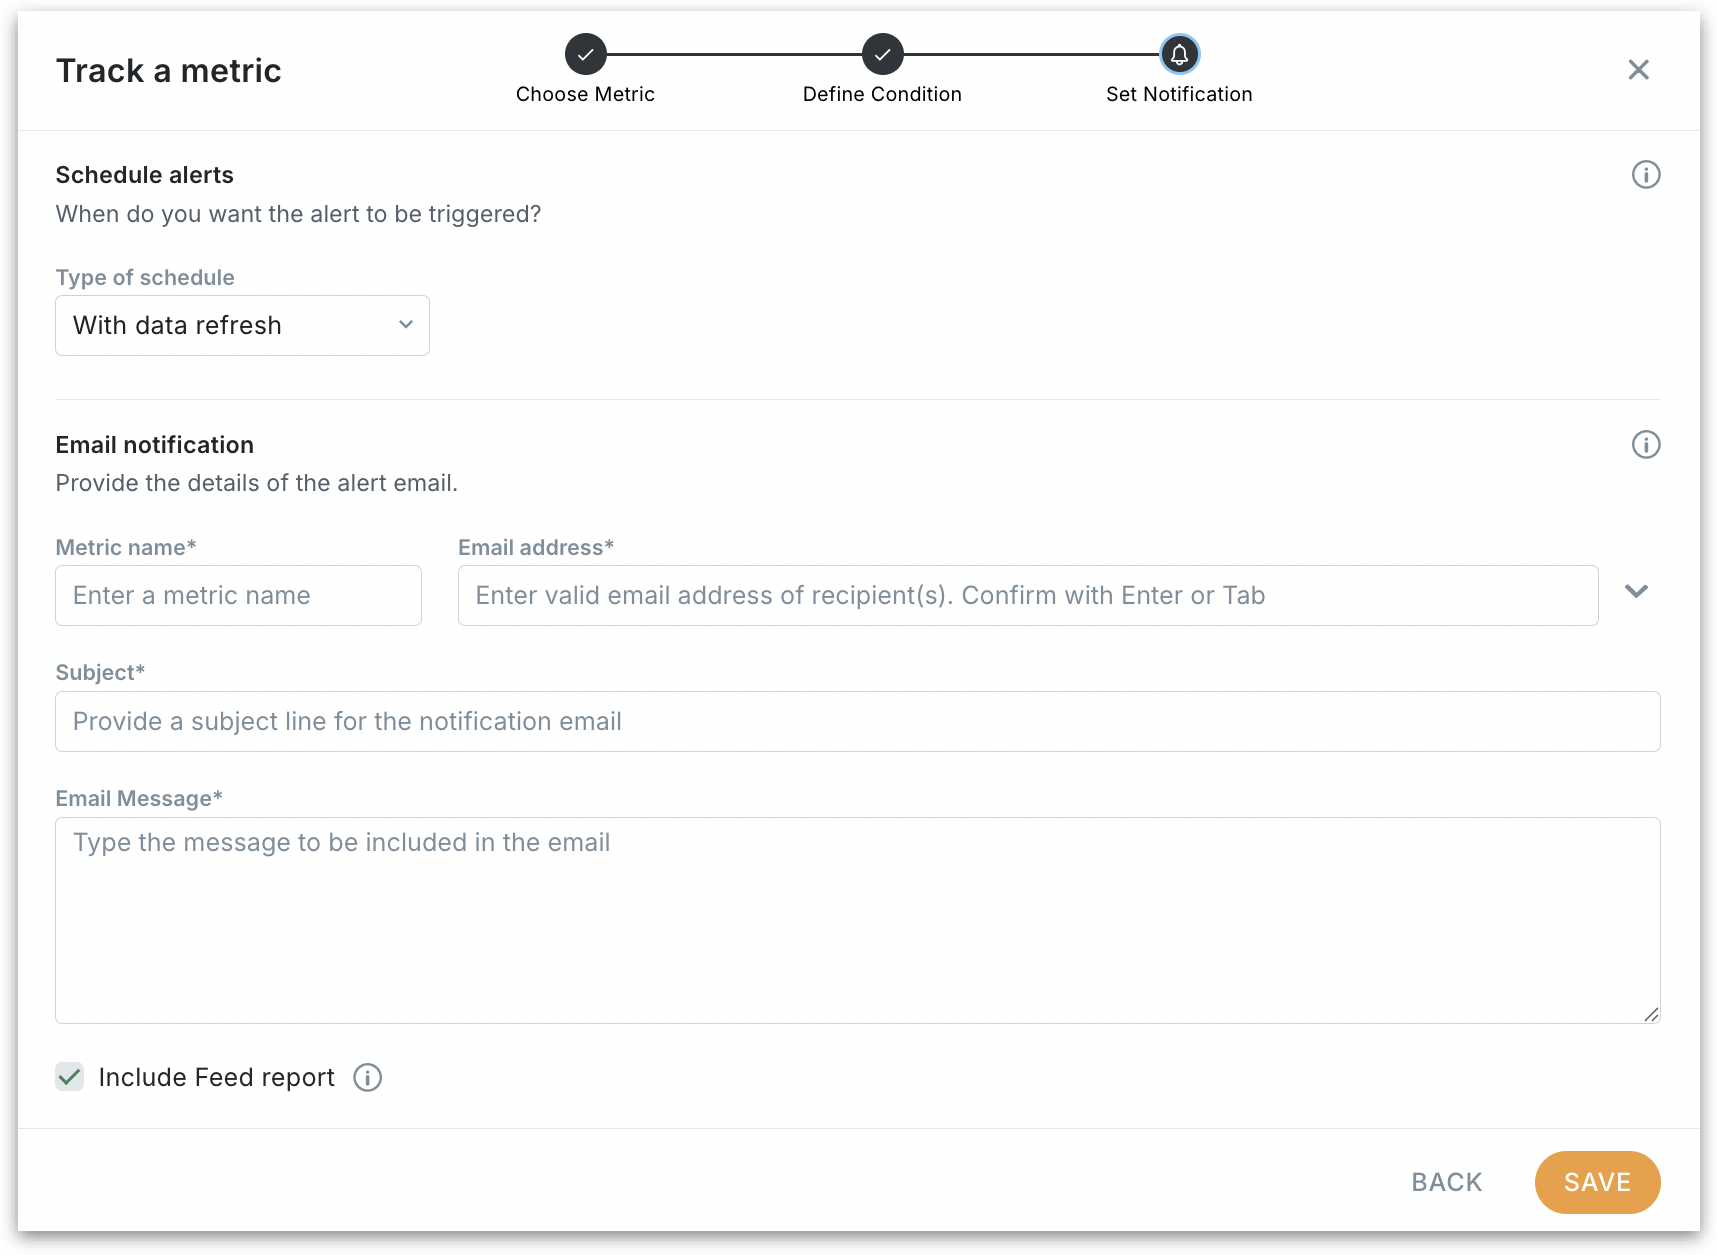
Type of schedule
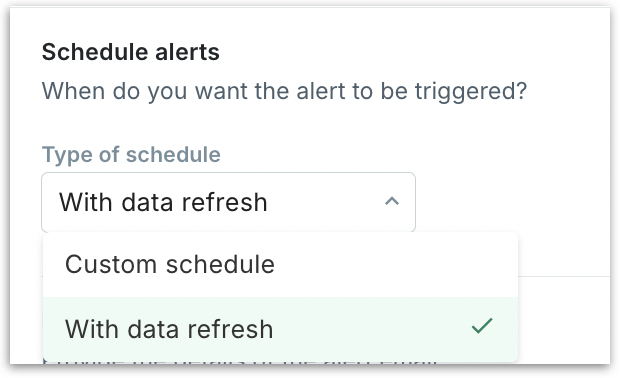
With Data Refresh: Select this option if you want the alert to run automatically after each data refresh. Tellius will evaluate your tracked condition every time the Business View updates with new data—ideal for near real-time monitoring.
Custom schedule: Choose this if you want the alert to trigger on a specific cadence—like daily at 9 AM, every Monday, or on the 1st of each month—regardless of when the data was last refreshed. Provide the required start date, time, and frequency.
Email Notification: Customize how the alert is delivered:
Metric Name: Name that will appear in the Feed list and email notifications.
Email Address: Add one or more recipients. Use Enter/Return to confirm each.
Subject: Appears in the email subject line.
Email Message: Body of the alert email. Use this to explain what’s being tracked or what actions to take.
Include Feed Report: If enabled, an Excel report of the Feed’s metric values and dimensions is attached to the alert email.
Include Kaiya summary: Adds a customized, narrative summary to the alert email as a PDF.
Provide context here: Briefly tell Kaiya what this feed is about and why it matters. This guides tone and focus in the summary (e.g., audience, goals, constraints).
Describe key points to highlight: Provide the must-cover points you want in the narrative (e.g., KPI, dimensions to highlight, comparisons, actions). This steers the summary to be precise and avoids generic wording. For example, “Emphasize MoM change in Net Revenue".
Once all steps are completed, click on Save to activate the Feed. Tellius will monitor your metric and notify you automatically when conditions are met.
Was this helpful?