✨Creating Vizpads
Learn how to build Vizpads in Tellius—create multi-Business View dashboards, add charts and filters, and design interactive, insight-ready visual workspaces.
In Tellius, Vizpads are designed for versatility, allowing you to incorporate multiple Business Views within a single workspace. For example, you can seamlessly integrate Sales, Marketing, and Support datasets into one Vizpad, offering a comprehensive platform to analyze various facets of your business simultaneously.
Multi-Business View Vizpads
Incorporating multiple Business Views into a single Vizpad is a strategic way to leverage your data for maximum impact.
Benefits of Multi-Business View Vizpads
With the ability to combine different Business Views, you gain a 360-degree perspective of your business operations, enabling you to identify cross-functional insights.
Multi-Business View Vizpads centralize critical data points, simplifying the decision-making process, and drawing more cohesive decisions.
By aggregating multiple data sources into a single Vizpad, you eliminate the need to switch between different Vizpads, thereby saving time and enhancing productivity.
The process of creating a new Vizpad includes the following steps:
Create a blank Vizpad
Select a default Business View
Add additional charts (if required)
Add objects and control filters (if required)
Apply filters (if required)
Interact with the chart
Save the Vizpad to a Project
Creating a blank Vizpad
Go to the Explore tab and click on the plus (Create new Vizpad) button. You will be redirected to a blank canvas shown below:
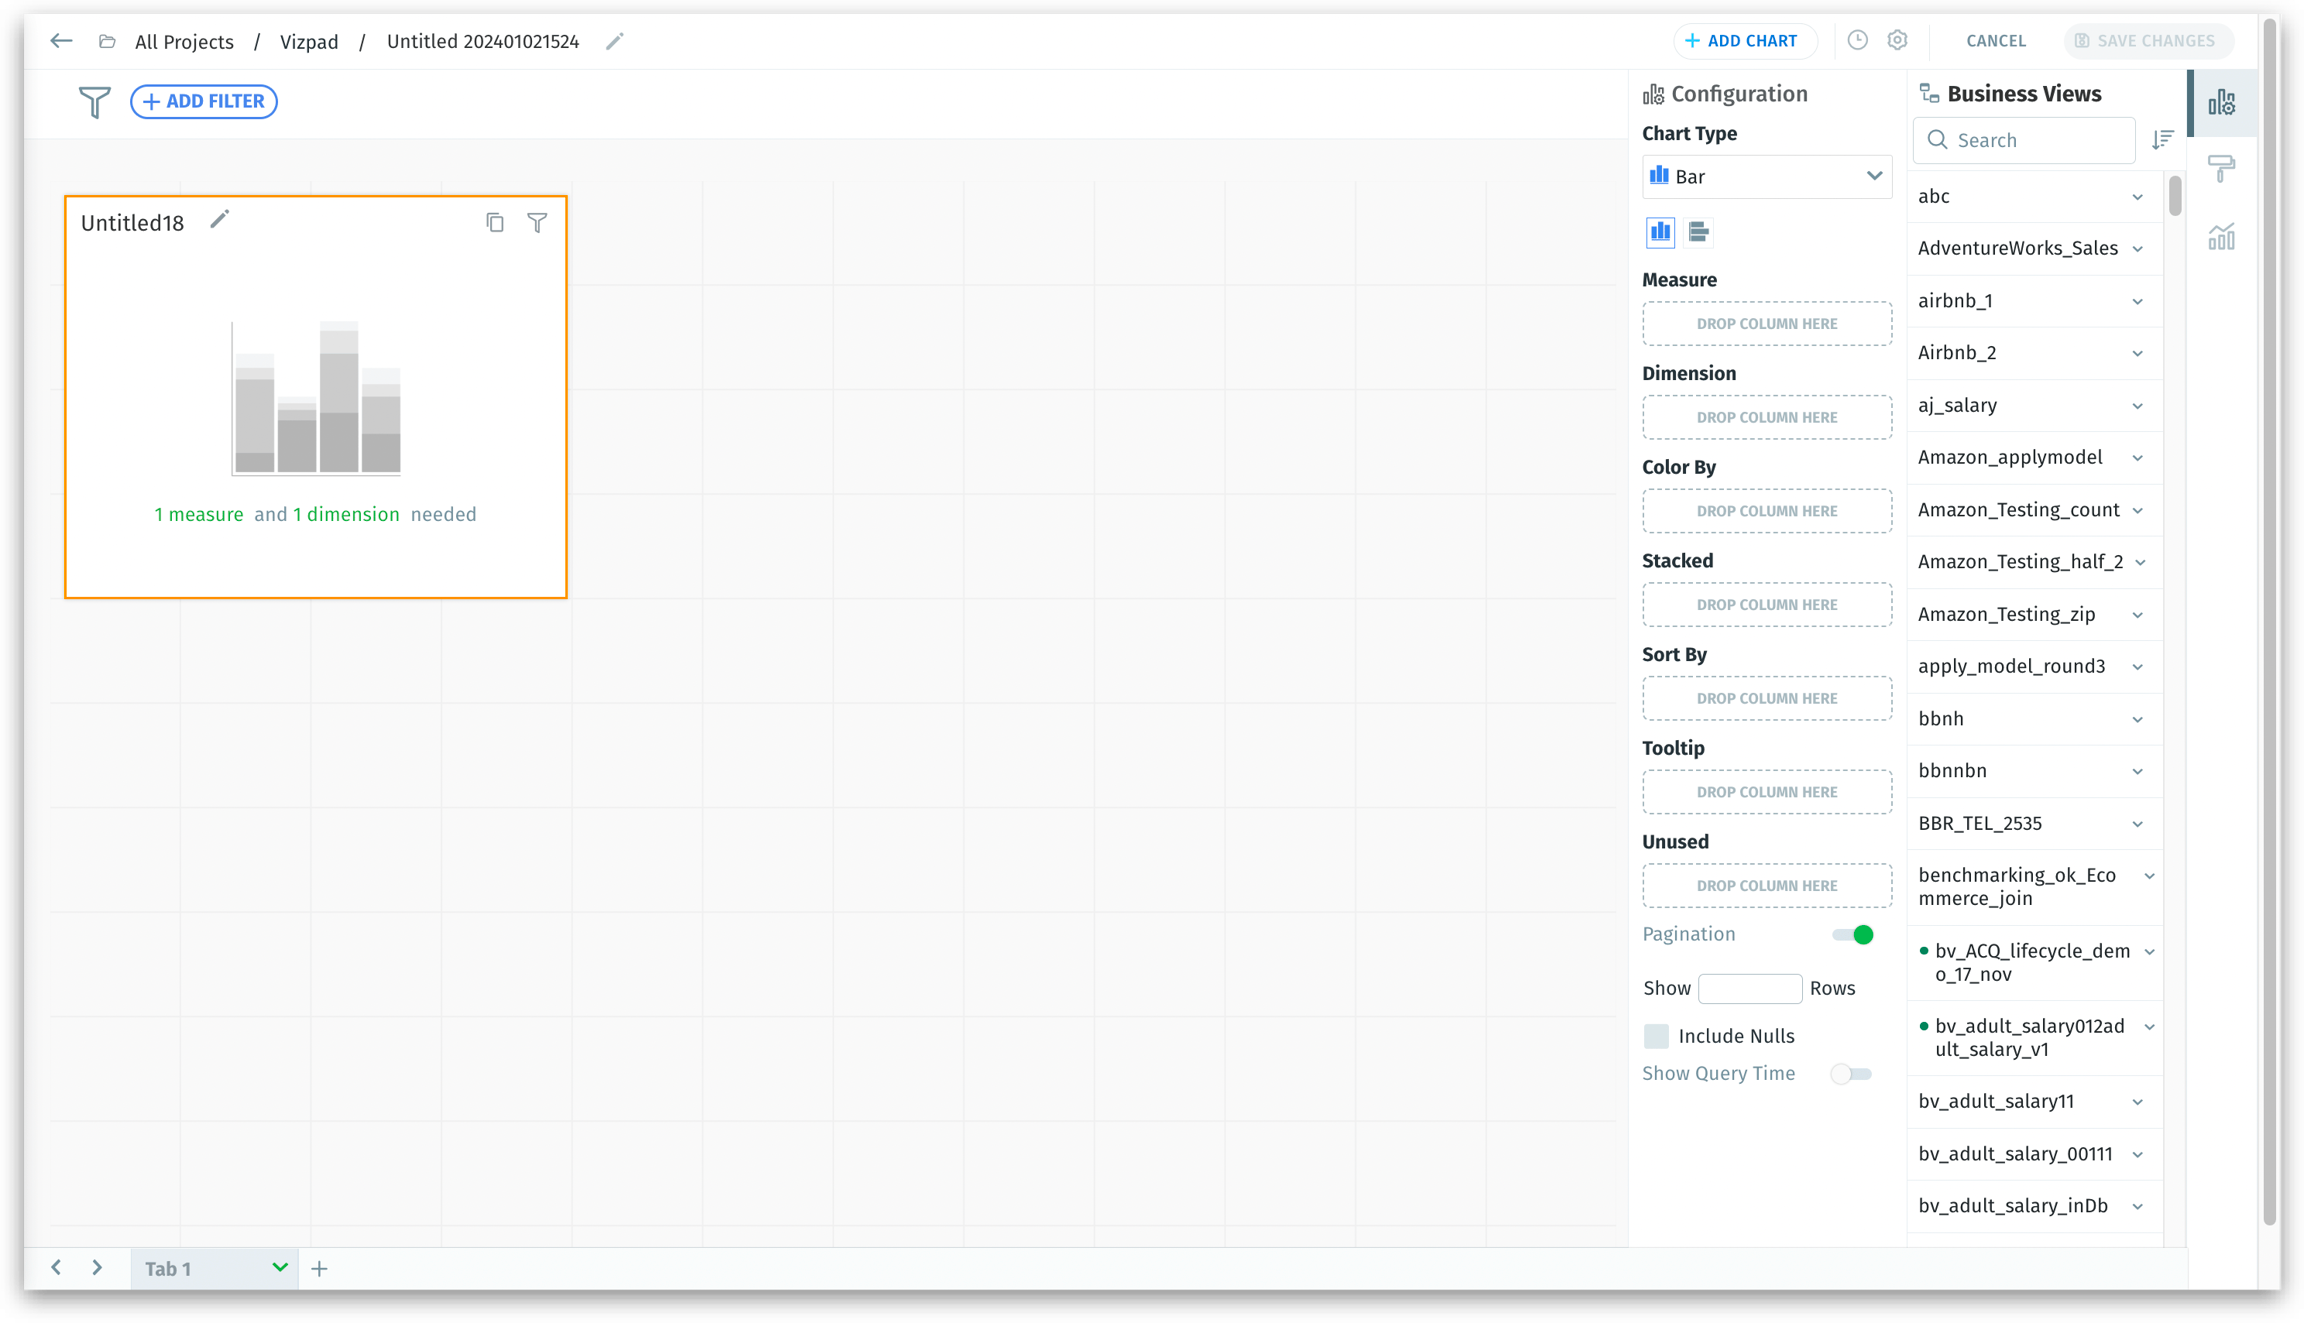
To get familiar with each component in the above screen, check out this page.
Selecting Business Views
Initially, all the existing Business Views on your instance will be available to be selected. These Business Views can be searched and sorted in either ascending or descending order to suit your needs. Click on the expand icon to view the columns of each Business View if required.
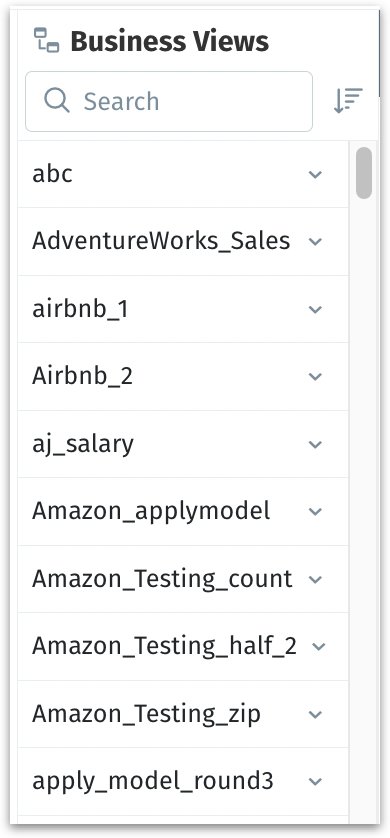
Click on the preferred Business View. It will be expanded to display all the columns.
To incorporate data into your chart, drag and drop (or double-click on) the desired columns and the fields in the Configuration pane will be populated based on your selection.
By default, a bar chart will be created, so double-click on a measure and dimension in the selected Business View to build the first chart.
As you start building the chart, the primary Business View will become the default Business View indicated by a ⭐ next to its name. It will become a part of the Active BVs section.
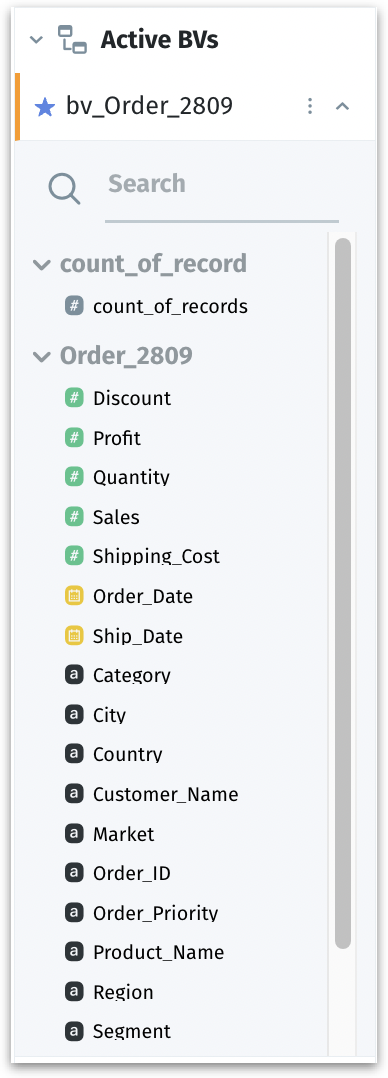
The remaining Business Views will be temporarily disabled and grouped under Other BVs. This section will be enabled when a new chart is added.
If you need to add columns from another Business View:
Remove the existing columns (measures and dimensions) of the current Business View.
All the Business Views get enabled.
Select the required Business View, drag and drop the required columns to the fields in the Configuration pane.
Adding a new chart
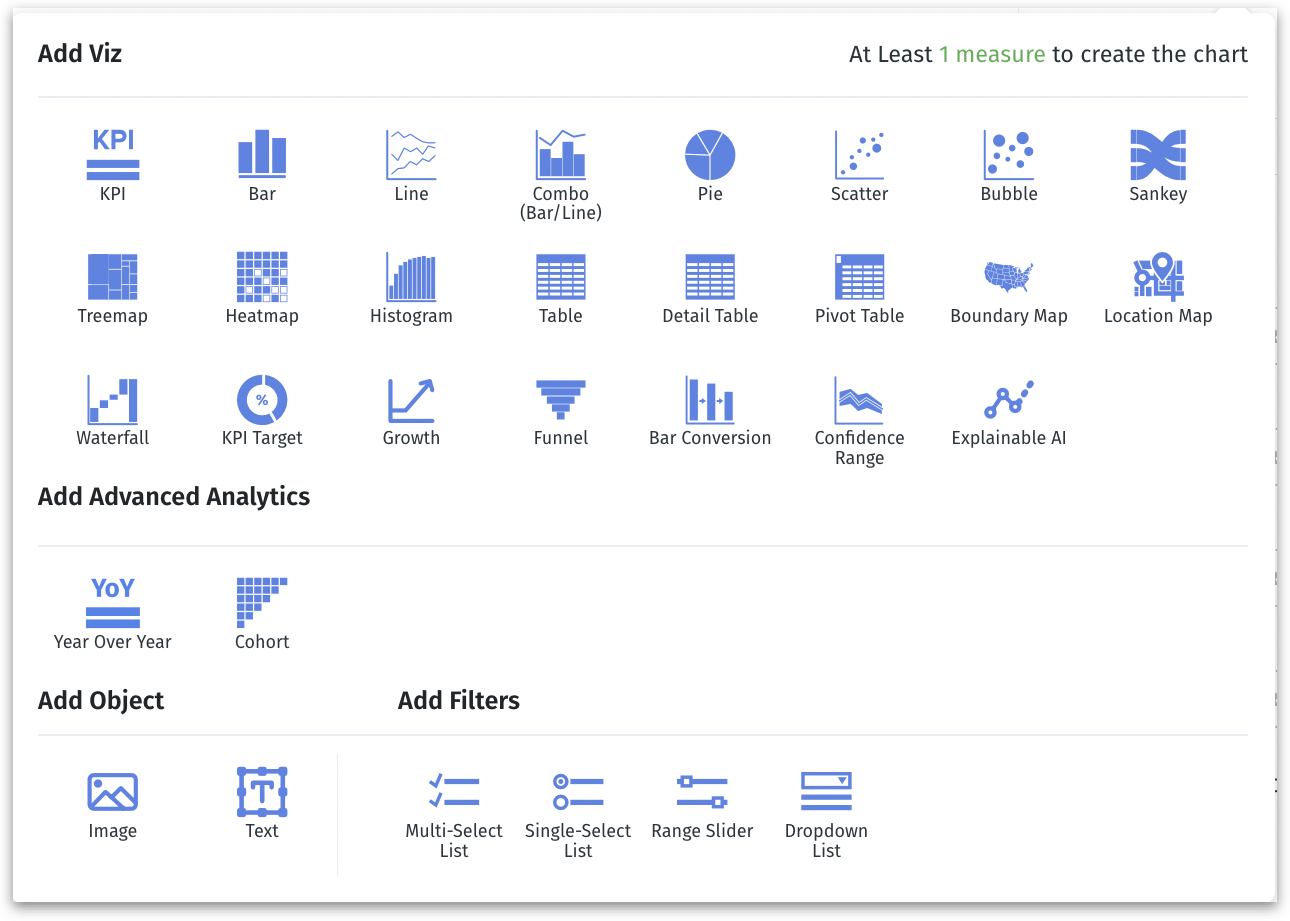
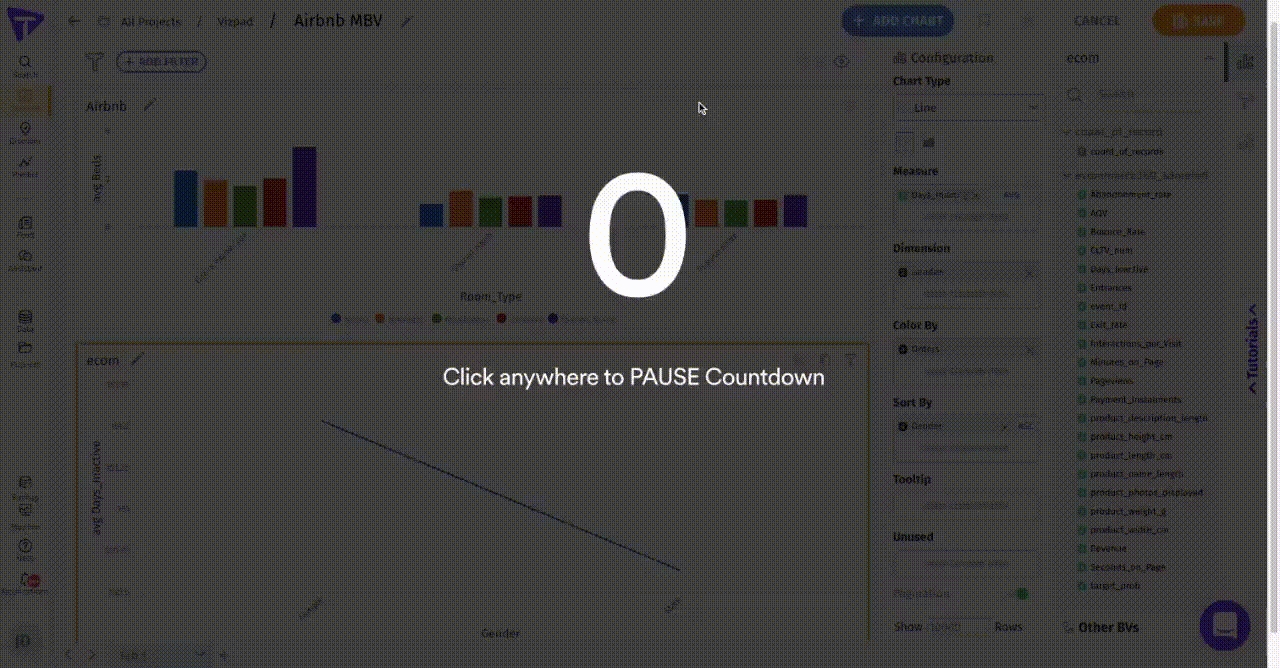
Click on Add chart to include additional charts to the current Vizpad.
A Vizpad can hold a maximum of 10 tabs. Each tab can hold a maximum of 25 Viz, but any number of control filters, text, and image Viz.
The list of available charts will be displayed. It contains a list of standard charts and advanced charts. For detailed guidance on each chart type, optimal usage scenarios, and understanding subtle differences between similar charts, check out this section.
Adding objects
In addition to charts, you can also add objects (text and images) and control filters.
Text Viz allows you to provide context, explanations, or annotations, enhancing the comprehensibility of your data visualizations. Including images can help with visual storytelling, making complex data more engaging.
Click on Image to include a Viz where you can upload an image from your system.
Click on Text to include a Viz and a comprehensive text editor will be displayed. Here, you can add text content and apply formatting to the text.
Adding control filters
Control filters enhance the interactivity and personalization of your Vizpad. Each control filter you apply affects all charts within the specific Vizpad. This ensures a unified view of the data across different charts.
Click on the required control filter. This can be switched to another type by choosing from the dropdown menu in the right pane.
Drag and drop (or double-click on) the desired column and the available values in the control filter will be automatically populated. For more details on control filters, check out this page.
Applying filters
There are two types of filters in Vizpads:
Global filter
Use the global filter (Add Filter button) to apply filter to more than one chart in a Vizpad.
For applying global filters on multi-Business View Vizpads, check out this page.
For applying global filters using columns from multiple Business Views, check out this page.
Local filter
Use the local filter (filter icon) in a chart to apply filter for one specific chart.
For more details on applying local filters, check out this page.
Interacting with charts
In Vizpads, interacting with individual charts in both View and Edit modes unlocks deeper level of insights, leading to more personalized and precise data analysis.
For interacting with the chart in View mode, check out this page.
For interacting with the chart in Edit mode, check out this page.
Save the Vizpad to a Project
If you click on Save, you will get a list of Projects that consist of the Business Views you have used.
Search for/select the required Project. Select Other to save the Vizpad in a folder other than the ones listed.
If you're editing an existing Vizpad, then clicking on Save will retain the changes made.
Last updated
Was this helpful?