
Release 5.3
Explore what’s new in Tellius 5.3: smarter Kaiya AI, better query chaining, Vizpad upgrades, and advanced Learnings controls.
Released in February, 2025
We're thrilled to unveil Tellius 5.3! 🎉 In this release, we’ve introduced major updates to Kaiya, our conversational AI for analytics, to address the real challenges data teams face every day. Whether you’re struggling to navigate complex datasets, deal with time-consuming multi-step queries, or align terminology across your organization, these updates are designed to simplify workflows and deliver insights faster. Here are the key updates:
Take out the guesswork: With SmartSelect, Kaiya automatically chooses the most relevant Business View for your query. Additionally, metadata queries help you discover and understand available metrics and dimensions without diving into documentation.
Crush complexity: Kaiya can now handle compound, multi-step queries, breaking down intricate requests and delivering actionable insights in one go.
Scale curated Learnings: With Learnings Management, Kaiya allows you to define and share custom terms, metrics, and queries, ensuring alignment and consistency across your organization.
Dive into the release notes below to see how these updates solve real-world problems and elevate your analytics experience.
🚀 New features
1. Ask about your metadata to Kaiya
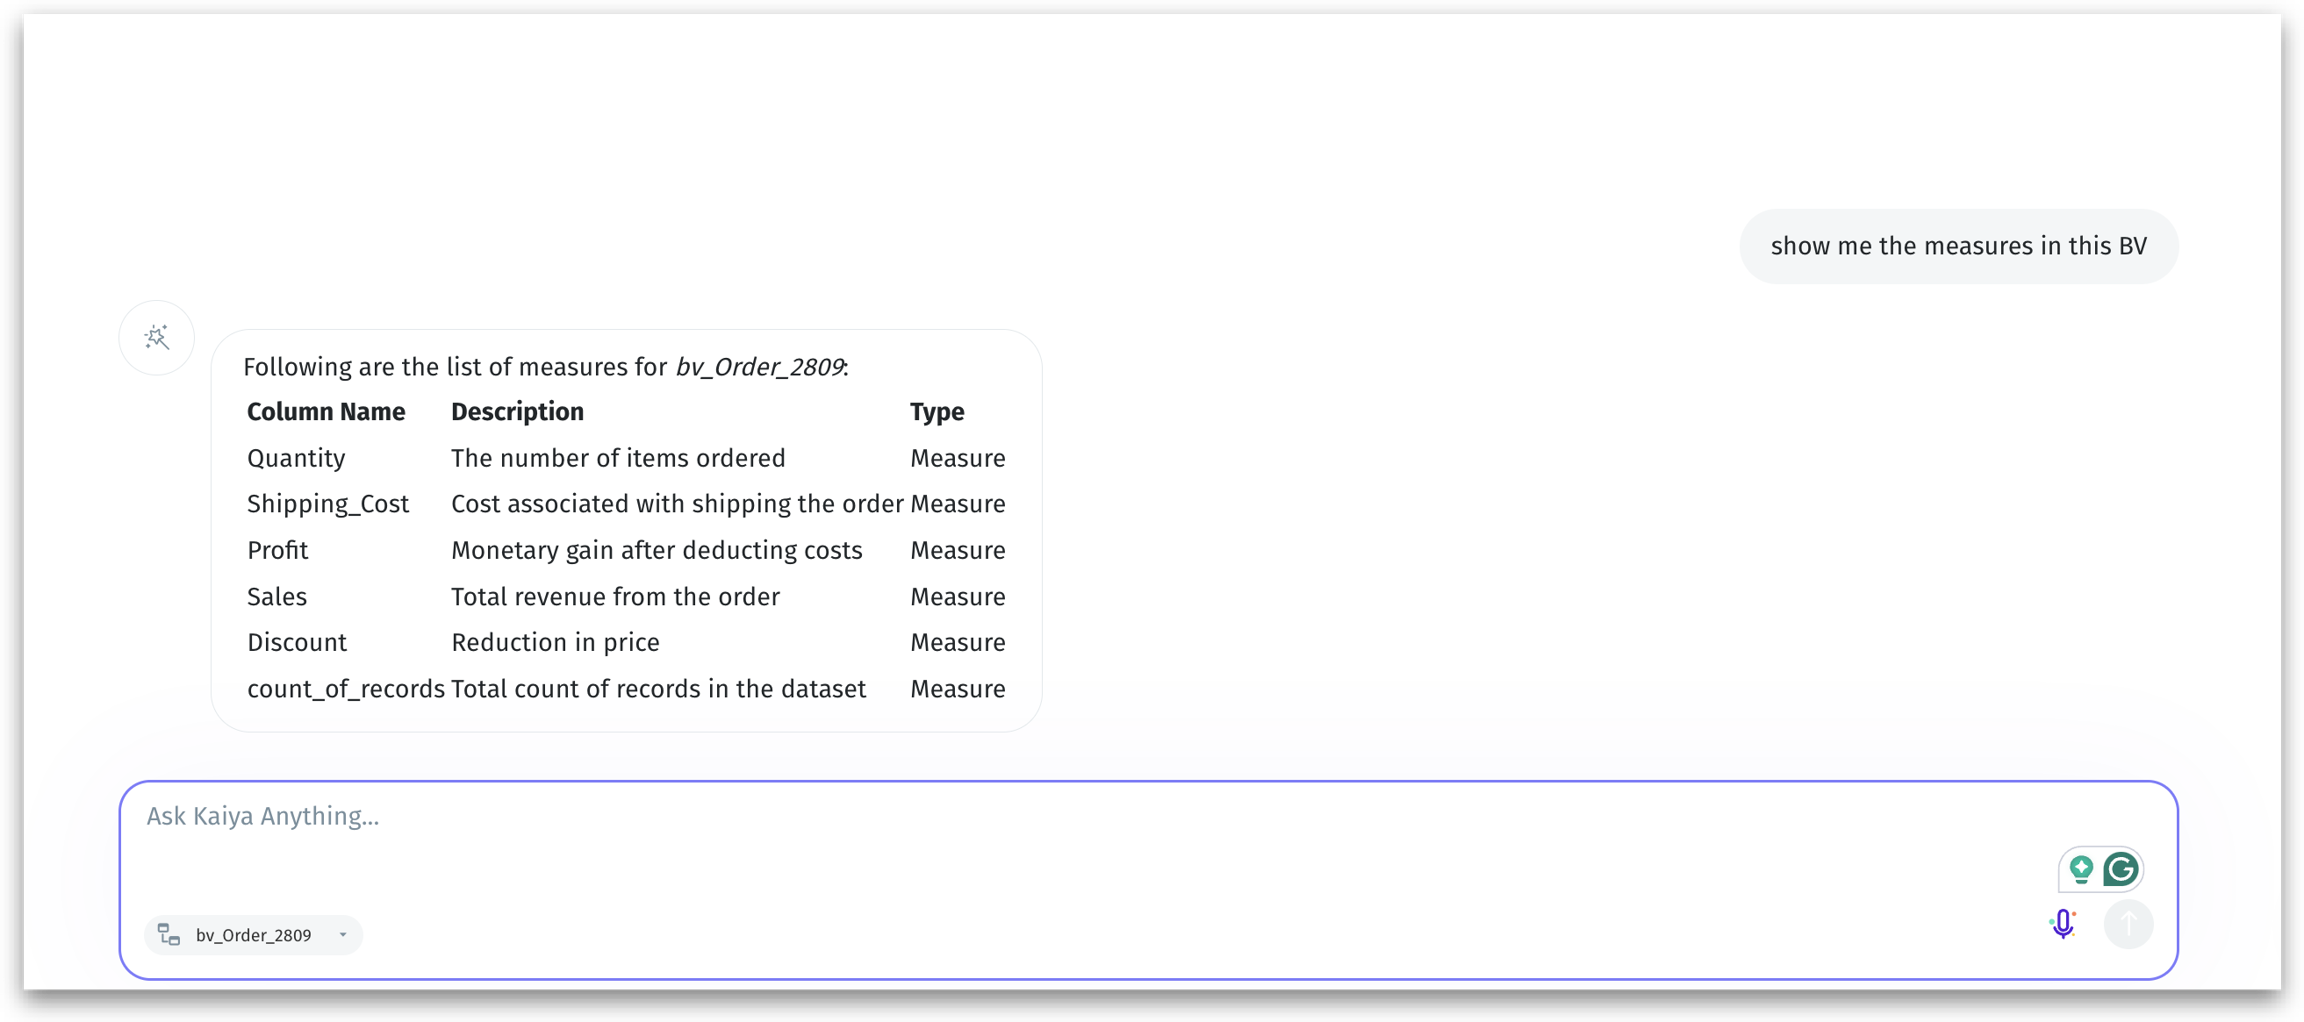
We’ve introduced metadata queries in Kaiya conversational Search to help you quickly discover, understand, and leverage the right datasets before diving into any complex analysis. By allowing natural-language questions around metadata (e.g., field definitions, calculated columns, date fields), we’re bridging the gap between technical detail and business relevance. With this, you can simply ask questions like,
“What are the dimension columns in this BV?”
“Is there any calculated column available?”
“How is the subscription rate calculated?”
“Which of these columns relate to orders?”
and Kaiya will respond in plain language, clarifying exactly which fields exist in your chosen Business View.
Quickly find out if any relevant calculated columns or date fields already exist for your analysis. For instance, you can ask, “I want to calculate the revenue due to laptops. What metrics are available related to it?” and Kaiya will list out all relevant product and revenue columns.
It facilitates faster data discovery—eliminating guesswork by understanding the available metrics and dimensions upfront, reducing back-and-forth between data teams and business users. Also, business users can get a grasp of technical fields in their own language, without digging through technical documentation.
2. Kaiya selects your Business View so you don’t have to
With Kaiya’s SmartSelect (automatic selection of relevant Business View), you no longer need to manually select a Business View before typing in a query; Kaiya smartly chooses the most relevant one. Kaiya will parse your query, identify key columns and filters, and then use a combination of LLMs (Large Language Models) and vector database to find the best-matching Business View (BV). If the chosen BV is incorrect, you can manually correct and provide explicit feedback so Kaiya learns for future queries.
The more you use, the more accurately Kaiya selects the appropriate BV. By automating the selection process, you can focus more on obtaining insights without worrying about the underlying BVs. It learns from your feedback and adapts to your preferences over time. You can directly teach Kaiya by making manual selections or corrections.
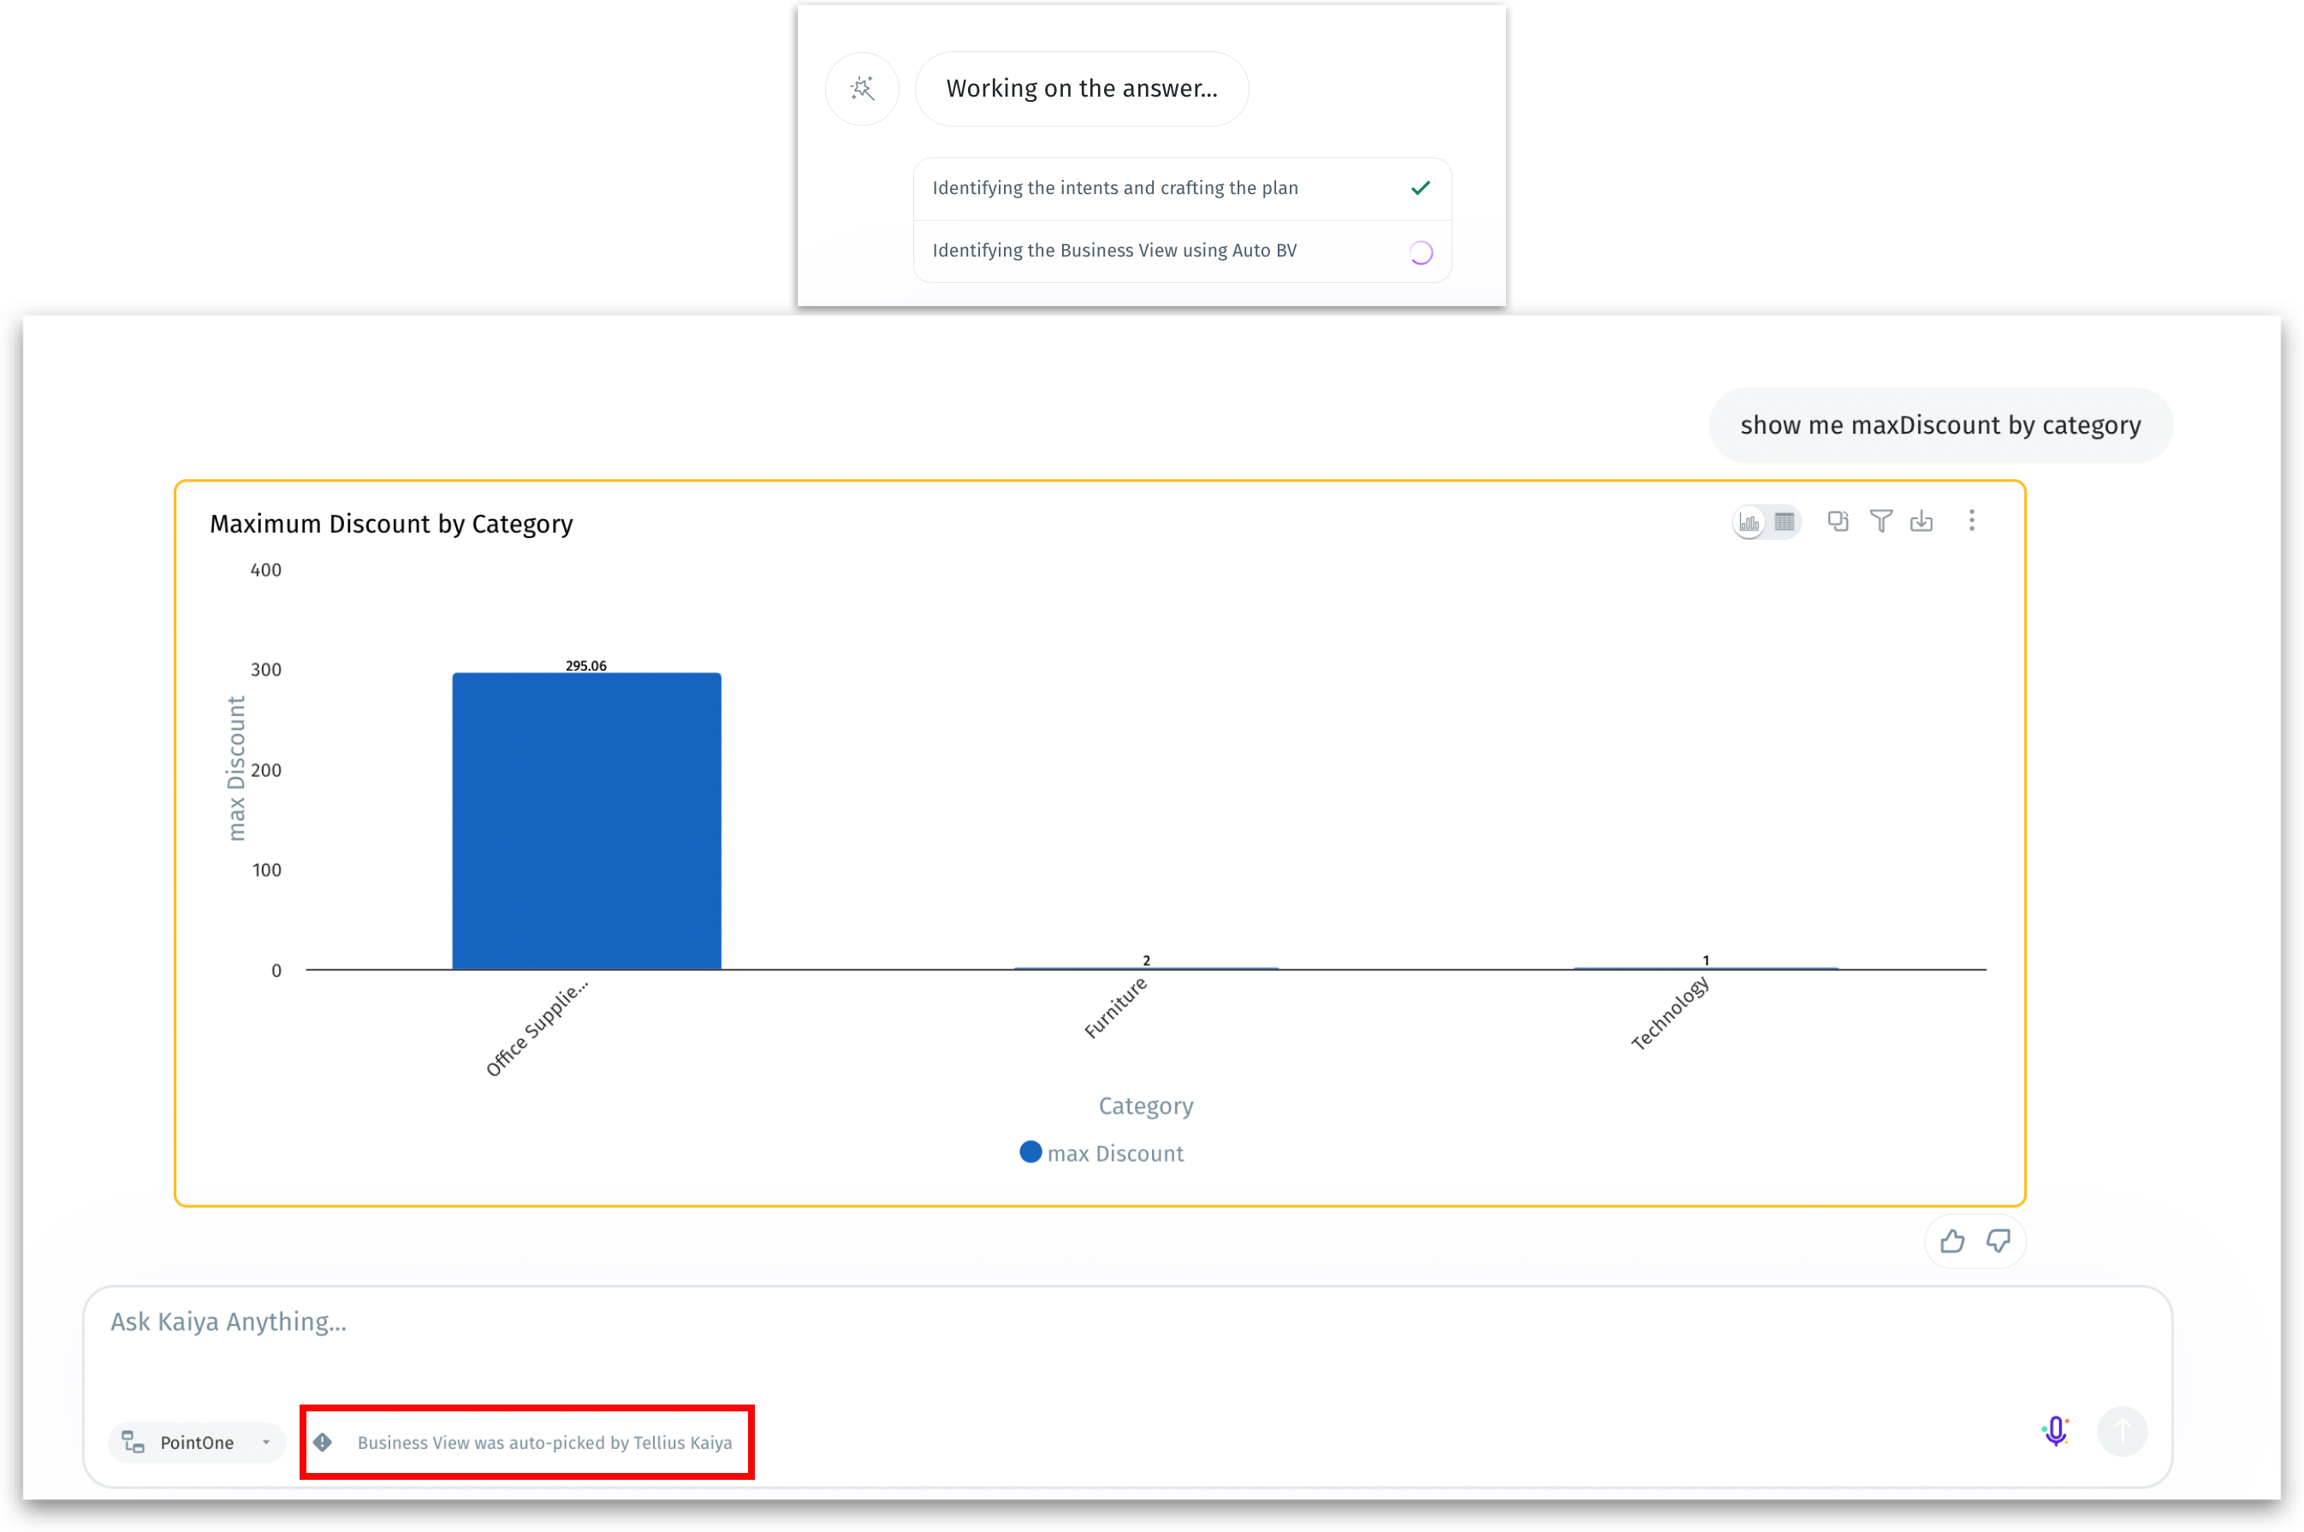
For example, if Kaiya picks an incorrect BV, you can select the right one from a dropdown. A prompt will let you store that change as a Learning. Kaiya remembers these corrections for similar queries in the future.
Business users no longer have to scroll through a list of BVs to find the right one. Every correction or confirmation feeds into a feedback loop, so Tellius steadily refines its understanding of your data structures and language preferences.
3. Efficiently manage your Kaiya Learnings
We’re introducing a management system that lets you easily create, edit, and manage the Learnings, which guide Kaiya in translating your questions more effectively—giving you and your organization more accurate and personalized responses. With continuous learning, Kaiya becomes an even more intuitive tool for your organization. No more repeated misunderstandings—just smarter, faster, and more personalized insights!
For example, a non-technical user sets “my region” = [List of their specific regions] for the “Revenue_BV” only, so every time they say “my region,” Kaiya filters it to their subset.
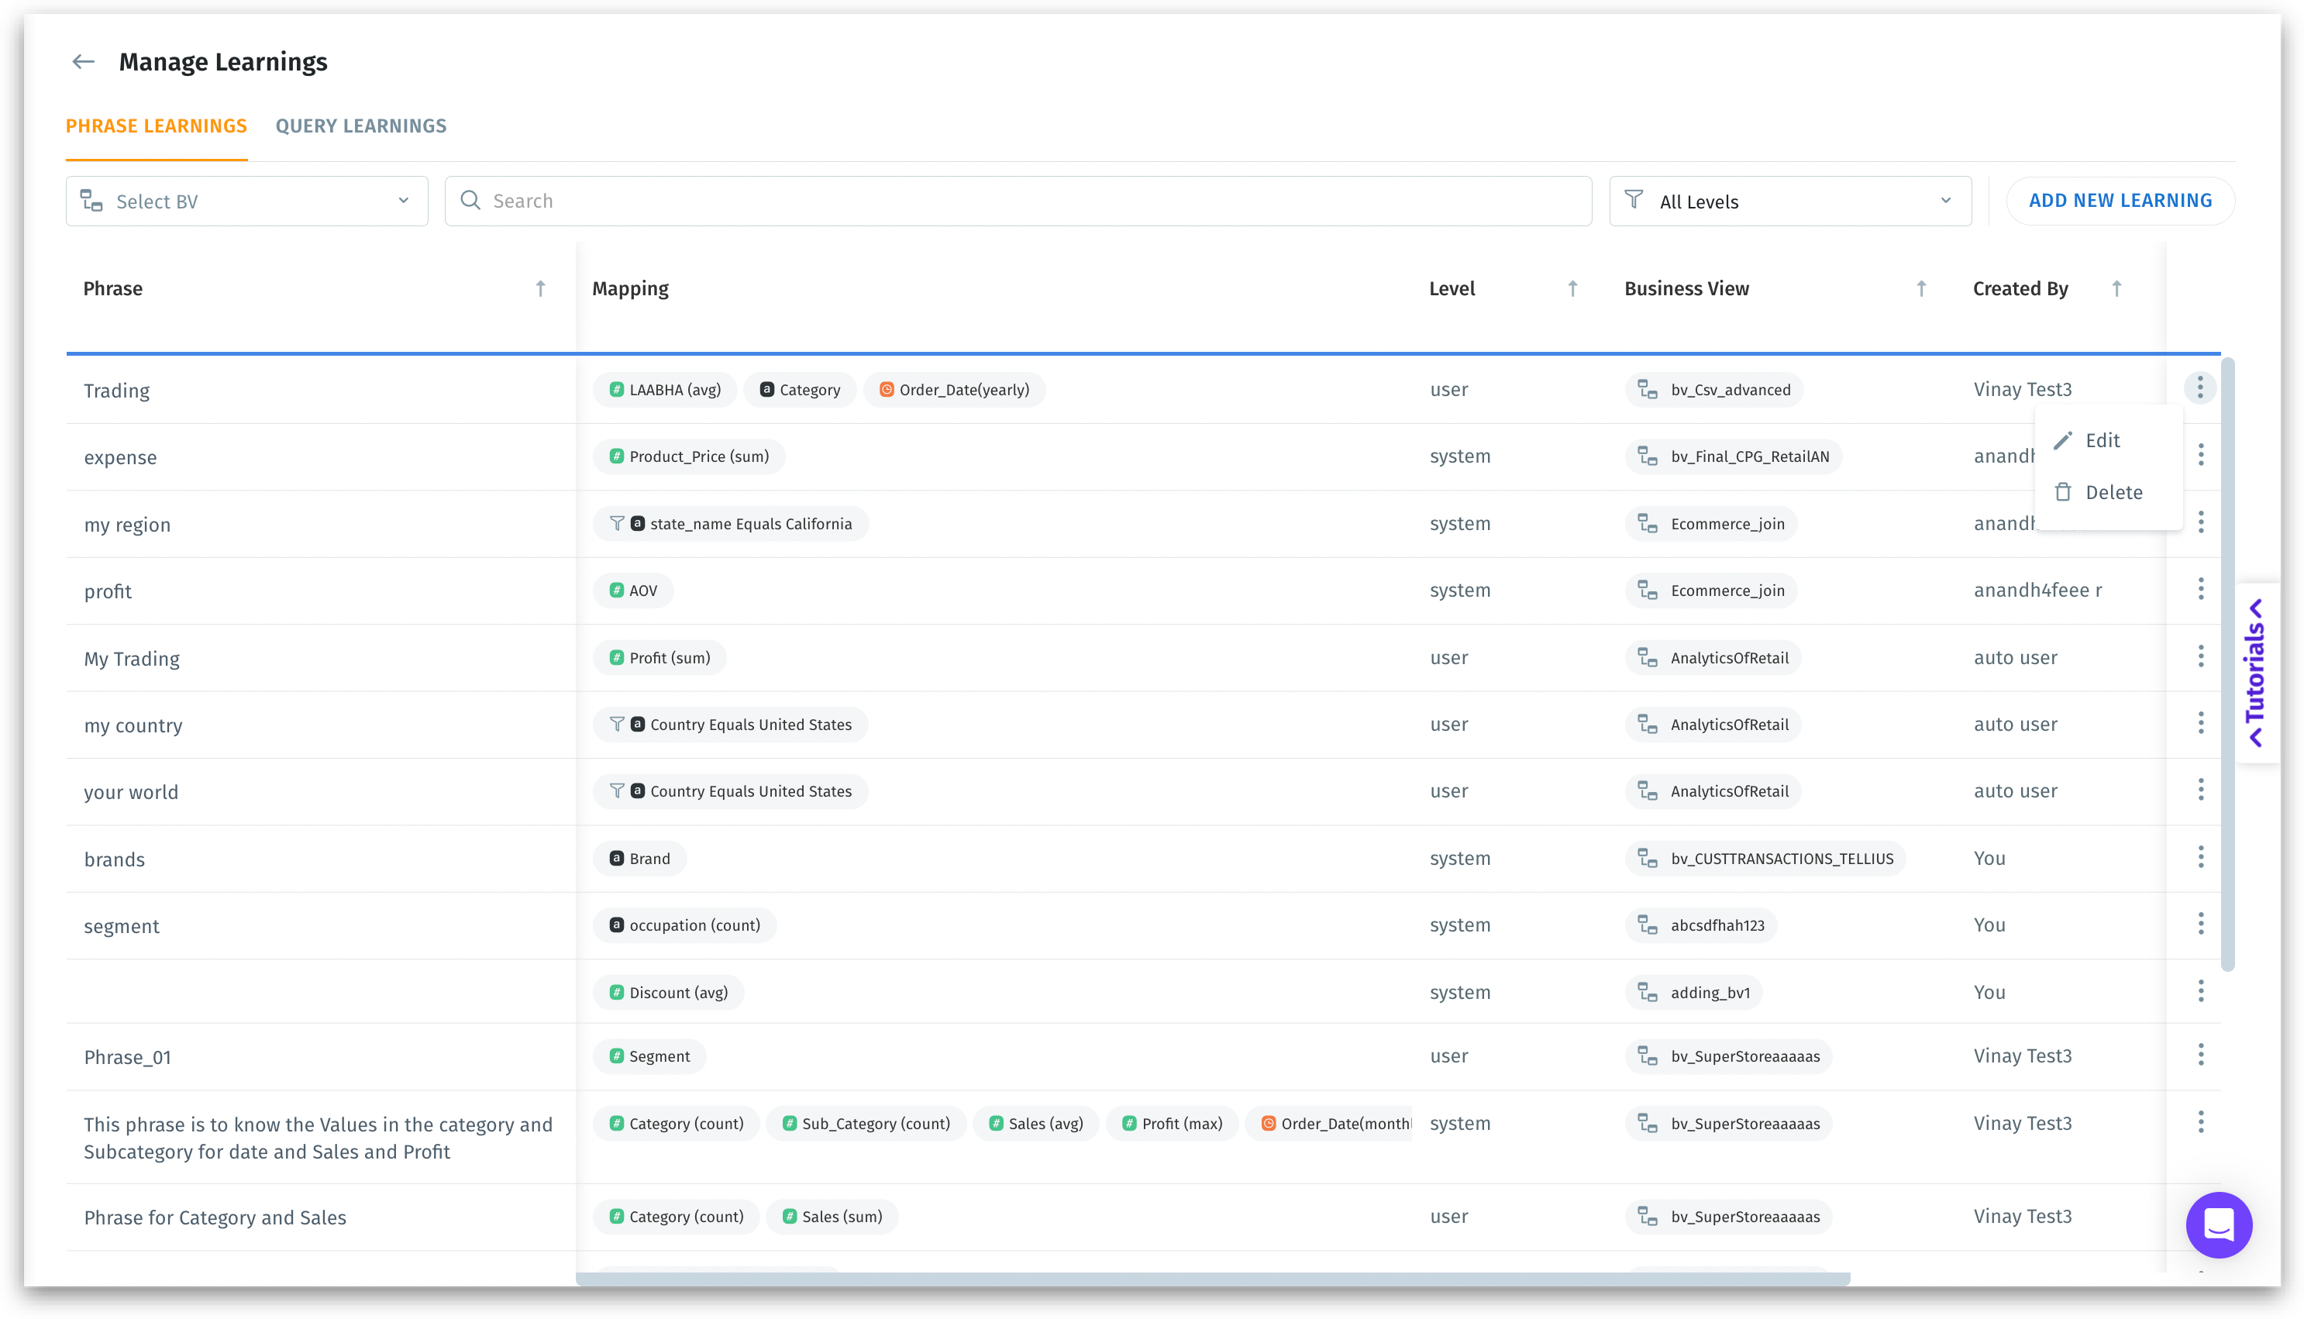
Introducing multiple levels of Learnings:
User-specific Learnings:
User + Business View (BV): A single user’s learning, limited to a specific BV.
User + All BVs: A single user’s learning, applied across every all BVs.
System-specific Learnings:
System + BV: Admin-created Learning for all users, but only for a specific BV.
System + All BVs: Admin-created Learning for everyone, across all BVs.
This layered approach lets you keep certain terms or mappings strictly personal, while admins can promote valuable user learnings to broader visibility.
User-level learnings override admin-level if there’s a direct conflict.
Query Learnings (for admins only) lets you define entire query structures (e.g., “Show me days inactive for my brand in NY”) to match domain-specific patterns. Particularly useful for organizations with unique ways of asking questions or proprietary query logic.
Key updates:
During a Kaiya session, if you correct or refine a misinterpreted query, that feedback can be saved as a personal or system-wide Learning (based on your role).
No need to repeatedly fix the same misunderstandings—once a Learning is saved, Kaiya remembers it for all future queries.
When you add a new Learning that’s similar to an existing one, Tellius will warn you and offer to merge or override.
4. Kaiya can handle your complex questions
Kaiya can now handle compound, multi-step questions. Instead of limiting you to straightforward “one-and-done” queries, Kaiya now interprets and executes multiple logical steps to get more meaningful, real-world answers (e.g., comparing region performance to a national average, then drilling into underperforming segments).
Kaiya can split a complex question into multiple sub-queries (e.g., calculate the average or benchmark in one step, then filter or compare in the next). For example, a question like “Which territories are underperforming compared to the East region’s NBRx over the last 3 weeks?” gets broken into
Finds % change in NBRx for the East region.
Compares territories to that benchmark to spot underperformance.
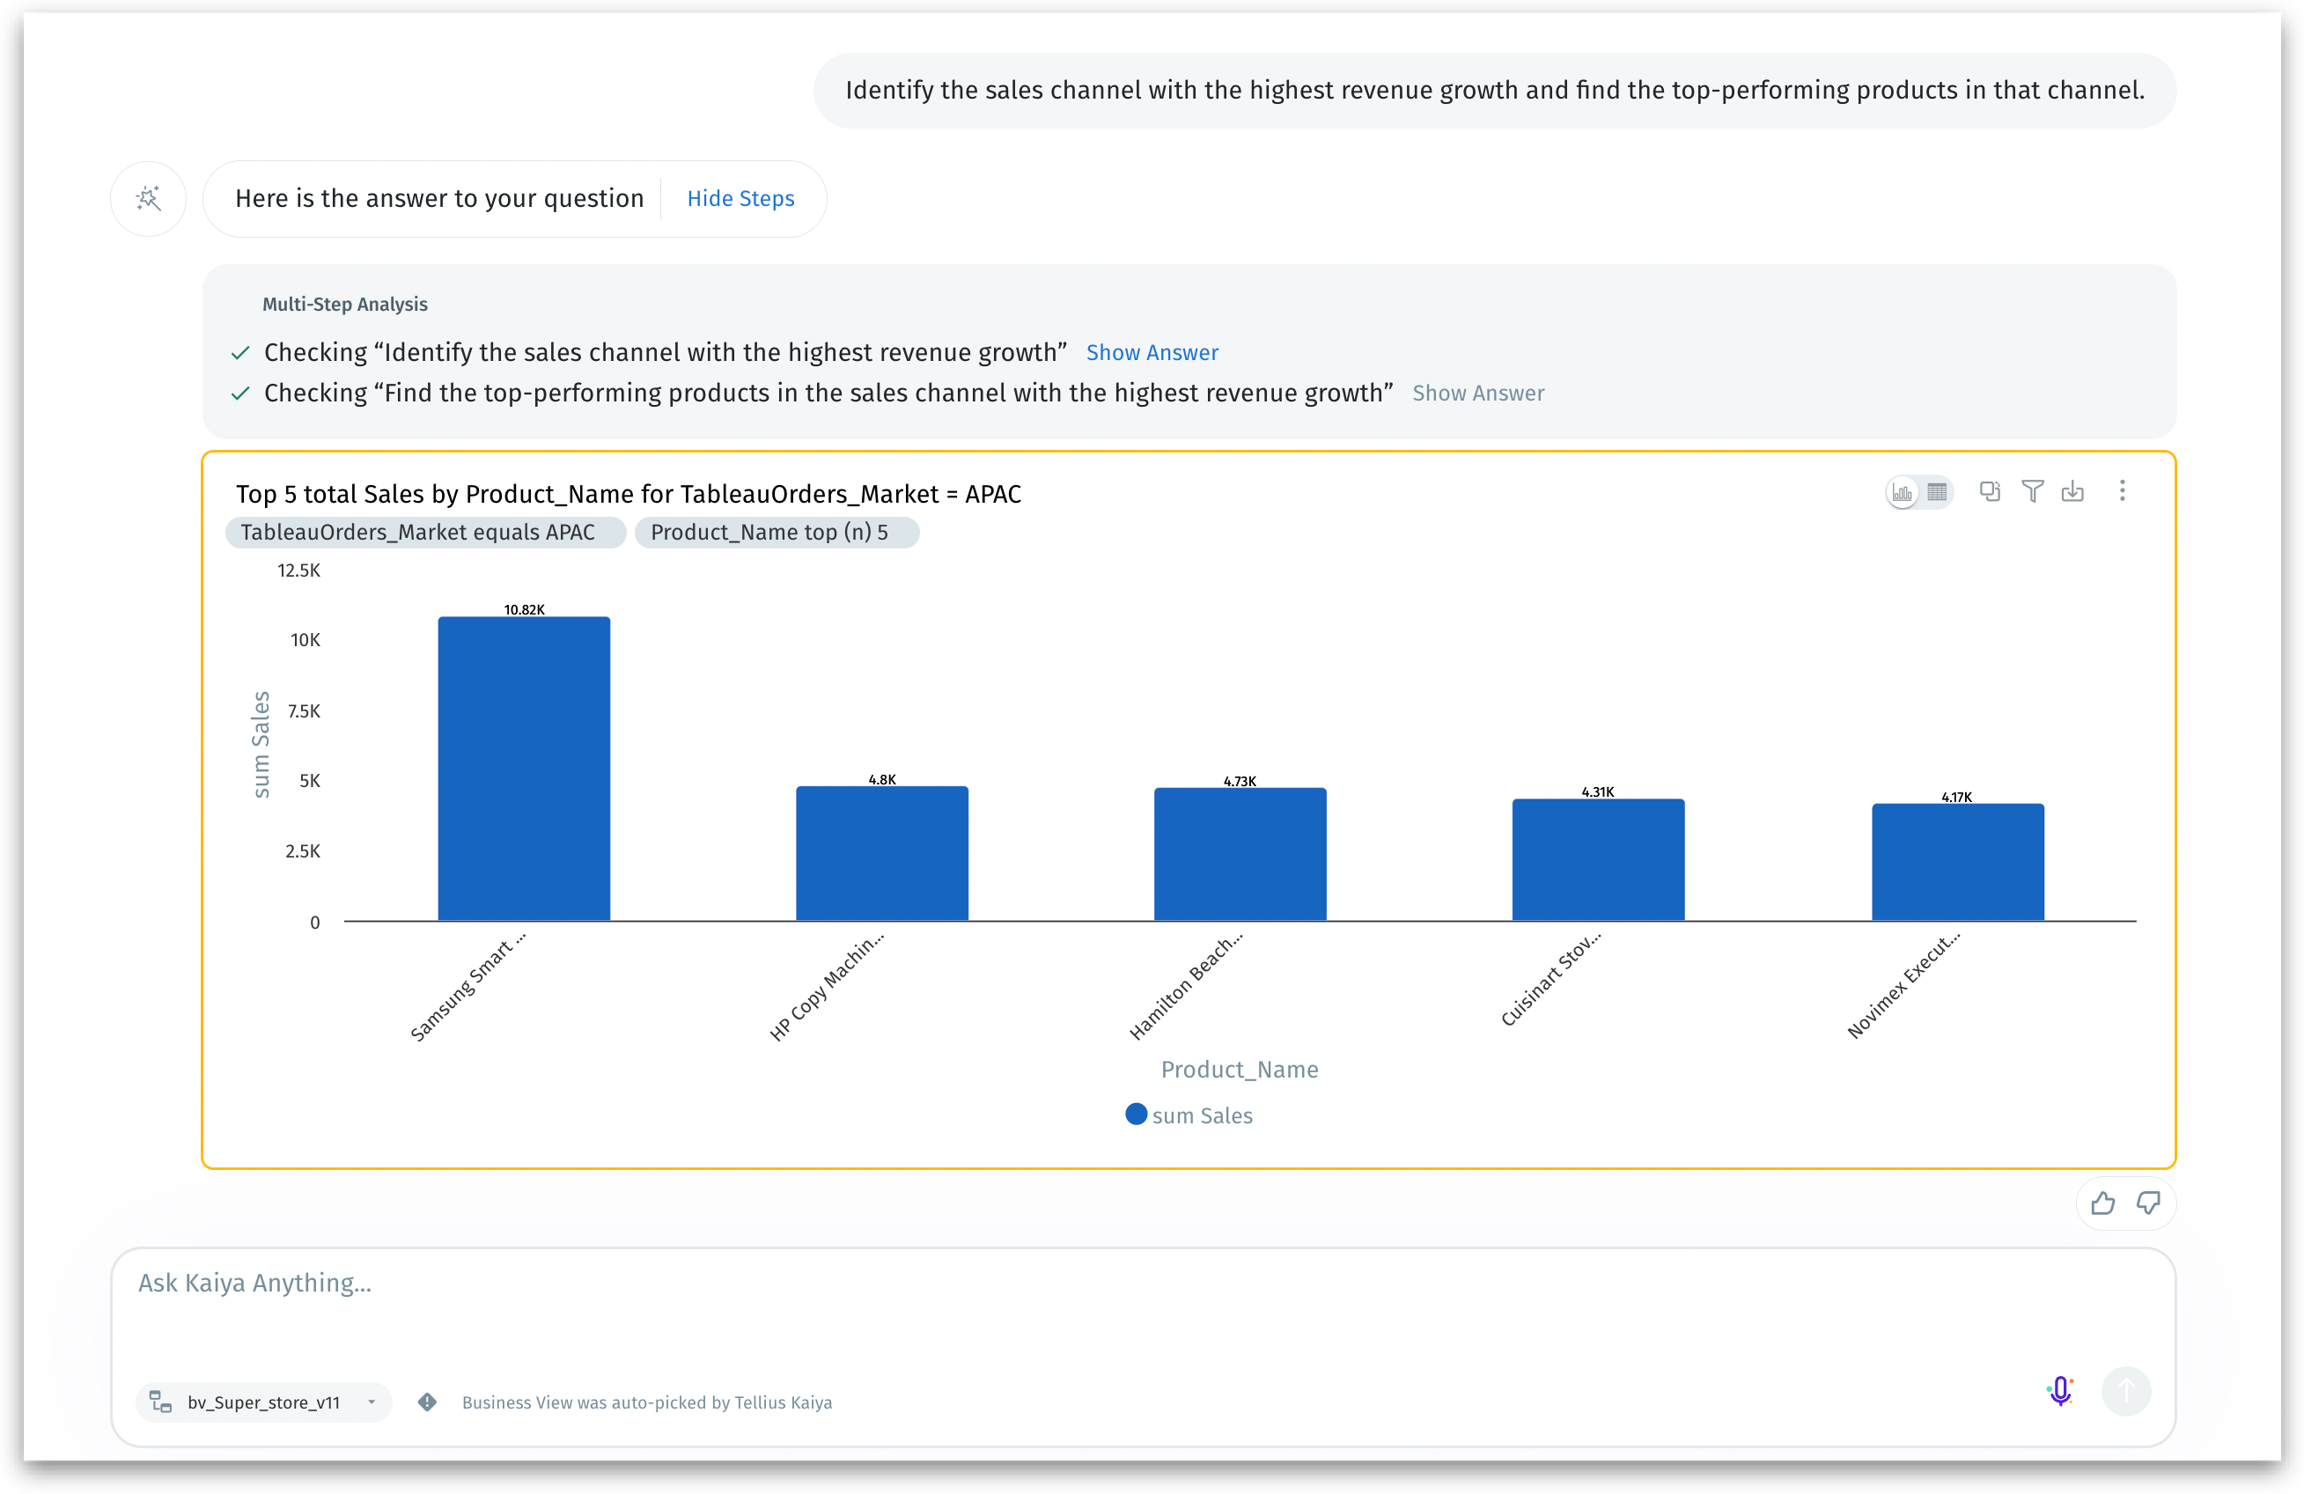
You don’t need special syntax. Just type your complex request in plain language, and Kaiya does the behind-the-scenes heavy lifting—breaking your query down, computing intermediate values, and delivering the final answer in one go.
5. Kaiya eases onboarding with starter questions
Kaiya can now generate starter questions to make your data exploration more intuitive—leading to faster insights with reduced onboarding time. Now, you can kickstart your analysis with relevant, pre-configured prompts—or dive deeper into an existing thread with tailored follow-up queries. By quickly zeroing in on the most relevant beginner steps, you spend less time wondering “What now?” and more time discovering insights.

Based on the Business View selected, Kaiya can automatically generate questions. Before adding to the library. admins can preview the results of Kaiya-generated questions to ensure accuracy and relevance.
Once Kaiya generates a query, you can:
Preview: Opens an adjacent tab displaying the query’s results in real time.
Add Query: Saves the generated query to the starter questions library for future use.
6. Bulk application of configuration changes and filters
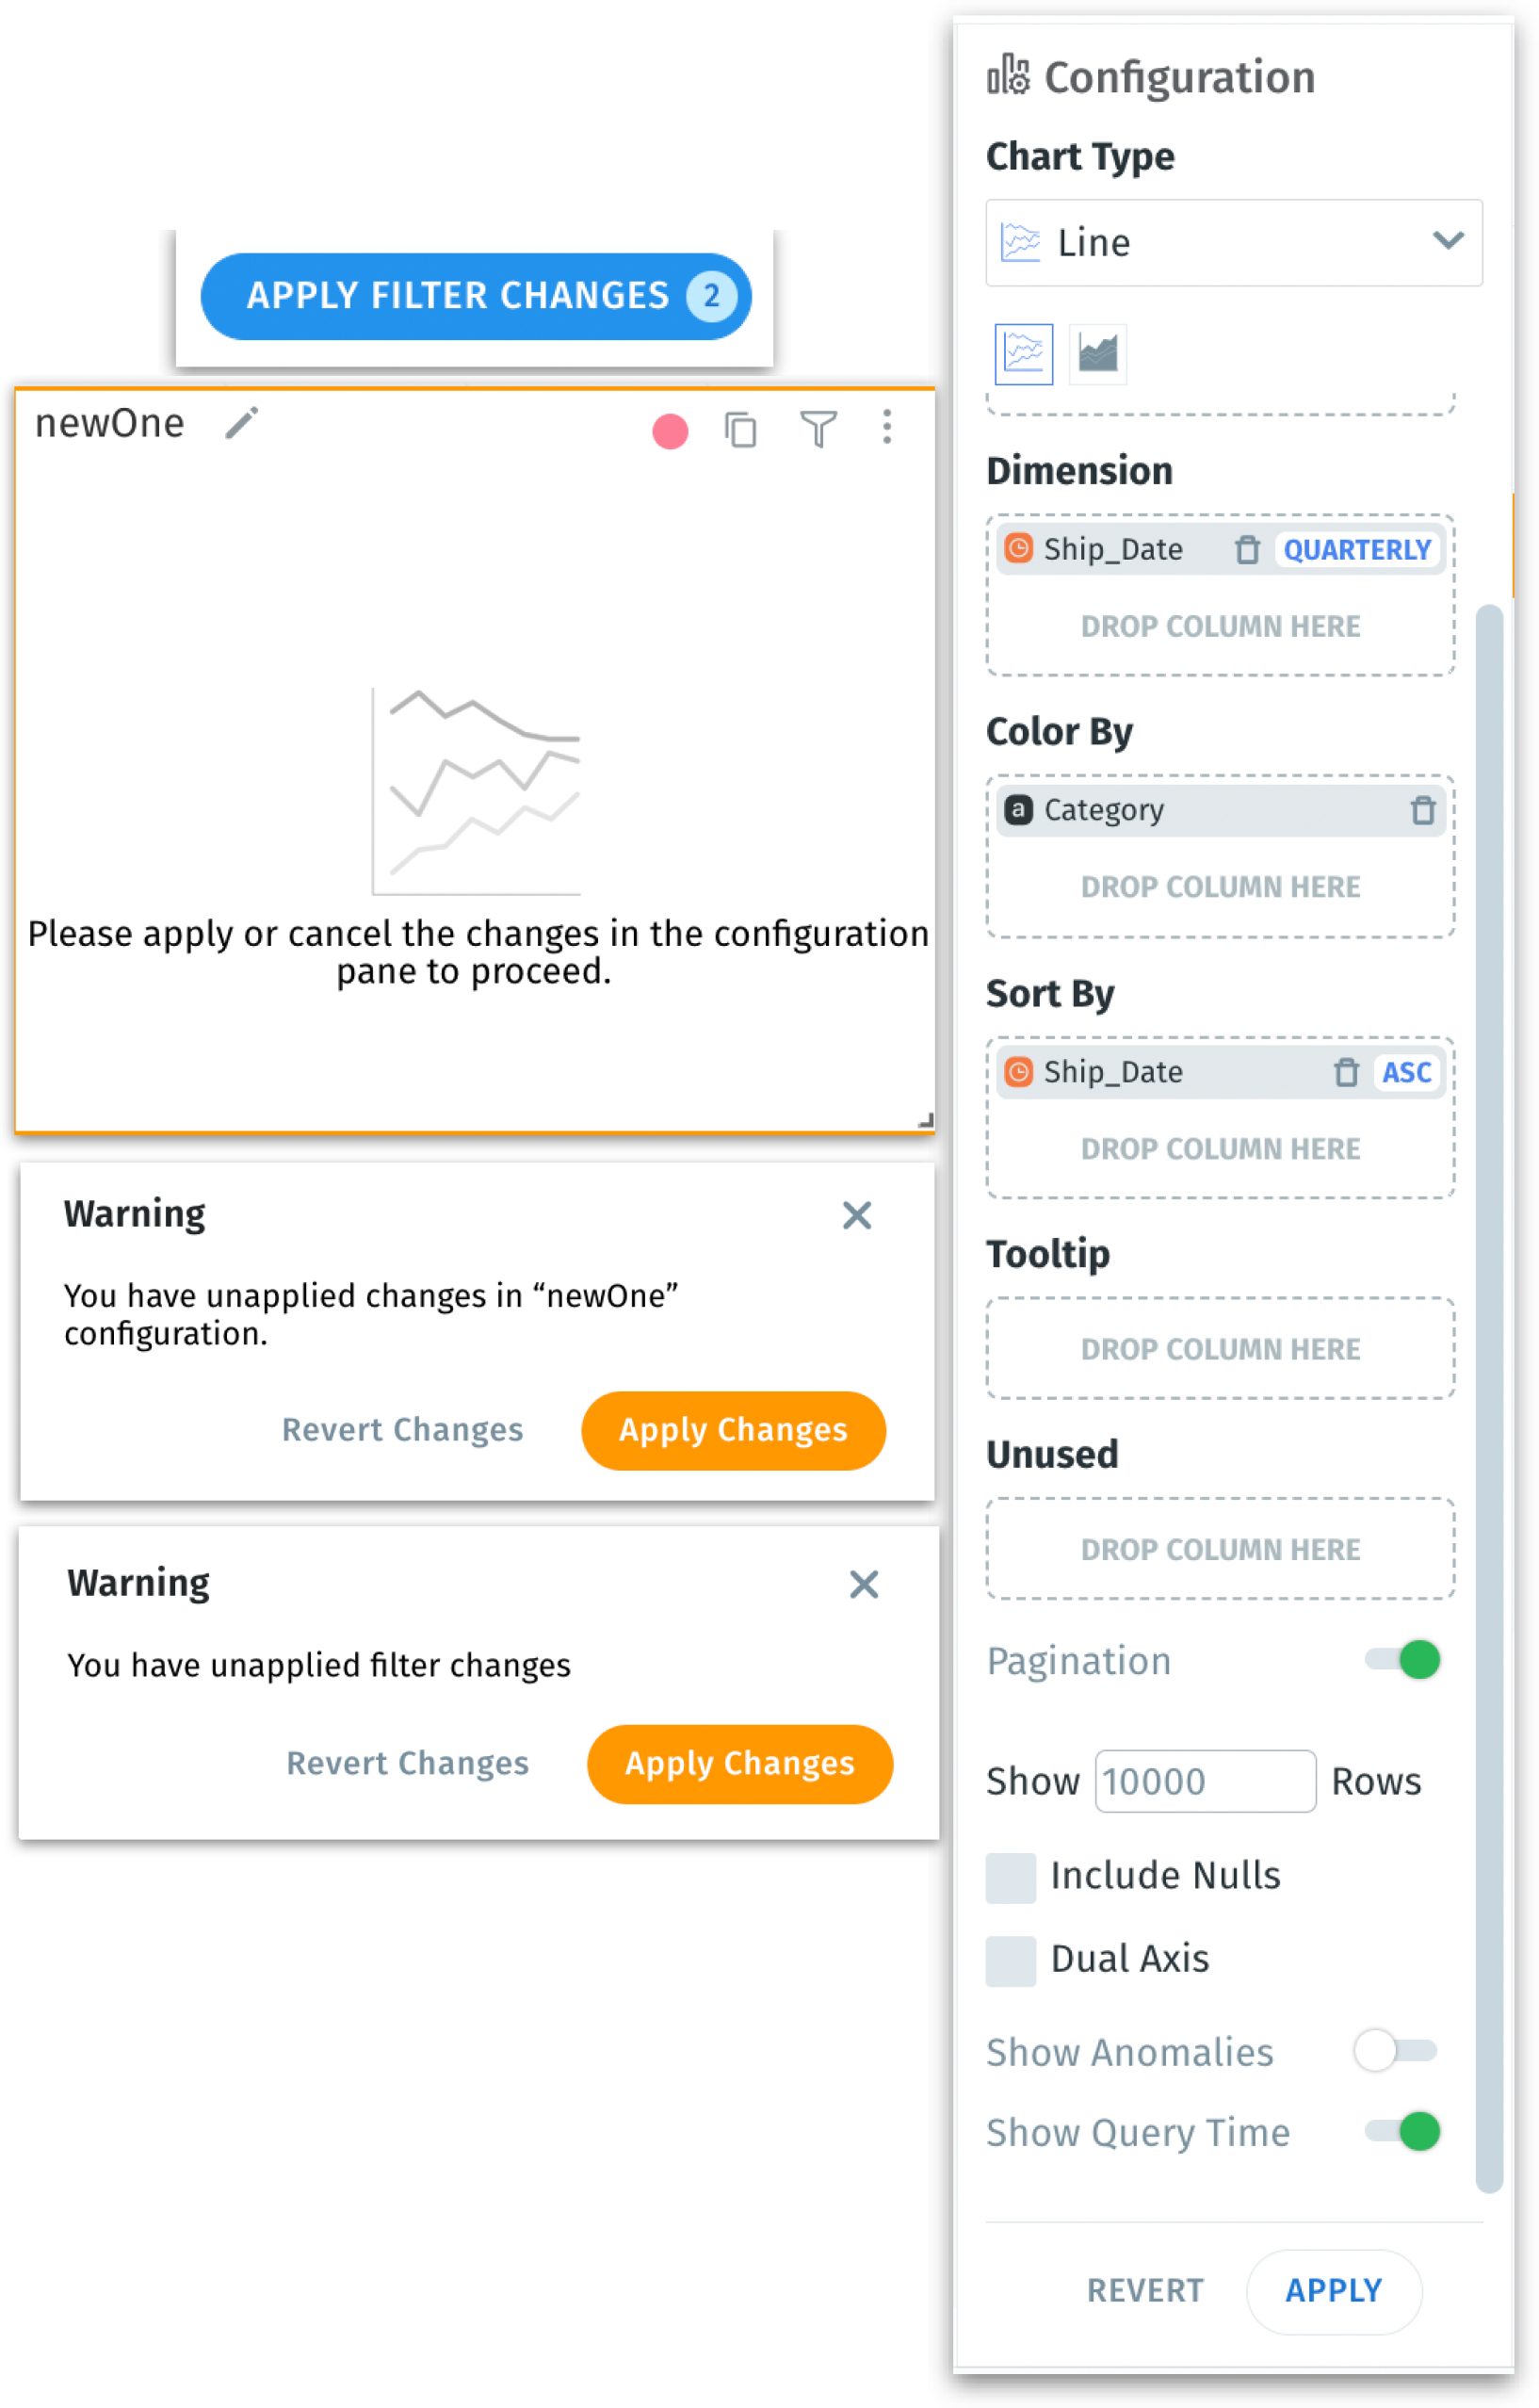
We’ve introduced an Apply and Discard mechanism in the Vizpad configuration pane so you can manage all your edits—like adding columns, changing sort order, or creating filters—at once. Instead of automatically refreshing the chart every time you tweak a field, you can now make multiple changes and then apply them all in one go. This significantly reduces unnecessary query overhead to your database, keeping performance high and costs low, especially for large datasets and live-query scenarios.
You can drag and drop multiple columns, rearrange columns, or add multiple filters, then click Apply to update the chart in one go. Any changes in the chart configuration or filter settings remain in a temporary state until you choose Apply. Selecting Discard will revert everything back to the last saved setup.
Fewer round-trips to the database mean lower cloud data warehouse costs and faster response times, since you’re not firing off a query for every minor edit.
You can’t move to another chart, apply filters, or save the Vizpad until you Apply or Discard your current changes. Also, you cannot apply a new filter if you have unsaved chart edits, ensuring everything stays in sync.
By consolidating multiple updates into a single action, this new feature offers more control over your edits and helps maintain a seamless editing experience.
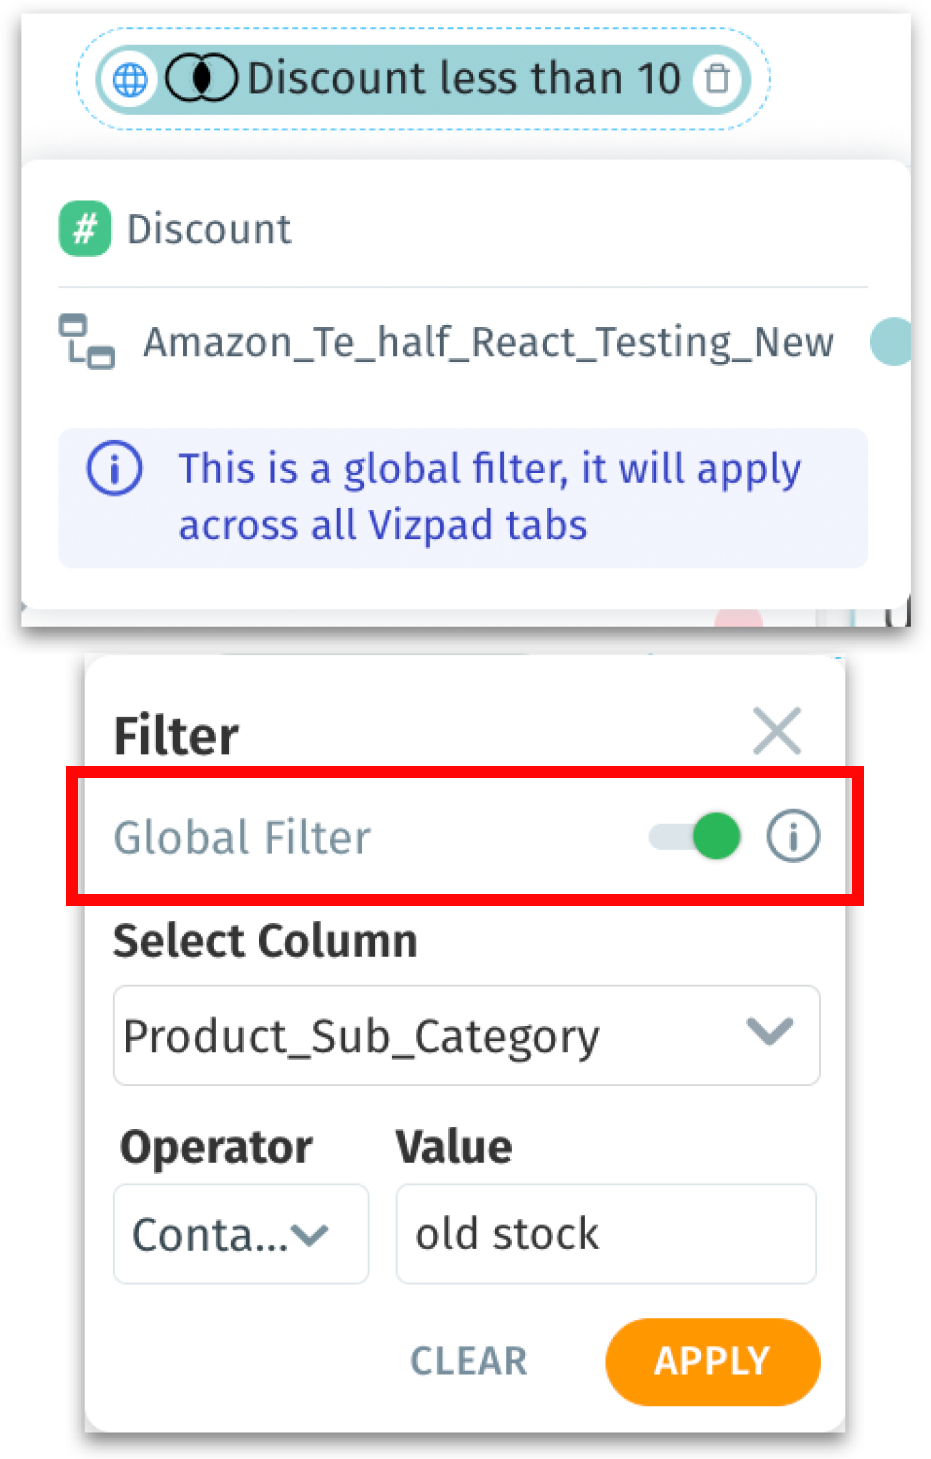
7. Global filters across tabs for Vizpads
We’ve upgraded global filters so that you can now apply filters to all the tabs in your Vizpad.
This is especially helpful for users who want consistent filters across multiple views, such as executives comparing all-year performance or operations managers needing to lock in a specific region.
Our existing “Global Filters” remain, but are now relabeled as “Tab Filters”, reflecting their original functionality (applying only within one tab).
If you’re applying a filter, then it can be turned into a global filter with a toggle switch. The global filters are represented with a globe icon in their pills.
The chart won’t render if the chart filter conflicts with the global filter settings.
8. Get customized views for your Vizpad
We’re rolling out Custom Views in Vizpads—where you can tailor your Vizpad with your preferred filters or formatting while the base Vizpad remains untouched for everyone else. Since there’s no duplication of the original Vizpad, it reduces clutter and centralizes a single source of original Vizpad while still allowing personal customizations.
In the View mode of a Vizpad, after applying all the necessary filters and formatting, you can save them as a custom view with a name. The original Vizpad will be available as the “Default view”.
Your custom filters remain active across all Vizpad tabs in View mode for the duration of your session. There’s no need to re-apply every time you switch tabs.
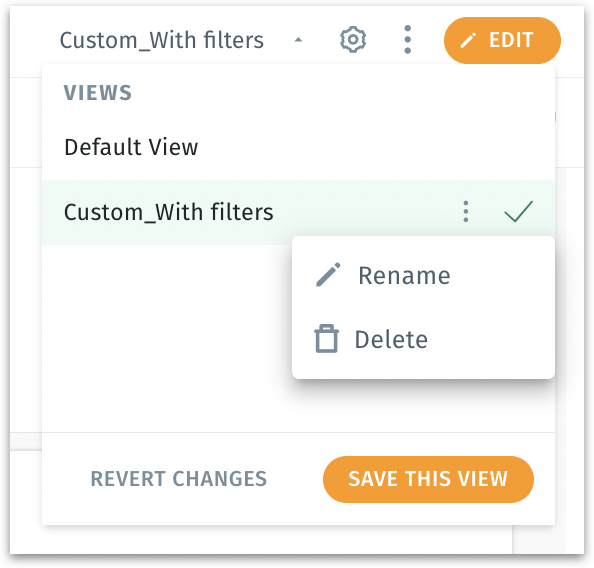
You can save as many custom views as you like. When the Vizpad is deleted, all the associated custom views will also be deleted. If there are any changes made to the original Vizpad, then you’ll see an alert message, giving you the option to refresh or keep your custom view or keep your custom version.
📈 Enhancements
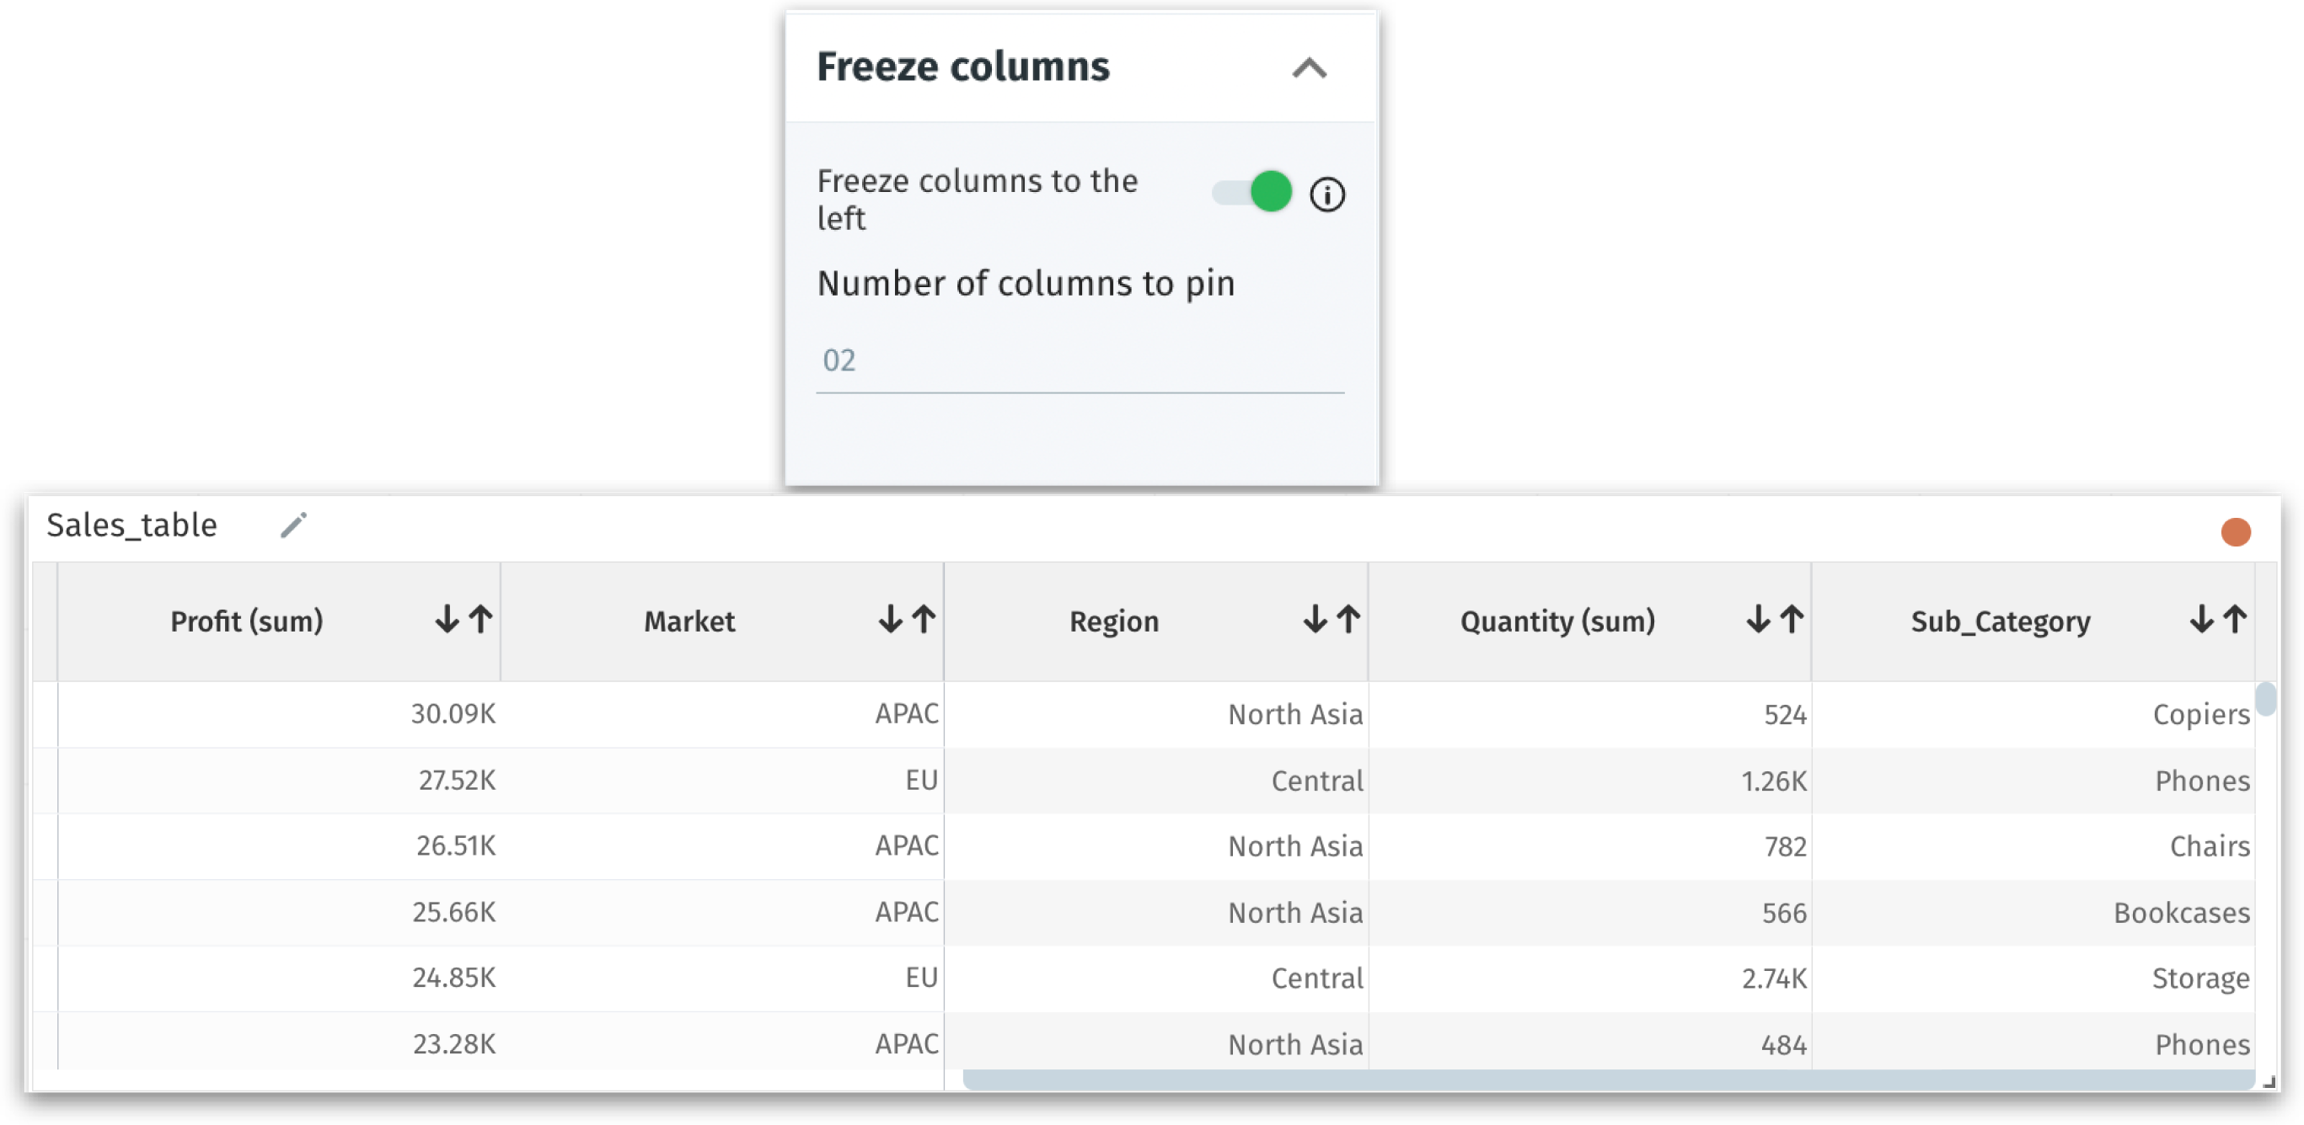
1. Freeze columns for better readability
We’re introducing a column-freezing option that lets you “freeze” columns to the left side of your Vizpad tables. Simply specify how many columns you want to freeze, and those will remain visible as you scroll horizontally. For pivot tables, any dimension columns in the configuration are automatically frozen, so you need not have to specify the number of columns to freeze.
By freezing columns, you can always keep your key reference fields in sight, speeding up comparisons.
2. Get proactive alert emails for all jobs
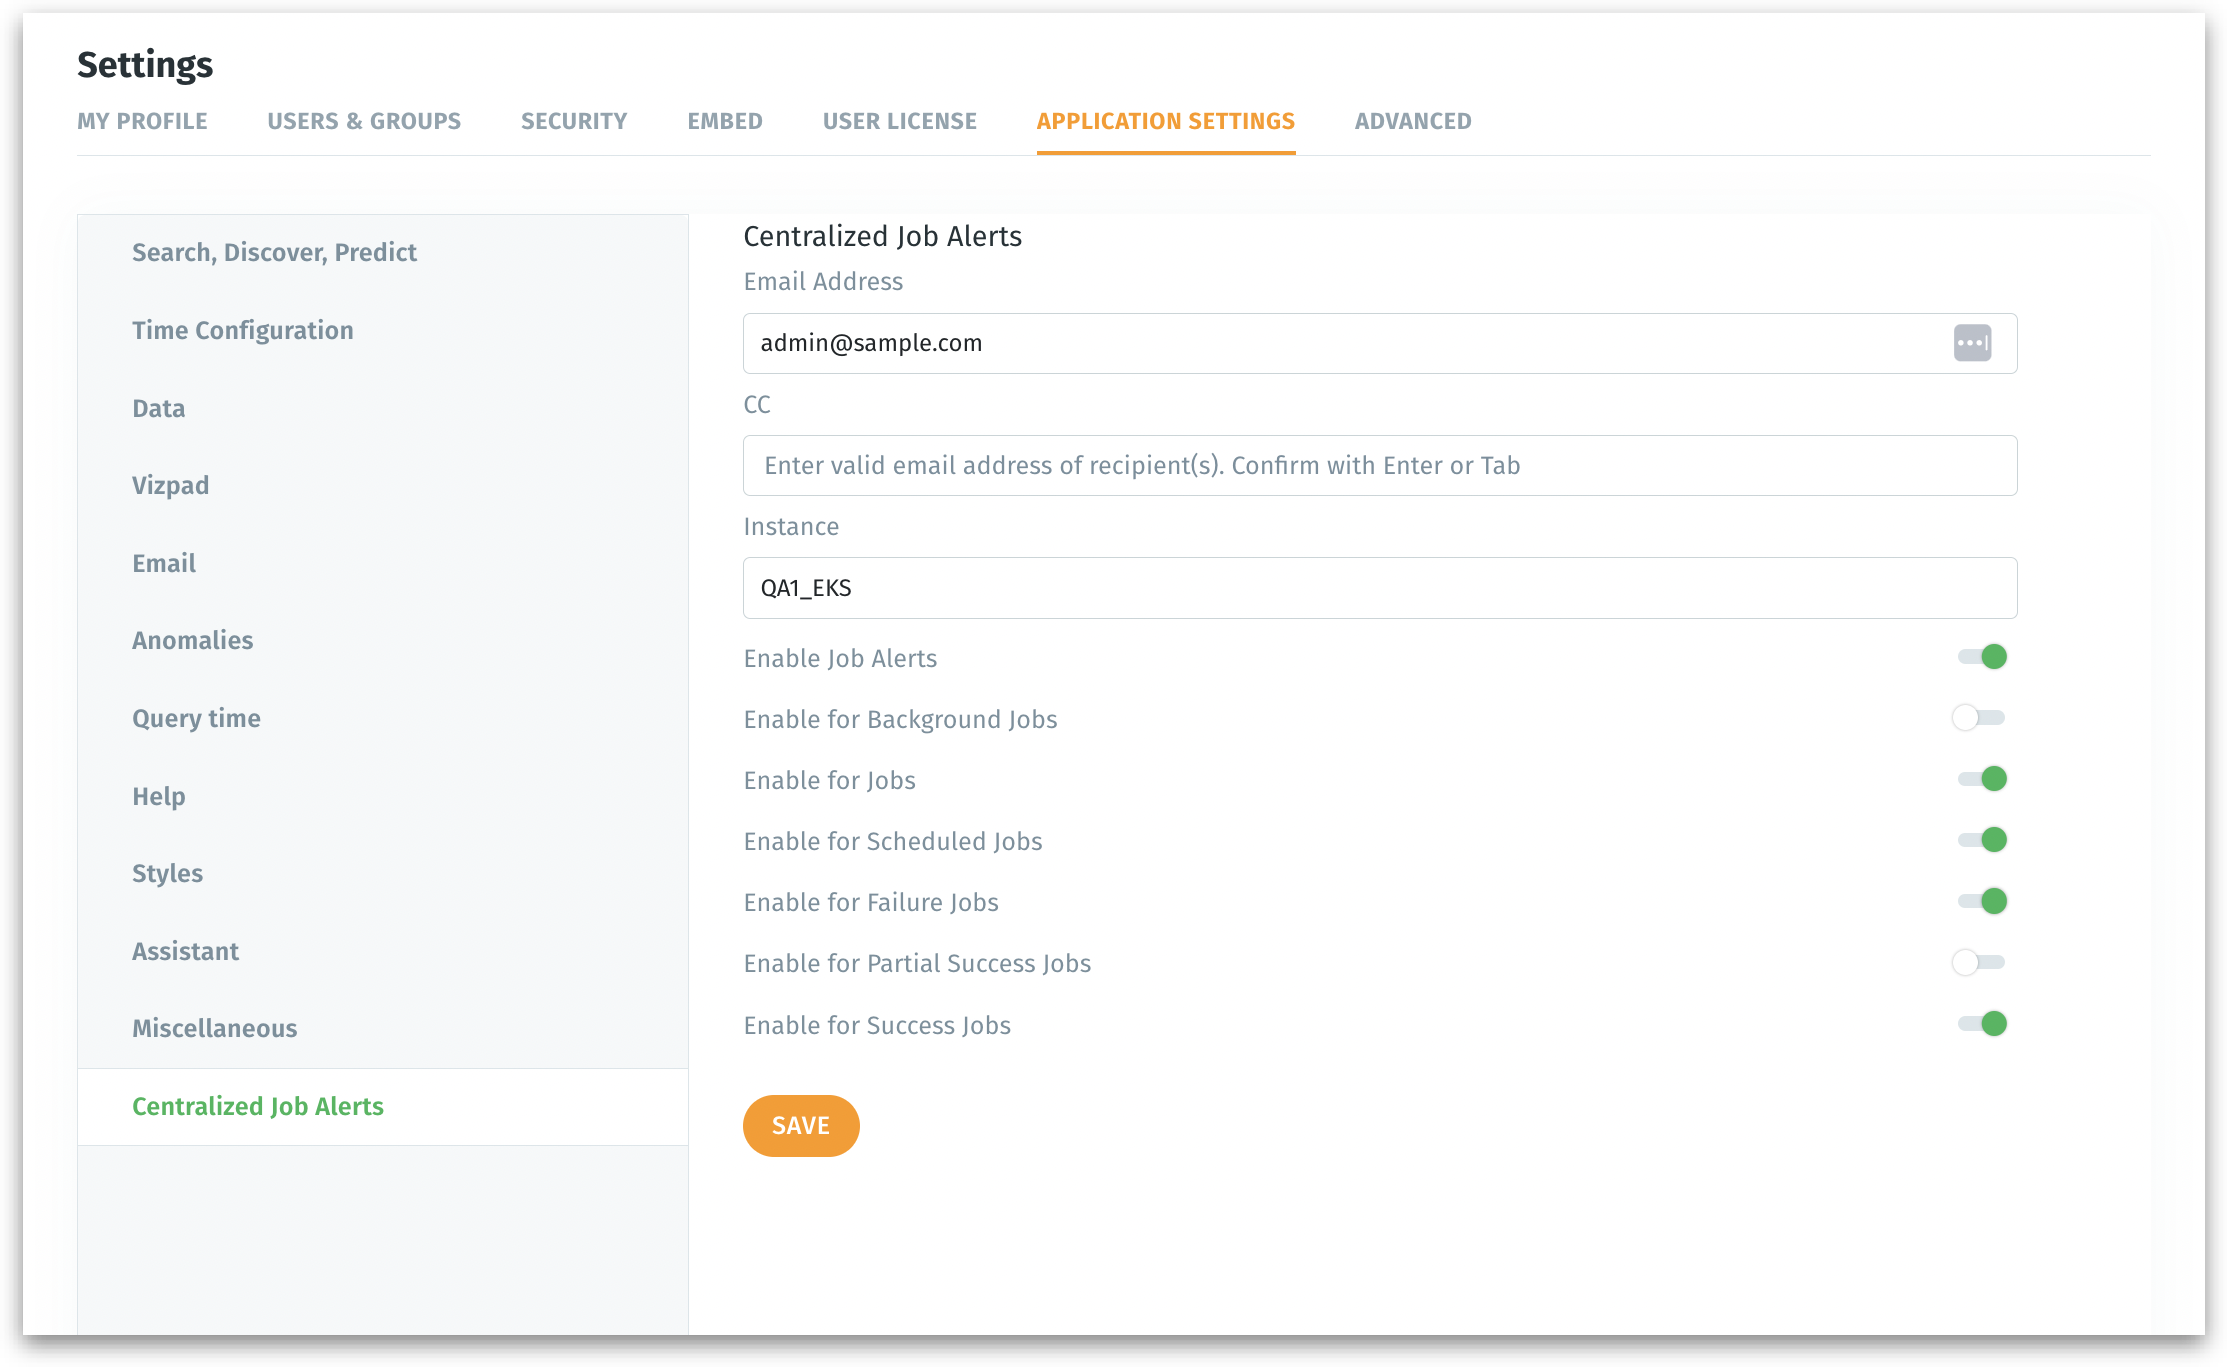
We’re introducing a centralized job notification feature that triggers an email for all job types irrespective of their statuses (success/failure/partial success). Instead of juggling multiple user-level email alerts, you can now easily set up notifications for all scheduled or background jobs, helping you spot recurring failures or missed runs much sooner.
Under Settings → Application Settings → Centralized Job Alerts, you can toggle these notifications on or off and specify exactly which statuses should trigger an email. Every job type—whether it’s a publish, refresh, or Insight creation—can be monitored in real time. This means fewer blind spots and a single pane of glass for all your job health alerts.
3. Introducing “Show as Rows” toggle for pivot tables
In Vizpads, we’re introducing a toggle that lets you display measures as row values in your pivot table.
The new “Show as Rows” switch moves your selected metrics (e.g., Profit, Revenue) into the row area below each dimension value.
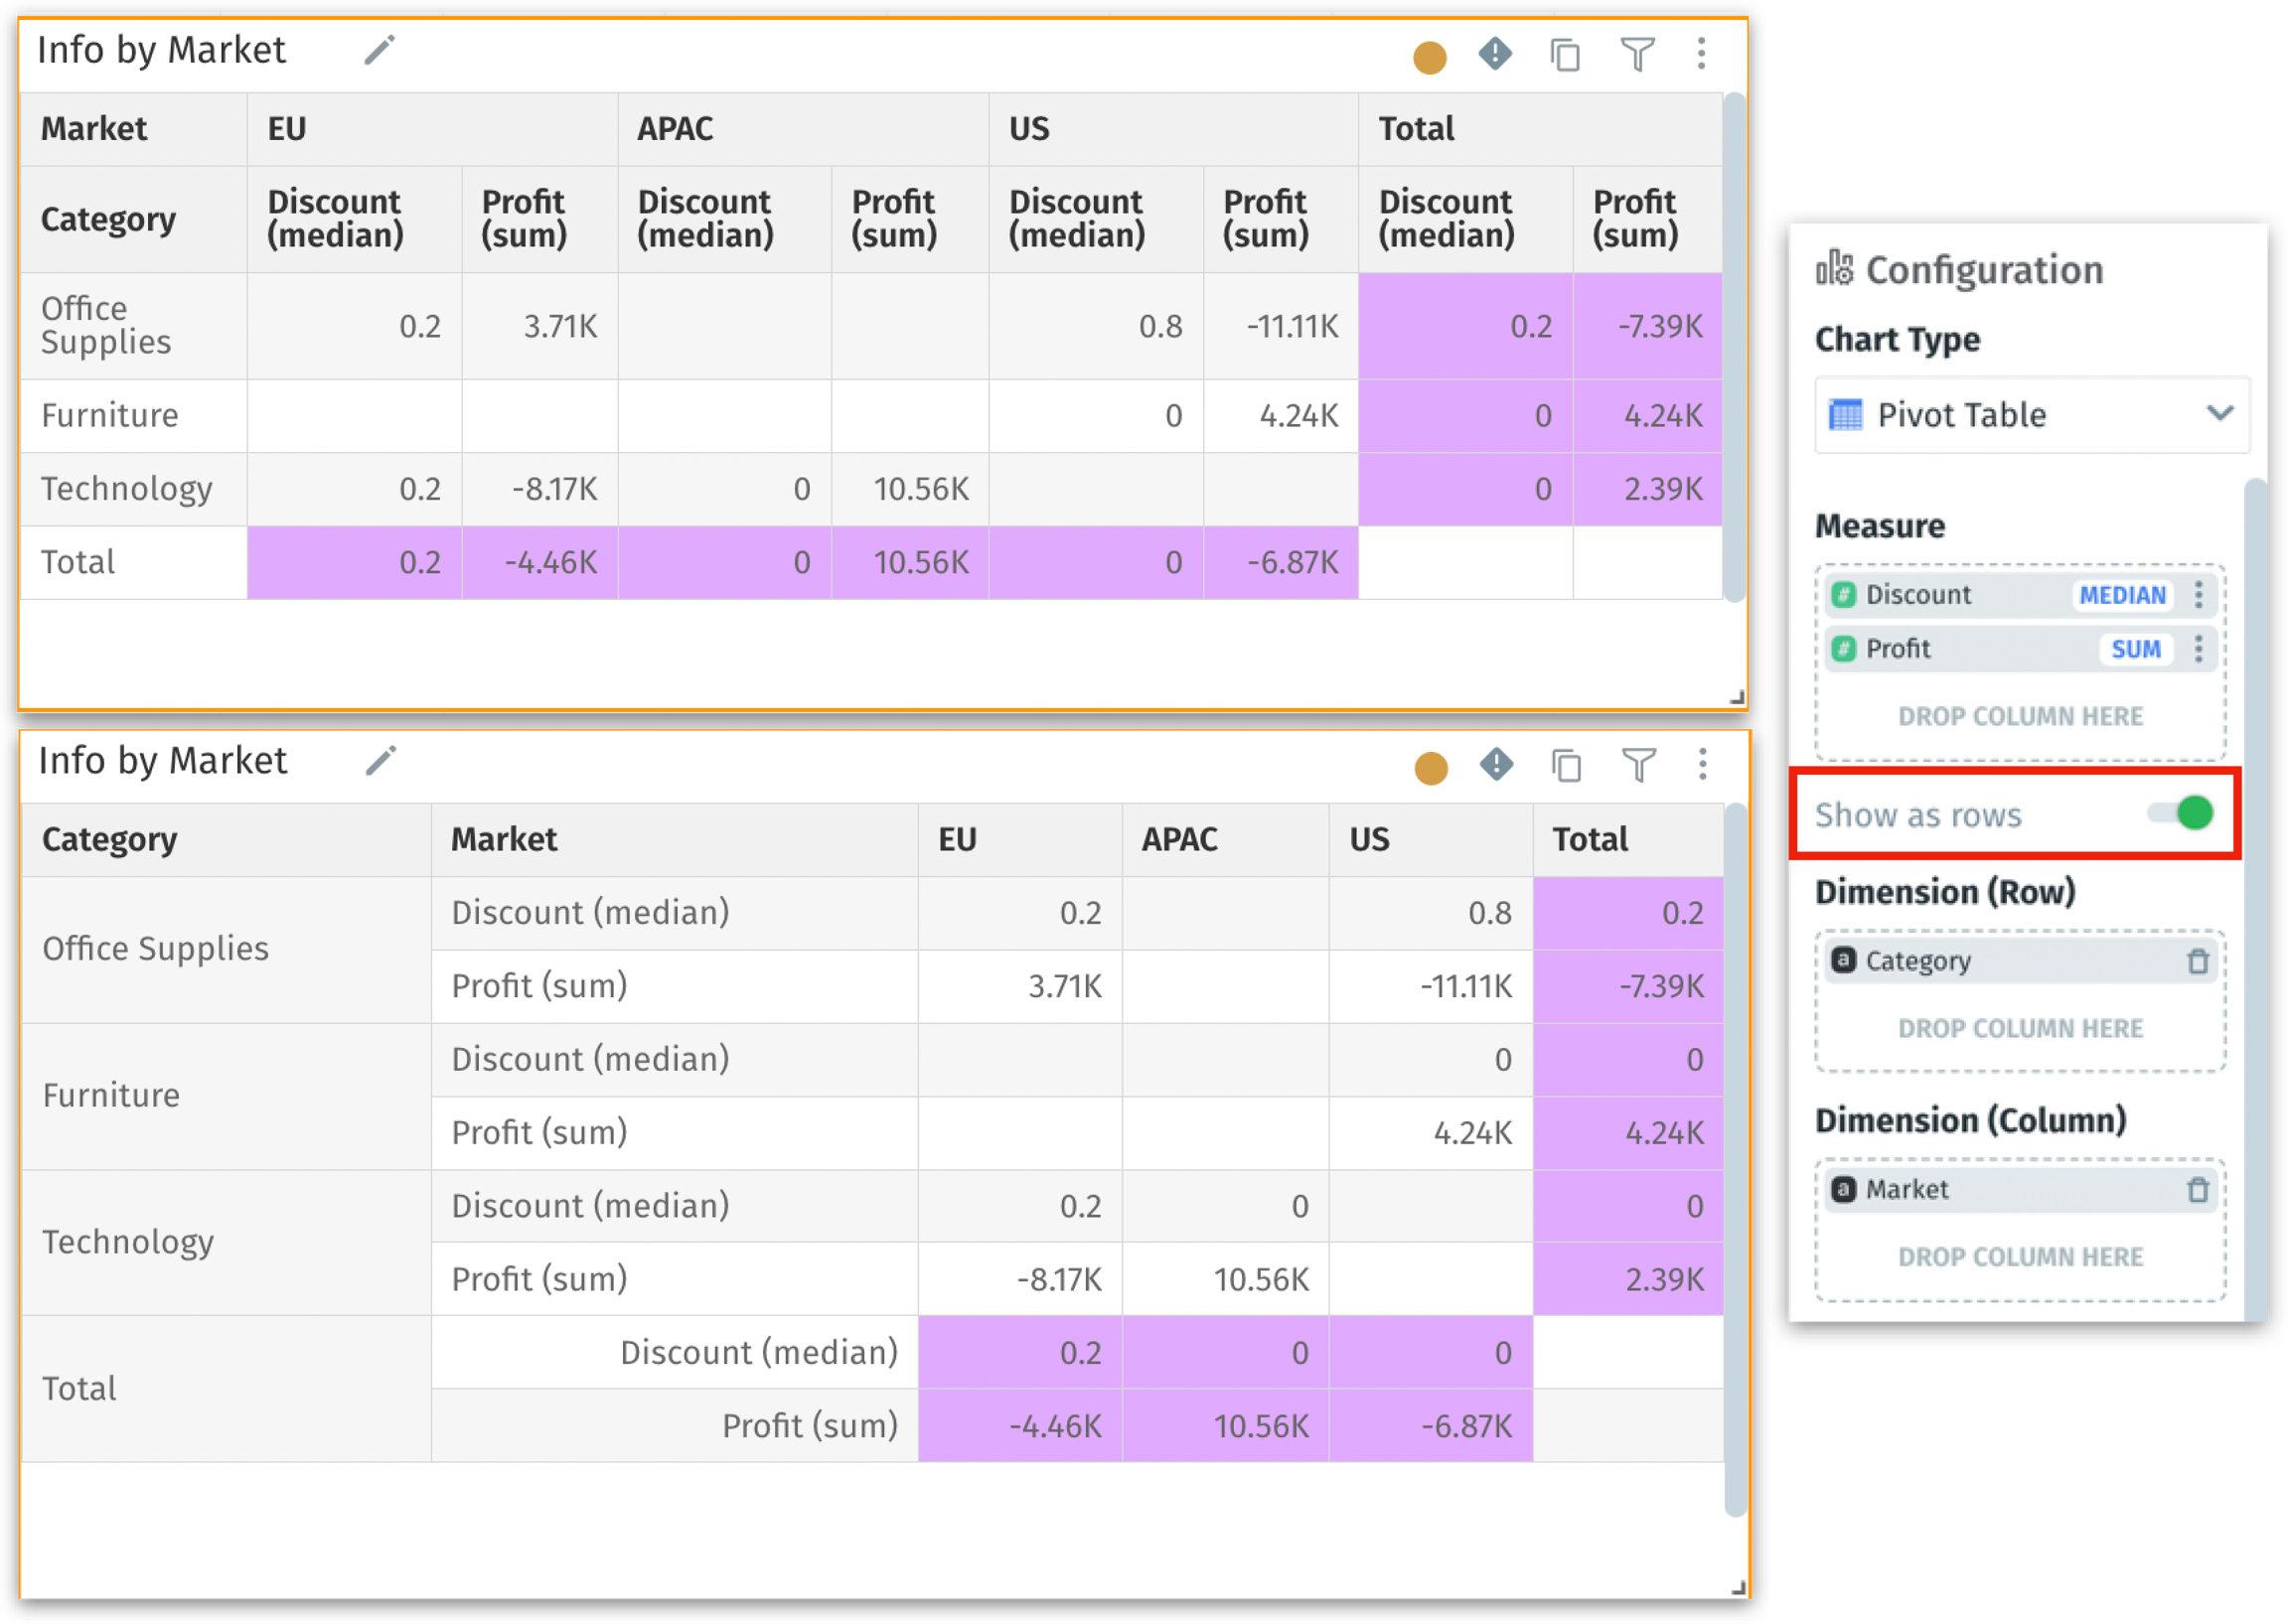
For this, you need atleast one column dimension in your pivot table.
Financial analysts frequently need to review metrics in a rows-based format for clarity and consistency. This also makes monthly or quarterly comparisons more straightforward and resembles a familiar financial statement layout.
4. Interactive results for Kaiya conversational Search
This release adds an interactive chart experience to the results of Kaiya Conversational Search, making it easy to dive deeper into any unusual or interesting data points. Now, when you click on any data point in the chart, you’ll see a pop-up offering options to keep just those selected data points, remove them entirely, drill into deeper hierarchies or columns, generate new Feeds, configure Insights on the fly, or even build an ML model in real time.
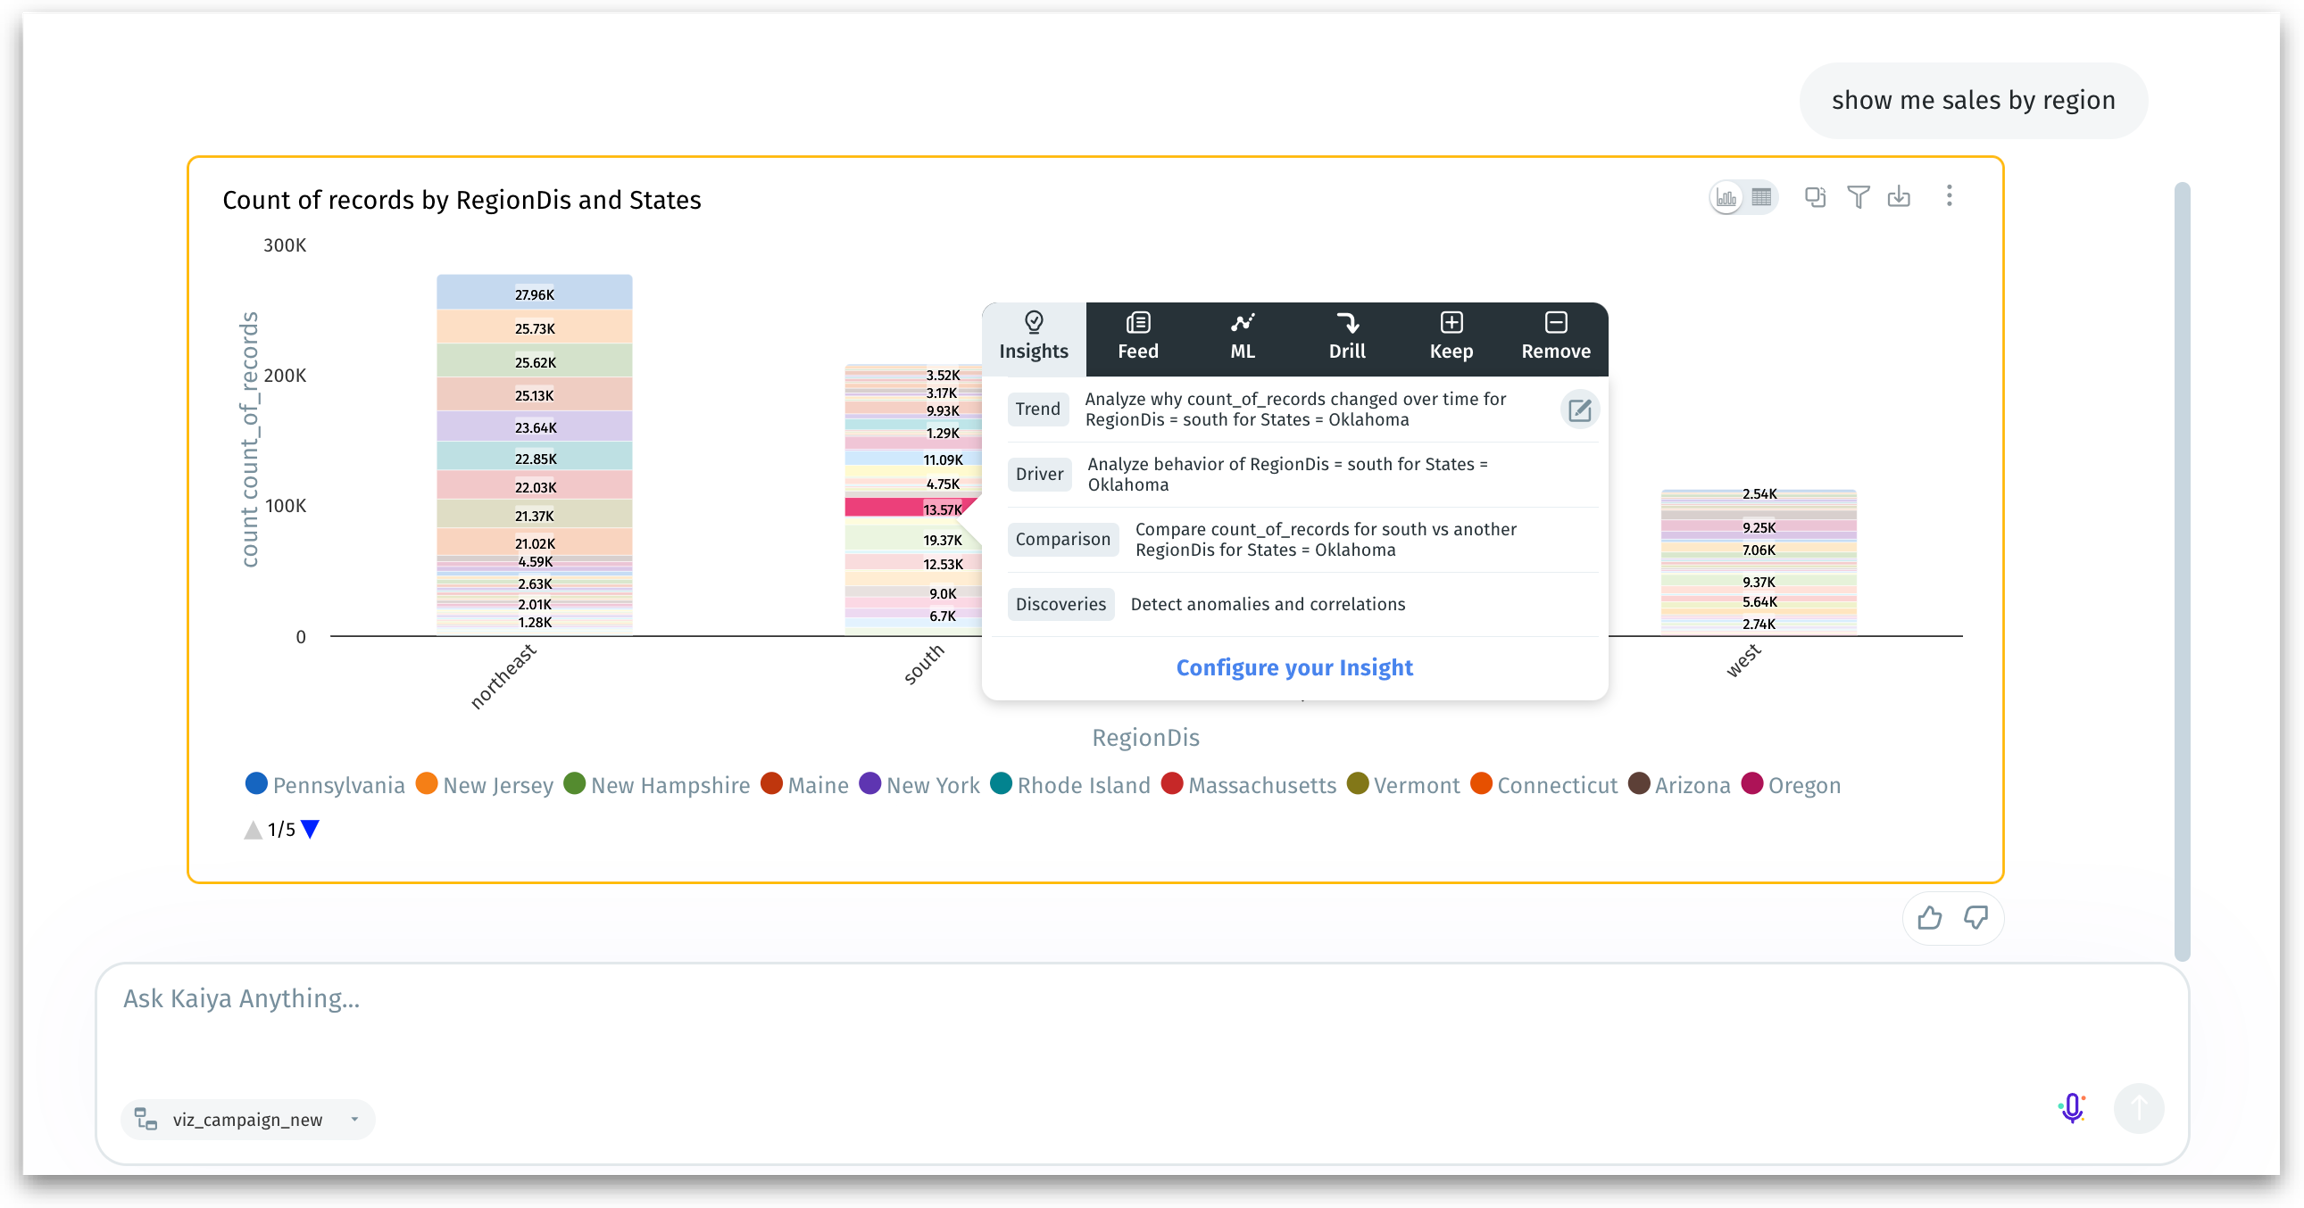
Once triggered, Tellius generates the requested Insight/Feed/Model behind the scenes. You’ll receive a notification once the job completes, so you can continue exploring in Kaiya without waiting. Completed Insights/Feed/Model appear under Discover/Feed/Predict tab respectively, where you can explore them further.
This interactive layer, already available in Search results, is now extended to Kaiya Conversational Search.
5. Displaying Top 3 related Insights in Tellius Assistant
We’re rolling out a new, smarter recommendation in the Tellius Assistant that displays the top three insights tied to any metric mentioned in your search. So, if you type in a query with the keyword “Incidents”, the Assistant will instantly list three existing Insights where “Incidents” is used as a primary metric. If fewer than three Insights exist, Kaiya shows the existing matches available.
We also factor in the creation date to ensure you see the most up-to-date findings first. This is particularly handy for teams with lots of shared content—no more digging around multiple tabs to figure out.
6. Form-based annotations in Vizpad tables
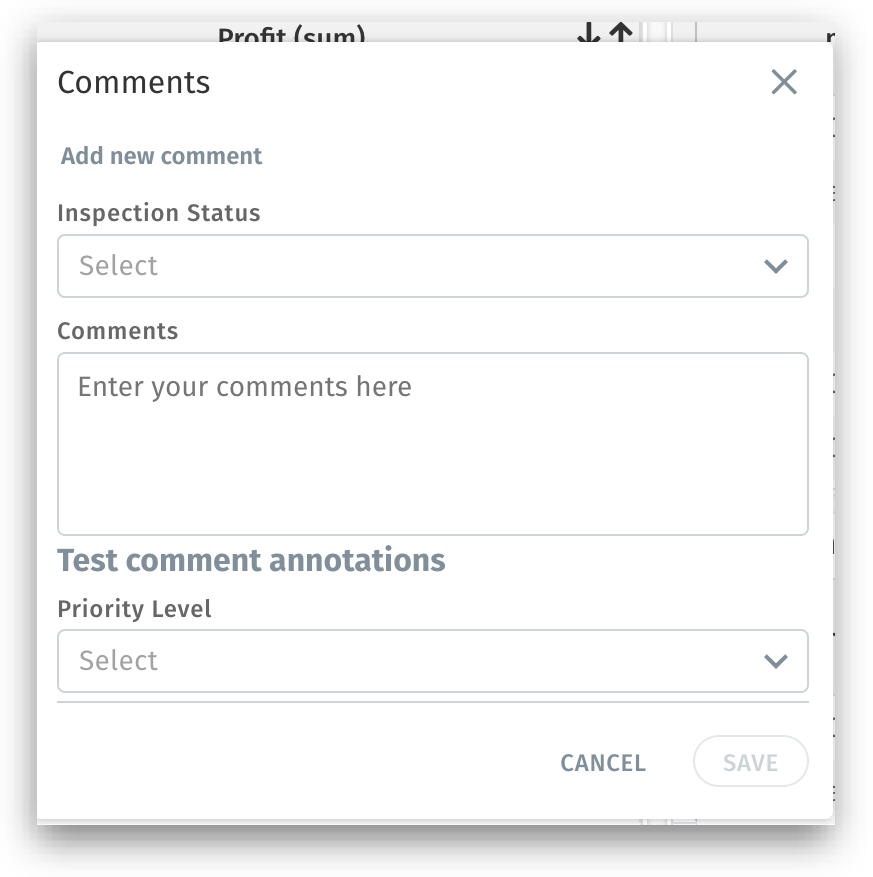
In this release, we are introducing a structured, form-based annotation framework for Vizpad tables with configurable dropdowns and text boxes. The annotation pane loads the relevant form dynamically, storing all user submissions in a single JSON field and displaying them in a read-only format when needed.
For example, if a user selects a value “Insurance” from the dropdown, then based on this choice, Tellius dynamically updates the form to show only “Insurance”-related options. This guided workflow ensures you’re entering accurate, relevant information, minimizing errors and maintaining data consistency.
7. Improved “Include Nulls” in Vizpads
We’ve updated how Vizpads handle null values in tables, giving you clearer control over which records get displayed—even if some measures in a row are null. This change addresses a common scenario where a user wants to hide rows that are entirely null, but still keeps partially-null data for further investigation.
“Include Nulls” toggle
When checked: You see all rows, including those where some or even all measure columns are null.
When unchecked: Rows are only removed if all the measure columns in that row are null. If a single measure in that dimension row is populated, that row will be shown.
Instead of losing rows that contain a few nulls mixed with valid data, you retain essential information, leading to more accurate analysis.
Last updated
Was this helpful?