📌Applying local filters
Learn how to apply and manage local filters in Tellius Vizpads to focus analysis on specific charts without impacting other visualizations.
A local filter is applied to an individual chart within a Vizpad, affecting only that chart's displayed data. By using local filters, you can conduct a focused analysis on specific aspects of your data without altering other charts.
Here's a complete guide for applying local filters:
Click on the funnel icon (Filter) in the required chart. The following window will be displayed.
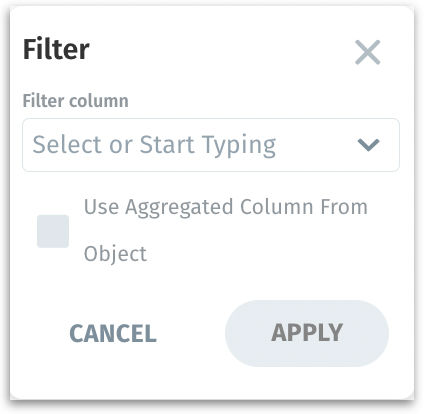
Start typing a specific column or click on the dropdown button to view the columns of the associated Business View.
Next to the Select Column, you can find three buttons that act as filters - Date/time dimensions, dimensions, and measures. Click on the required button(s) to filter the columns displayed.
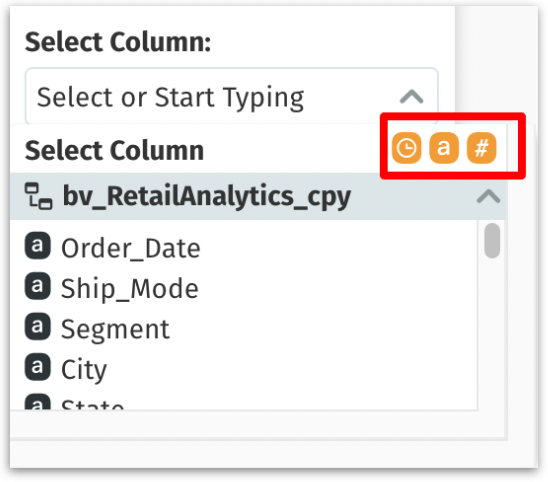
If any column type is selected, then that indicator will be displayed in orange color, whereas the disabled column type will be displayed in grey color. Here, only measures and date/time dimensions are selected, and dimensions are disabled.
Operators based on column type
When you apply filters, the available operators vary depending on the type of column selected.
If a dimension is selected, the following operators will be displayed:
In: Includes values that match a specified list.
Not in: Excludes values that match a specified list.
Equals: Matches a specific value.
Does not equal: Excludes a specific value.
Contains: Includes values containing a specific substring.
Does not contain: Excludes values containing a specific substring.
Matches regex: Includes values that match a specific regular expression.
Starts with: Includes values beginning with a specific substring.
Not starts with: Excludes values beginning with a specific substring.
Ends with: Includes values ending with a specific substring.
Not ends with: Excludes values ending with a specific substring.
Blank: Includes values that are blank or null.
Not blank: Excludes values that are blank or null.
Top (N): Selects the top N entries from your dataset. Use "Top N" when you want to focus on the highest values in a set.
Bottom (N): Selects the bottom N entries from your dataset. Use "Bottom N" to identify the lowest values in a set.
Start by choosing a measure to evaluate and the required aggregation.
Define "N" in the Value field to indicate the count of entries you wish to view.
Tellius will sort the data based on the selected measure in descending order (for Top N) and ascending order (for Bottom N).
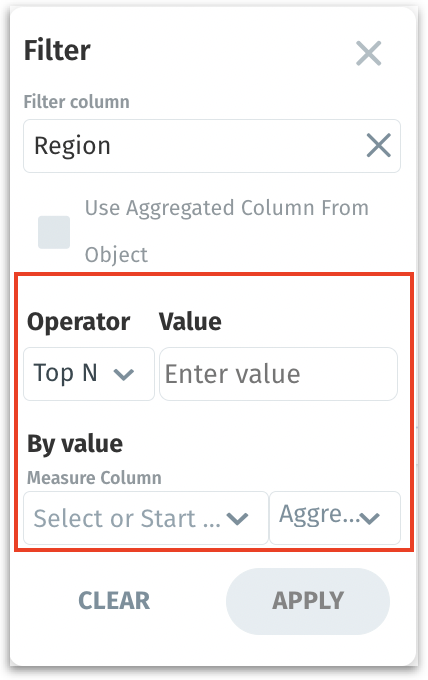
Top N and Bottom N
If a measure is selected, the following operators will be displayed:
Equals: Matches a specified numeric value.
Does not equal: Excludes a specified numeric value.
Greater than: Includes values greater than a specified number.
Greater than or equal to: Includes values equal to or greater than a specified number.
Less than: Includes values less than a specified number.
Less than or equal to: Includes values equal to or less than a specified number.
Inbetween: Includes values within a specified numeric range.
If a date dimension is selected, the following date picker will be displayed for selecting specific dates or date ranges. For more details about the date picker window, check out this page.
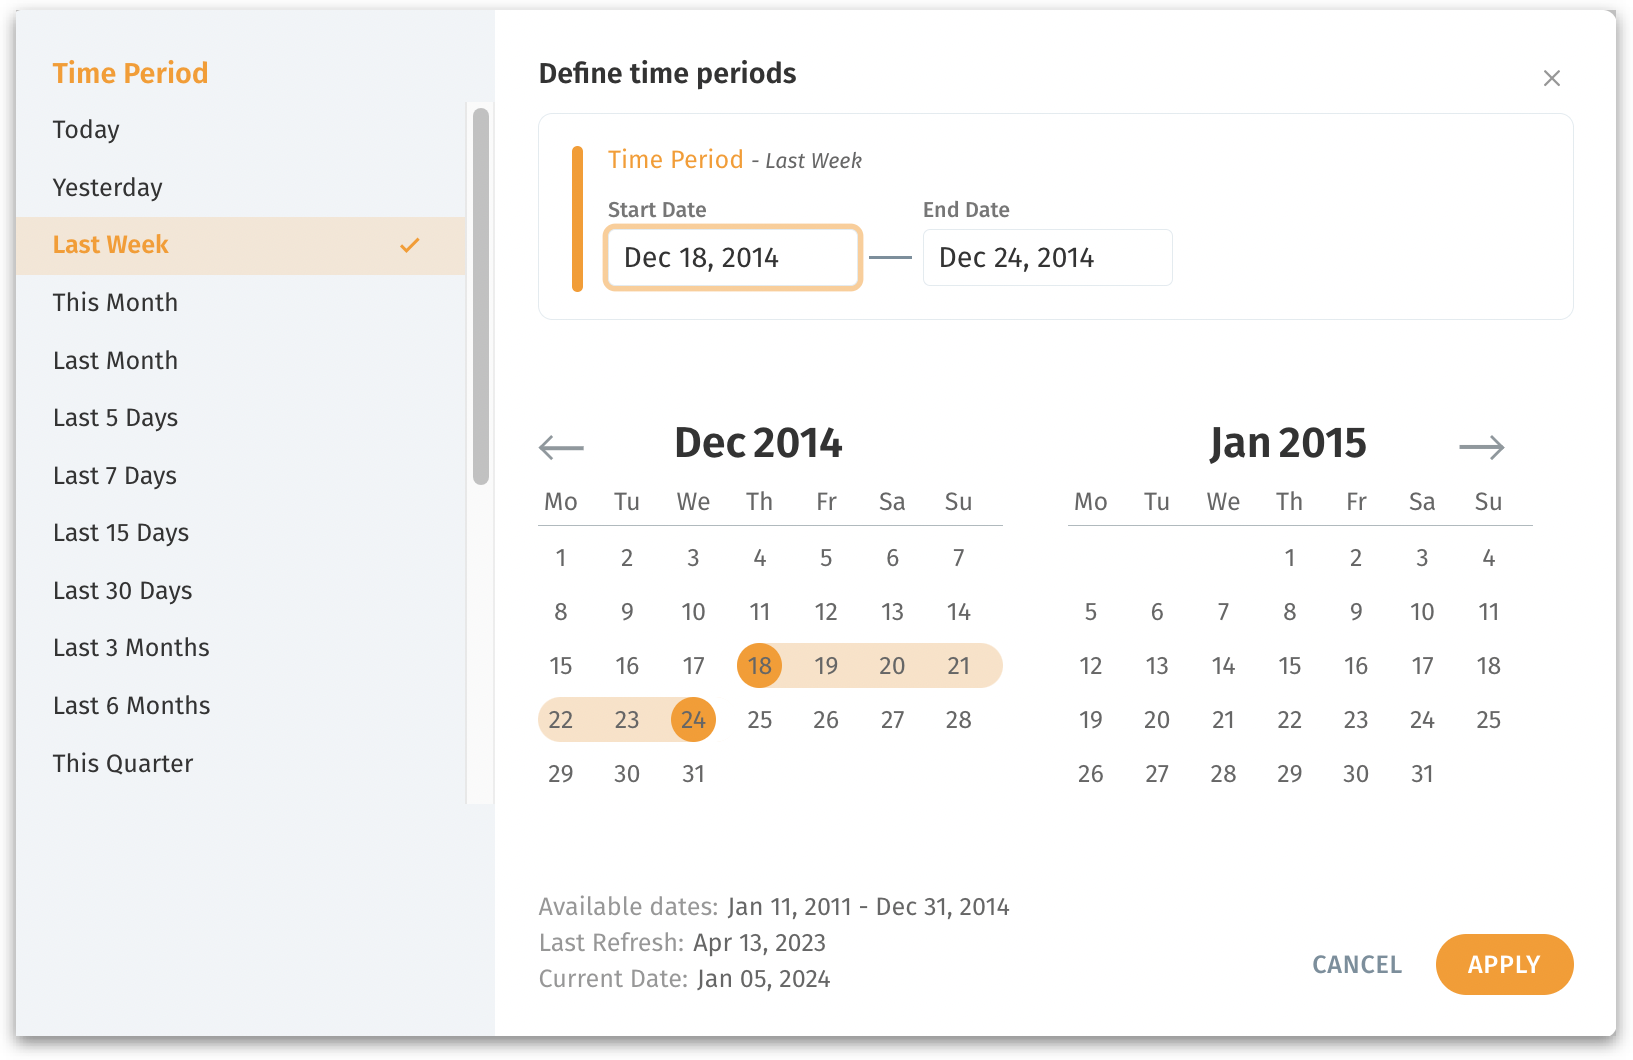
Click on Apply to apply the filter, or click on Cancel to discard.
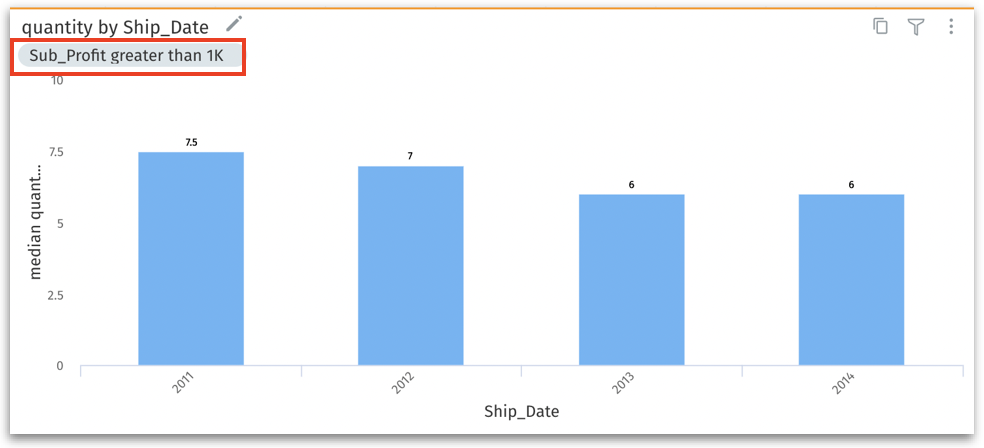
A grey filter pill indicating the filter applied will be displayed near the chart’s name.
To remove a filter, hover over the filter pill and click on the "X" button.
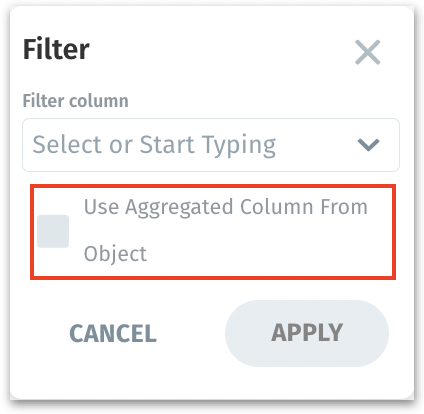
Use Aggregated Column From Object checkbox
If you want to create a filter that interacts with other components on the dashboard based on the specific aggregation, you could use this checkbox.
When this box is checked, the dropdown menu for selecting columns disappears because the filter can only be applied to the aggregated data column that is already being used in your chart.
Was this helpful?