Release 5.0
Last updated
Was this helpful?
Last updated
Was this helpful?
We're excited to launch our game-changing Tellius 5.0 that's set to revolutionize your analytics journey! 🎉 Every single feature is meticulously engineered to empower you and your team to make more informed decisions, uncover deeper insights, and strengthen collaboration.
"Copilot", your AI-powered sidekick (released last year) can turn complex charts into clear, concise, customizable summaries.
With our new "Annotations" feature, you can comment on charts and collaborate with your colleagues, directly on the dashboards.
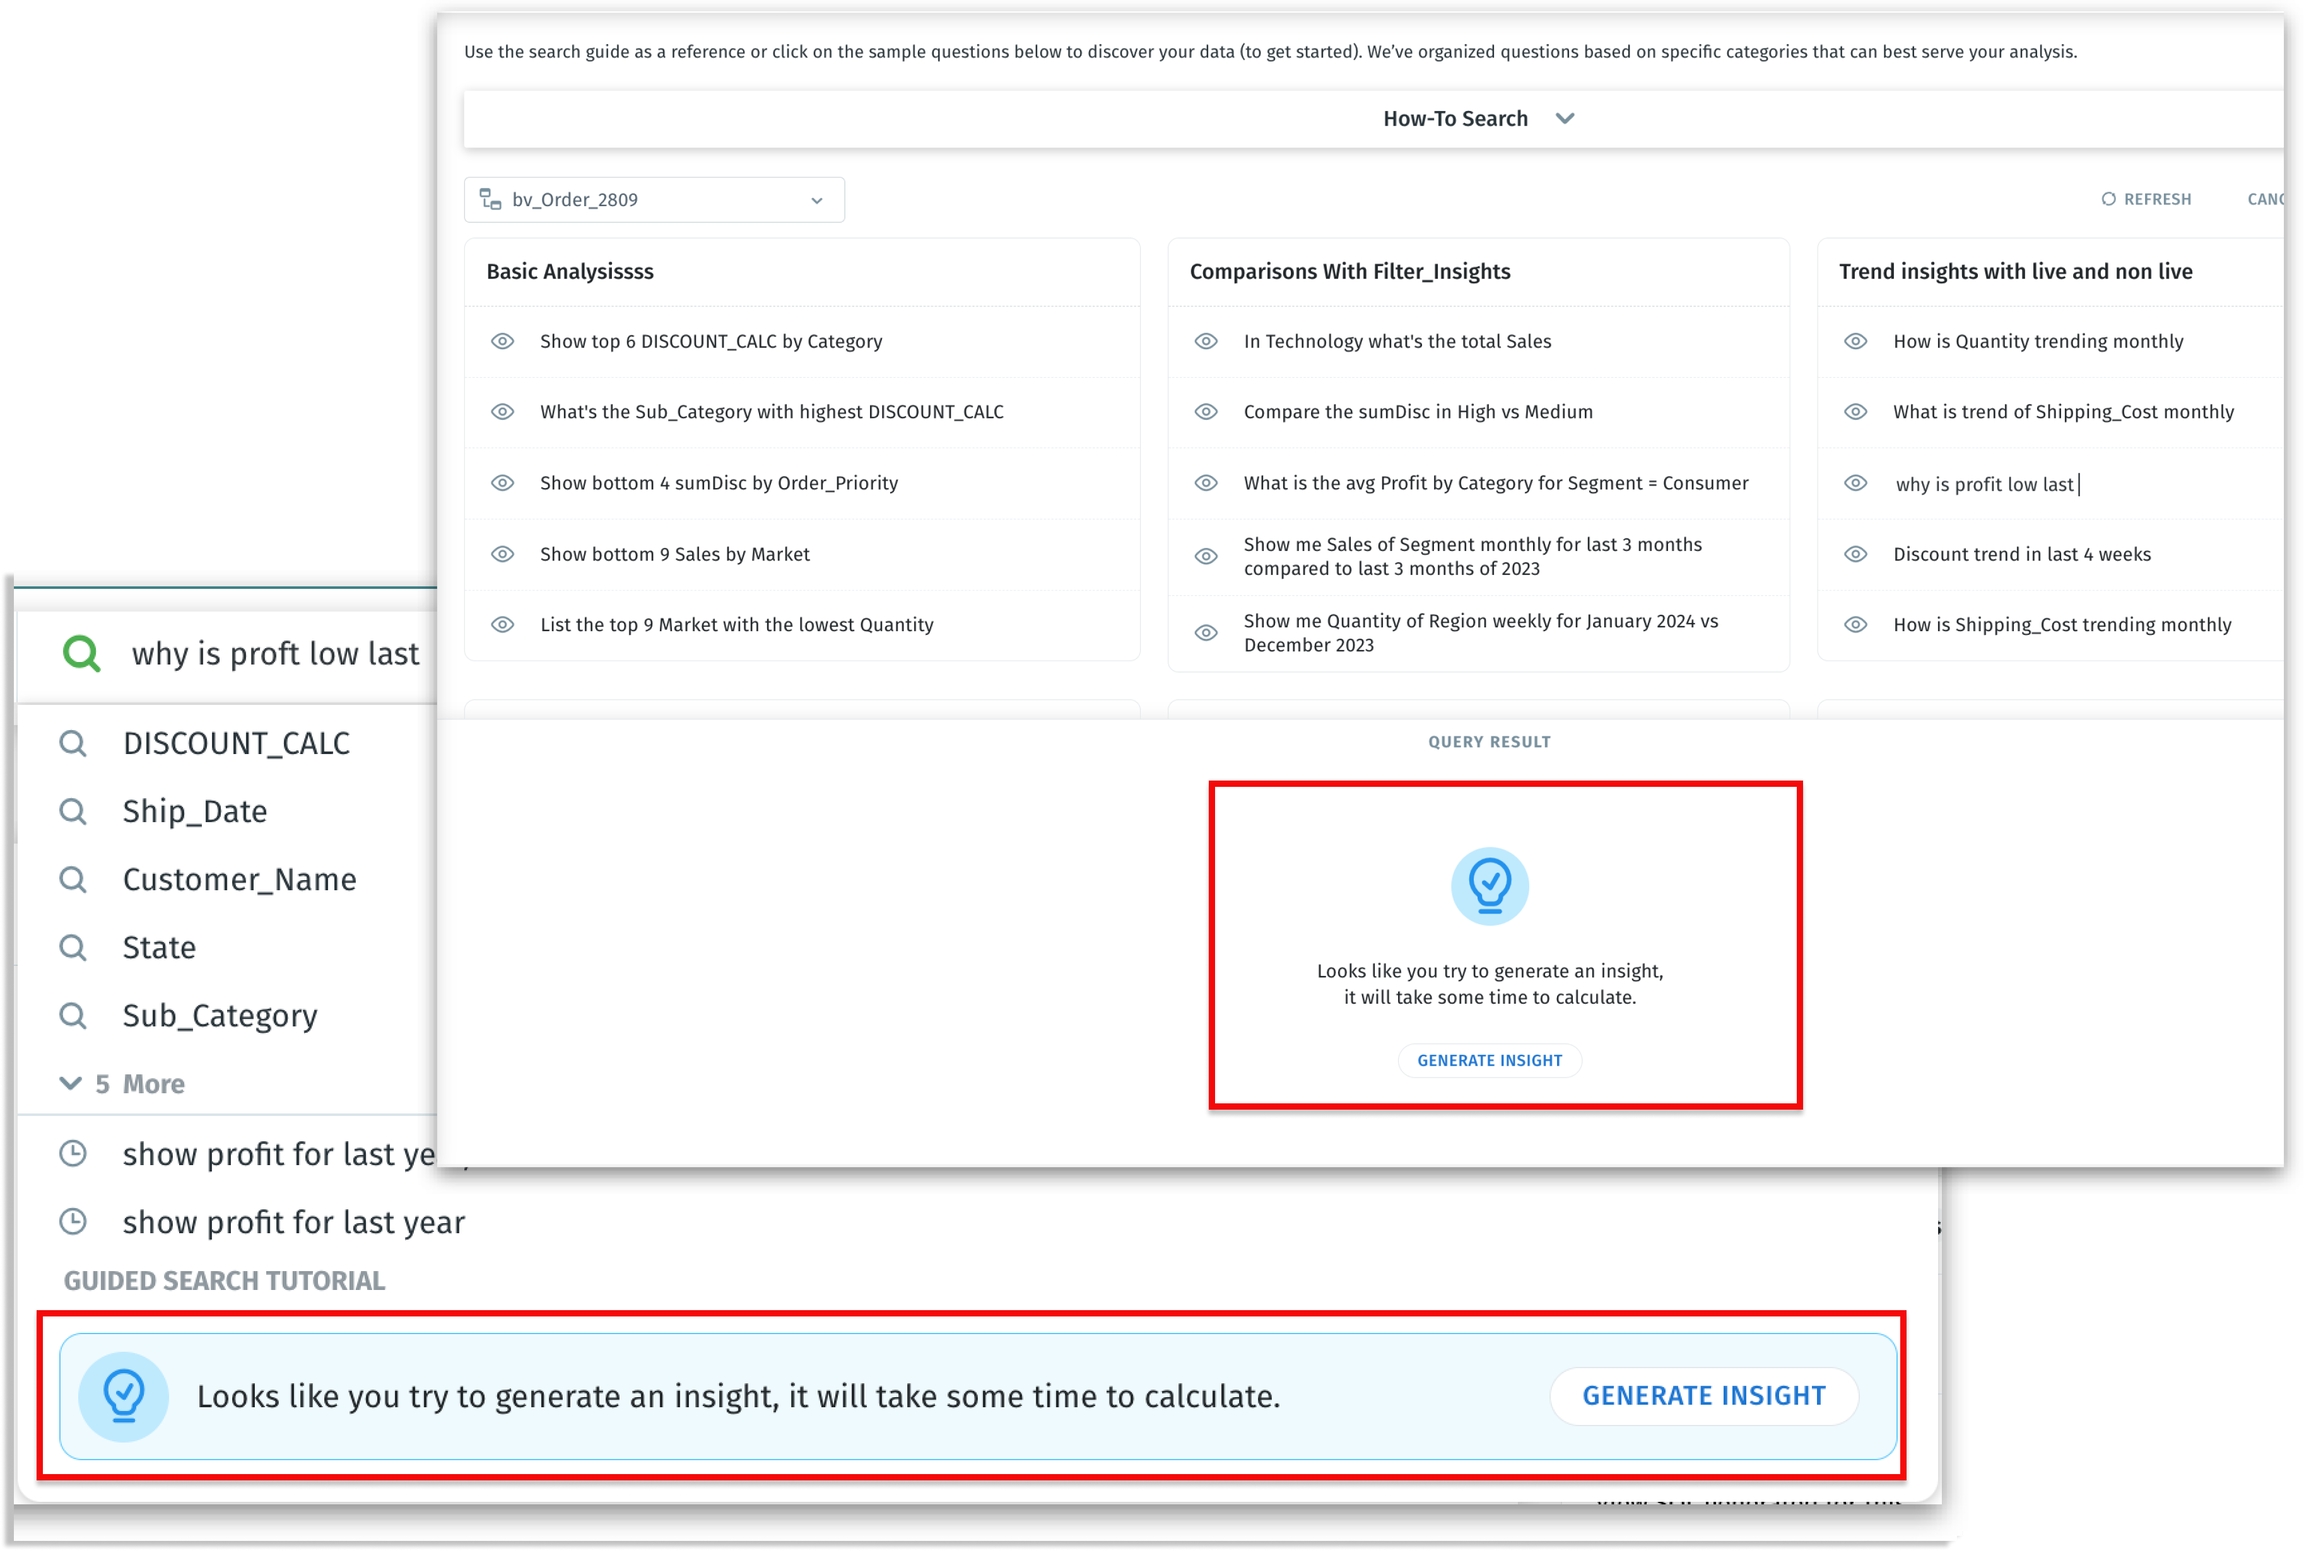
Our Search got smarter and faster! Experience GenAI-powered Search which can understand the context and nuances of human language to connect you to the exact data point and Business View you’re looking for!
With seamless datasource swapping, automatic deduplication of data models, enhanced metadata migration, and archiving inactive data to optimize storage, we're setting new standards for enterprise-grade data management and governance.
We’re democratizing data, ensuring that everyone in your organization can confidently dive into data and derive insights like a pro, regardless of their technical skills. Welcome to our most impactful update yet!
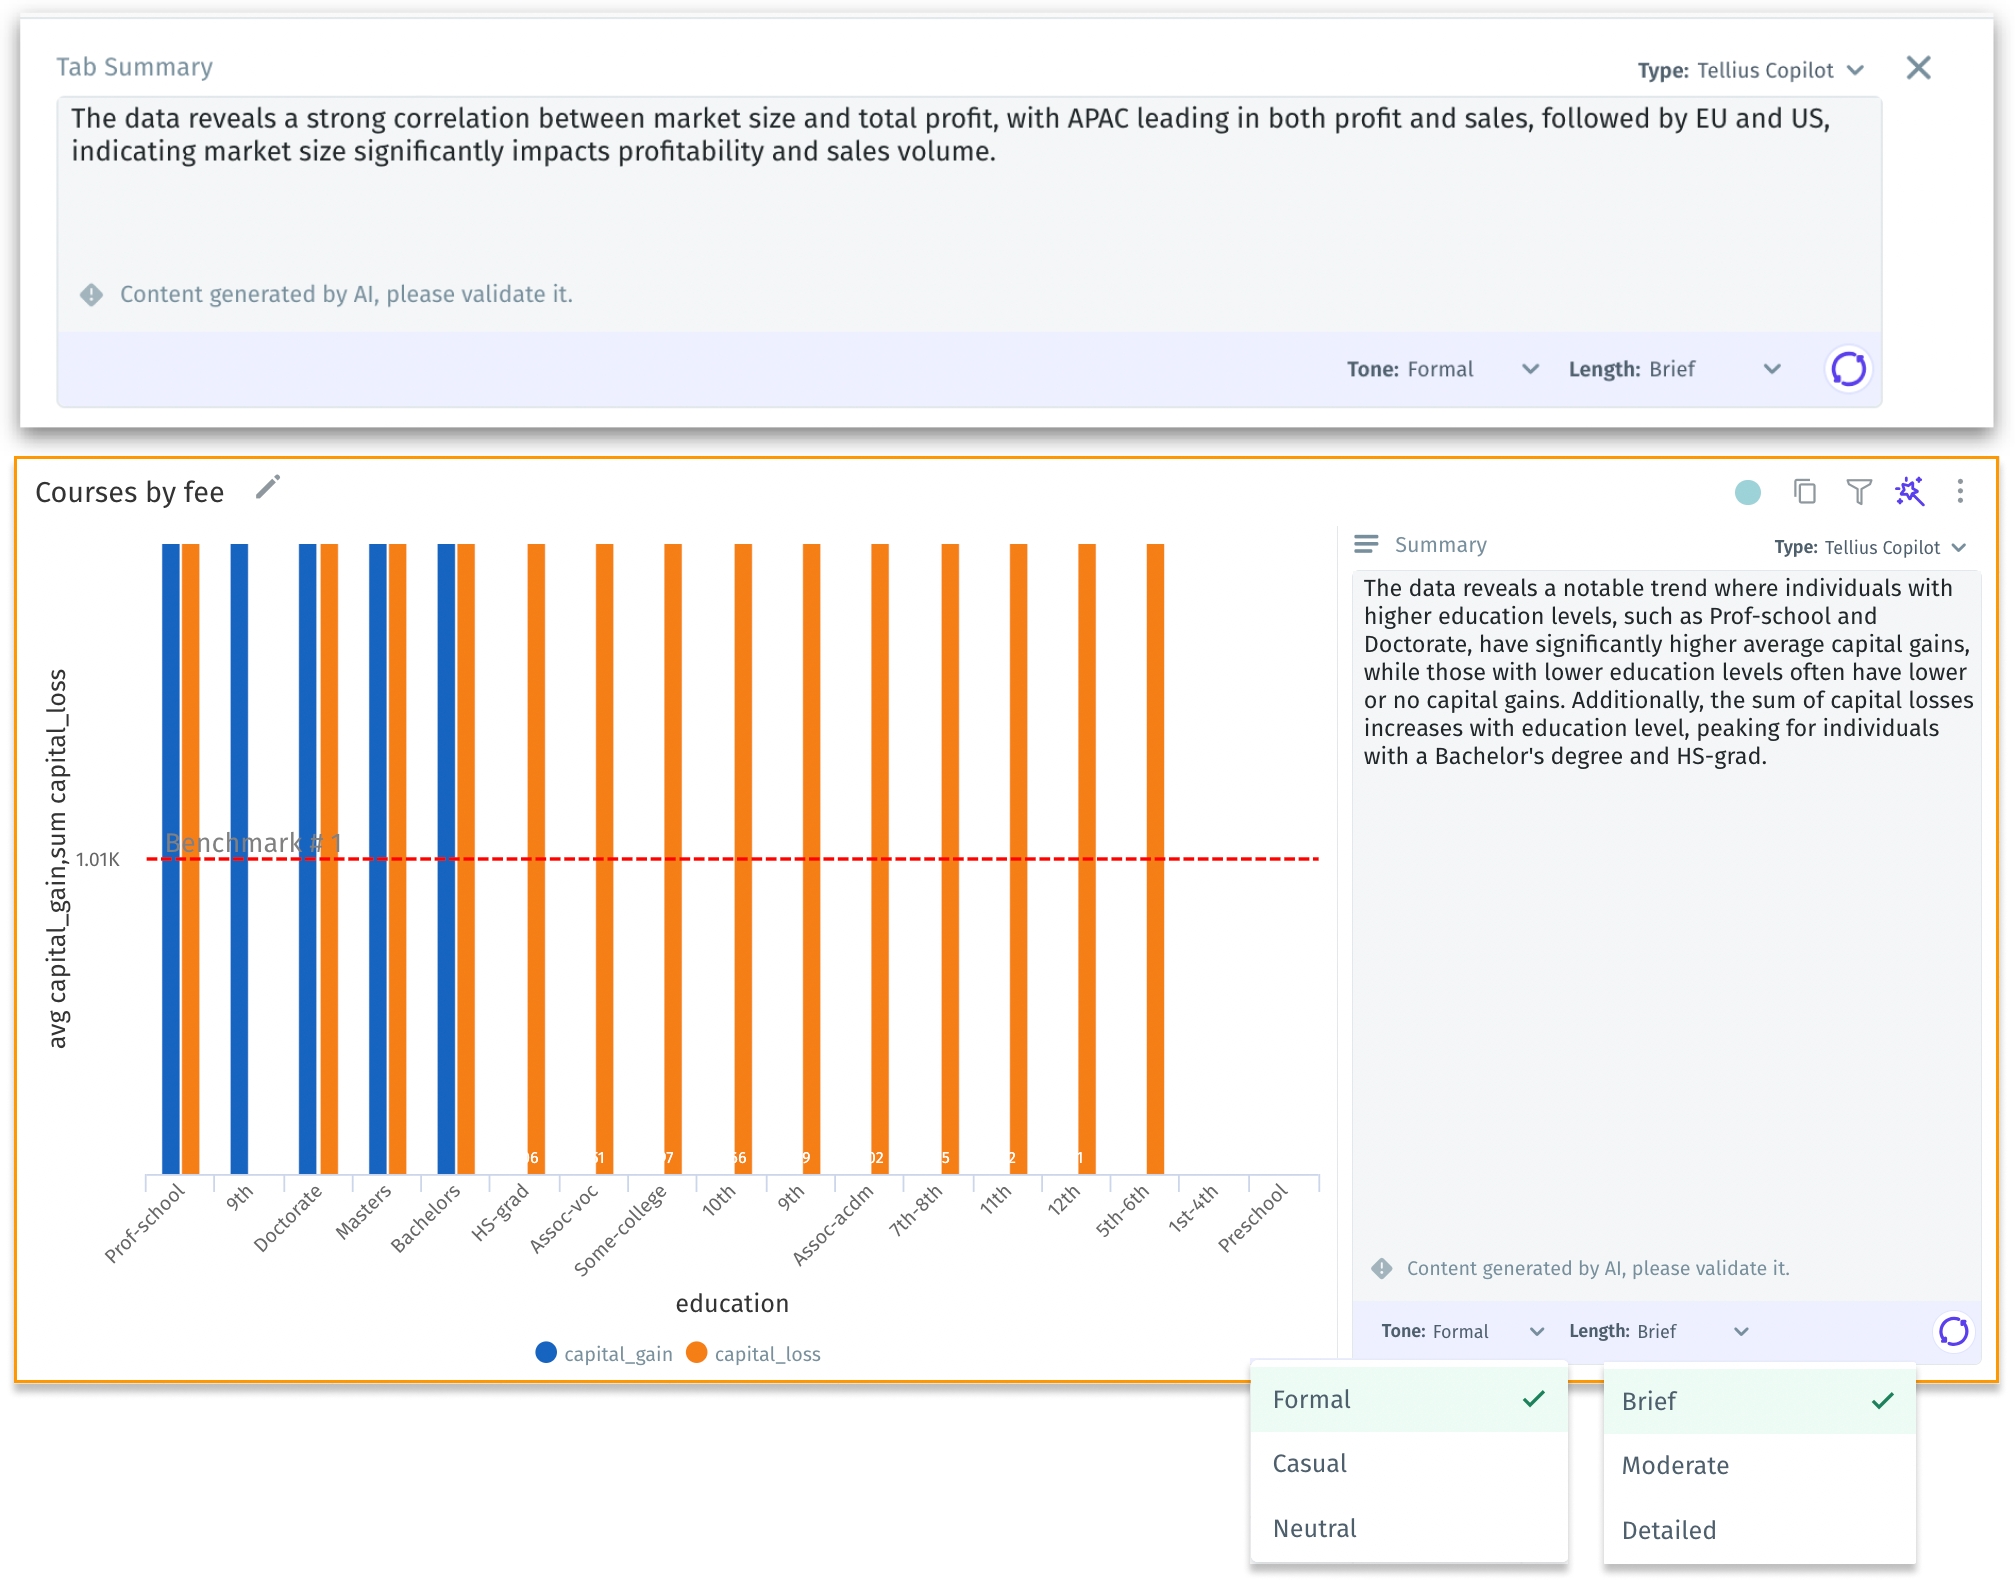
Expanding on last year's Tellius Copilot, we're excited to introduce Gen AI-powered natural language summaries for Search and Vizpads. This new upgrade is all about transforming complex data analyses into clear, concise summaries. With just a click on “Add AI Summary”, users can now instantly obtain an easy-to-understand summary for any chart or tab. Users can regenerate, edit, and save these summaries, ensuring accuracy and relevance. Also, they get total control over the summary's length (from brief to detailed) and tone (from formal to casual).
The ability to turn data into digestible summaries enhances communication between teams, supports strategic decision-making, and helps teams draw meaningful comparisons from their data. By turning numbers into narratives, Tellius makes data insights more accessible to a broader audience, bridging the gap between data experts and business users.
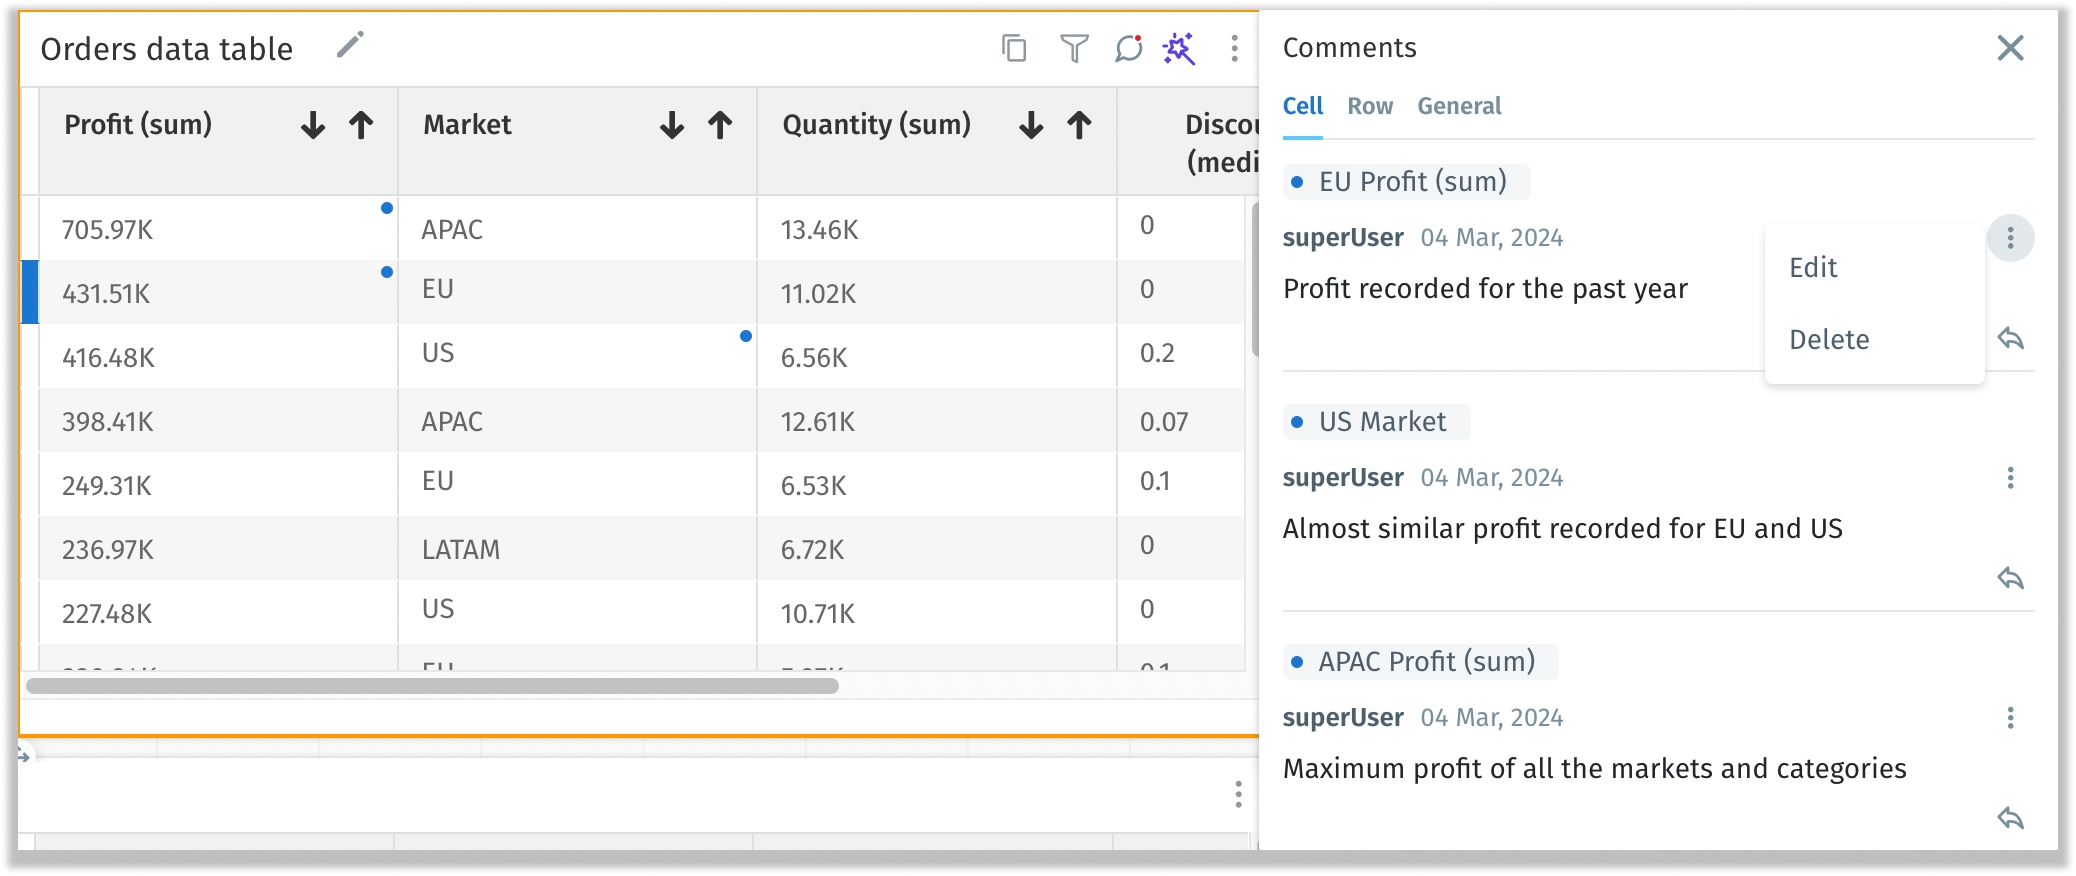
With our “Annotations” feature, users can annotate charts and add contextual comments, creating an immersive and interactive reporting experience. For table charts, users can add detailed comments directly within each table cell, complete with the option to attach images and documents for comprehensive communication. The “Comments” icon on each table leads to a consolidated view of all remarks, fostering collaboration and dialogue among users.
By adding comments, images, and documents, users can provide deeper insights and context to data, making complex information easier to understand for a broader range of audiences.
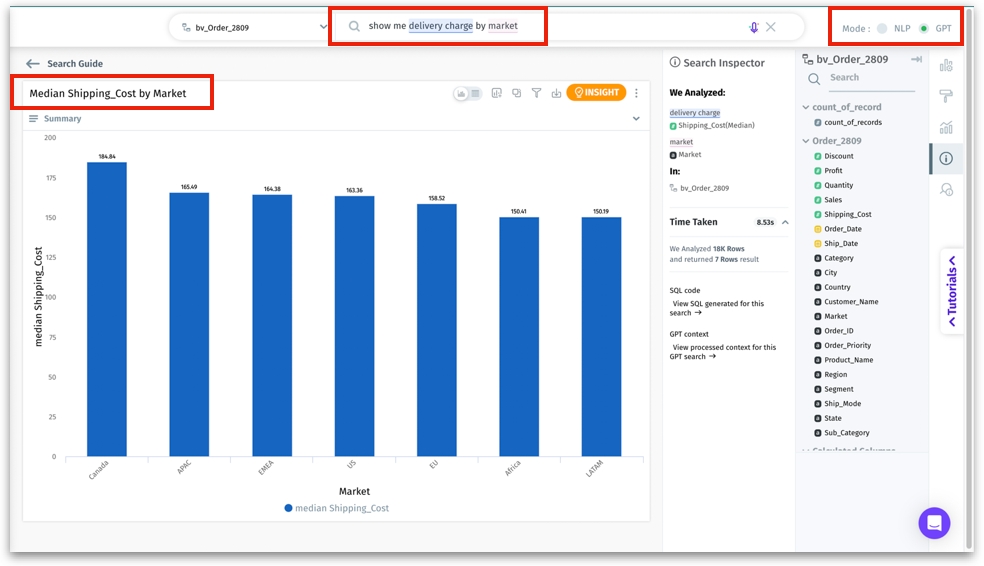
We've leveraged the power of Gen AI to enhance the Natural Language Processing (NLP) capabilities in Search. This dual approach, combining Gen AI's advanced capabilities with our unique parsing algorithm allows for more intuitive query formulation. Now, Tellius can smartly map the natural language keywords to the precise data you're seeking.
The improved search smartly interprets varied linguistic styles, meaning users don't have to necessarily predefine synonyms for keywords. For example, referring to a "profit" column as "financial gain" will be accurately understood by Search, mapping to the correct dataset column. With the ability to understand a broader range of query styles, users can swiftly get results for their search queries, without the need to stick to rigid formats.
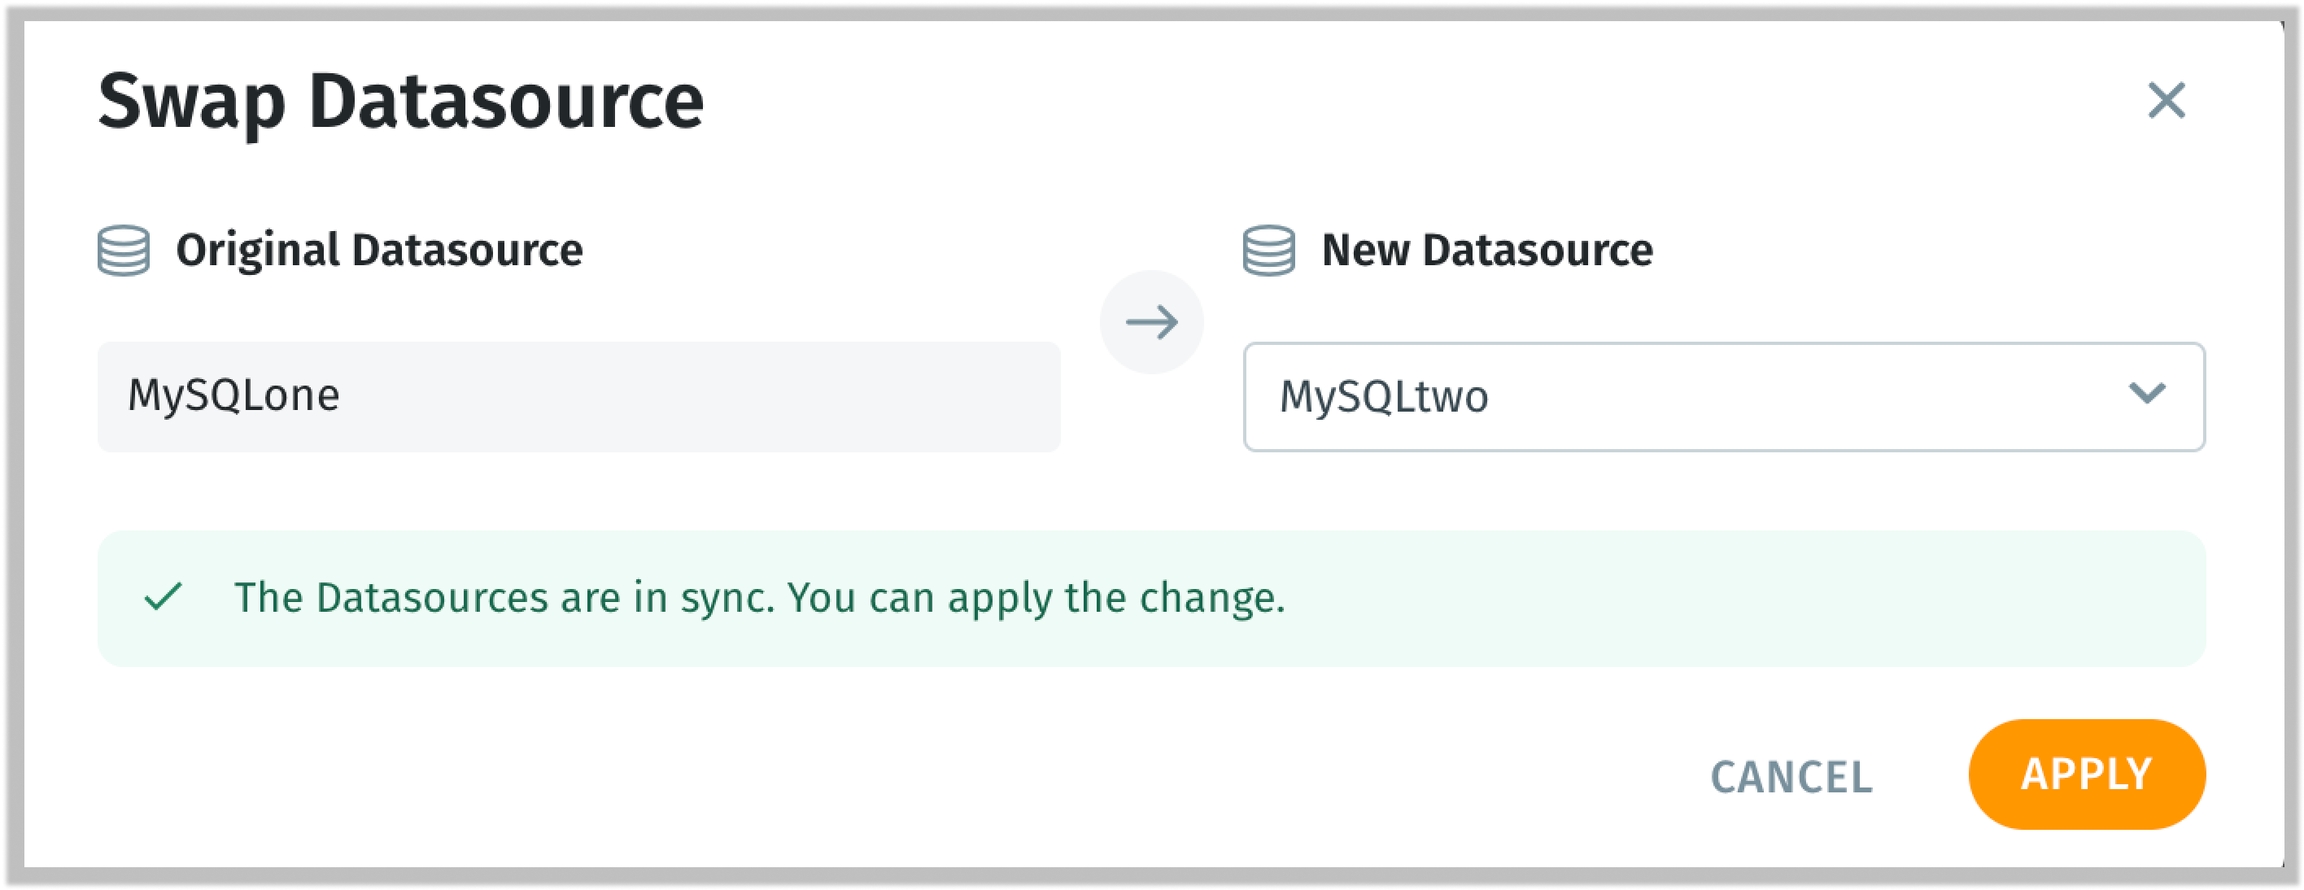
We’ve introduced a new feature that streamlines the process of managing and migrating data sources between different datasets, facilitating the partial migration of datasets to new sources.
Due to the swapping, if metadata changes make filters in Vizpads unusable, only the filter column will be displayed in each pill, and the operators will be cleared for reselection. Additionally, control filters (including single-select, multi-select, dropdown, and range slider) will be reset.
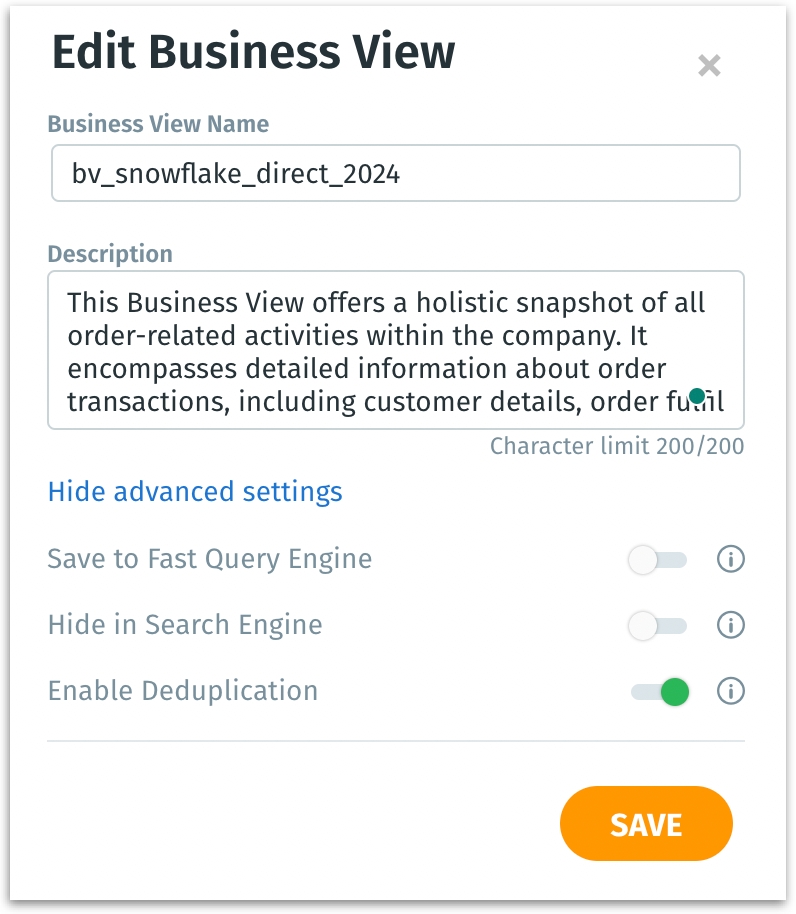
Tellius can now automatically identify and remove duplicate data entries resulting from joins, thereby preventing skewed results and data explosions. Under Data --> Business View --> Edit, deduplication can be applied for Snowflake Live Business Views.
Deduplication is critical for more complex scenarios involving Snowflake schemas with multiple interconnected fact and dimension tables. It simplifies data model management and enhances data accuracy. It saves time and effort in data preparation by automatically identifying duplicate entries, allowing you to focus on analysis rather than data cleaning.
For instance, when combining sales and call data through common dimensions (like customer or territory), deduplication ensures that the totals for calls or sales are not inflated due to the overlapping data. Tellius 5.0 smartly deduplicates data at the necessary level (e.g., per employee, per call, per sale) based on the context of the user's query, ensuring accurate results across different analyses.
Available in 5.2
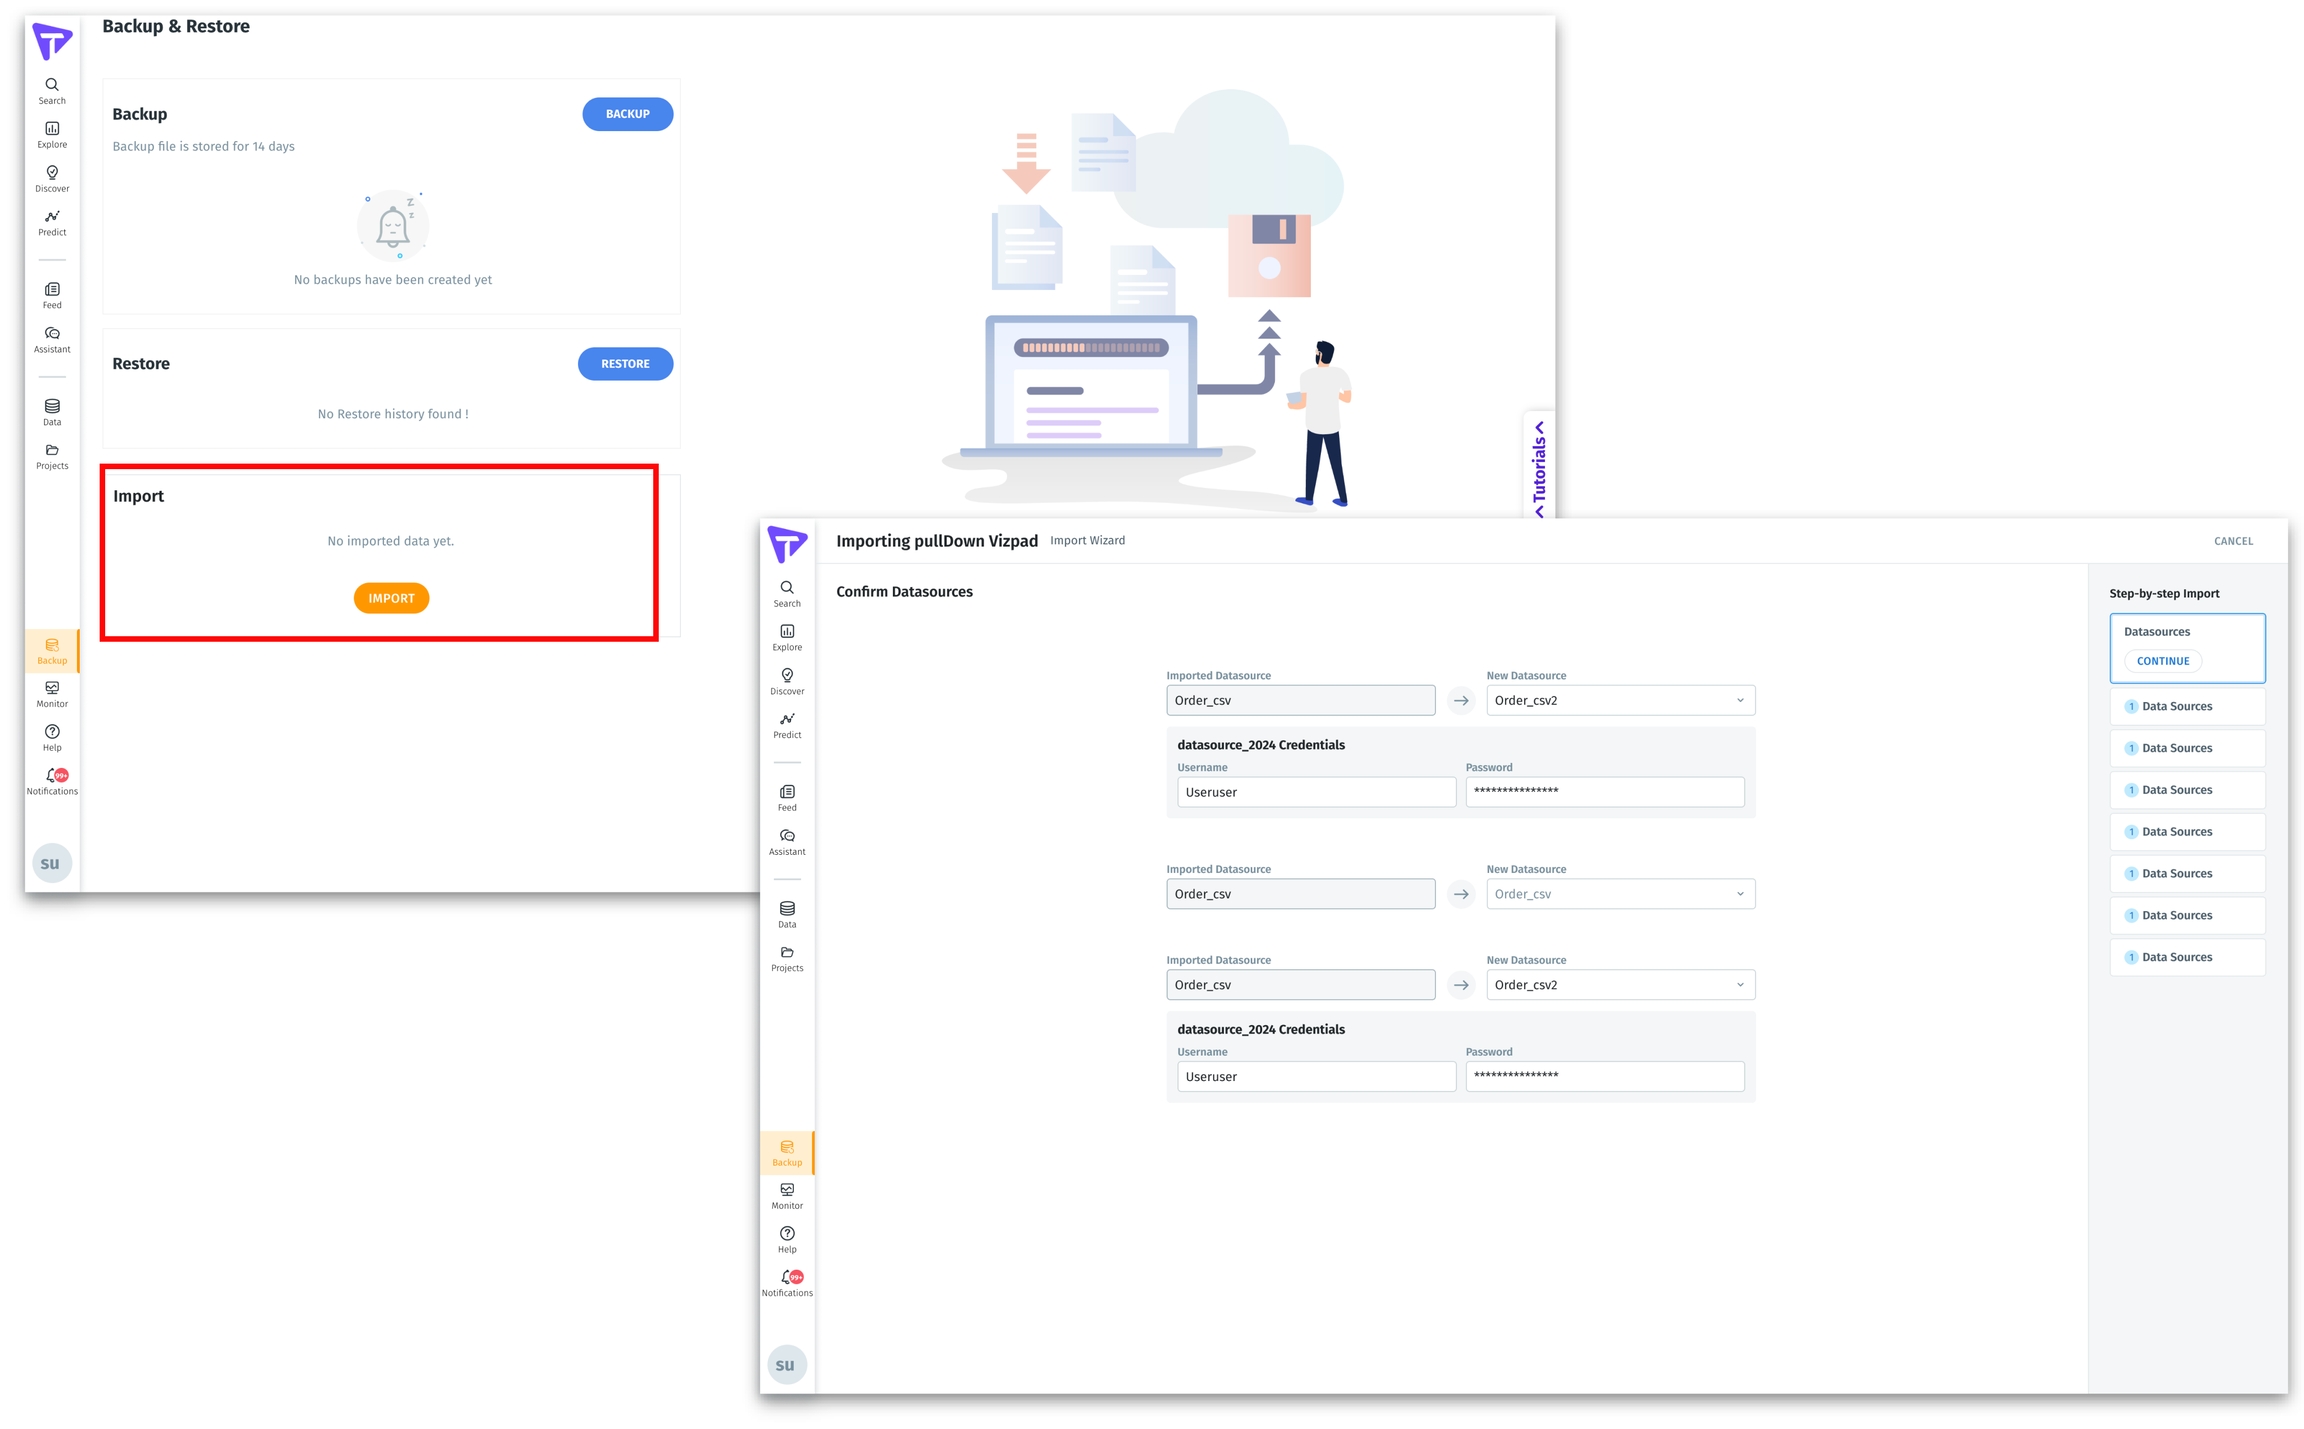
The enhanced metadata migration process simplifies transferring your analytics setup from one environment to another. Users can now easily export and import a wide range of resources, (including data sources, datasets, Business Views, Vizpads, Insights, and ML Models) from one Tellius instance to another (e.g., from development to test to production). Imported items are treated as new resources, ensuring no overwriting of existing data or configurations in the target environment.
Tellius intelligently identifies dependencies between resources. During import, users are provided with tools to map and remap incoming resources to existing ones in the destination instance, ensuring a seamless transition without duplicating existing resources. For example, you can switch from using a dev Snowflake data source to a prod Snowflake data source, ensuring your data reflects the correct environment.
Users are prompted to manually rename resources during the migration process to maintain data integrity and avoid duplicates.
Importing does not carry over data source credentials, enhancing security. Users will need to input credentials in the destination system.
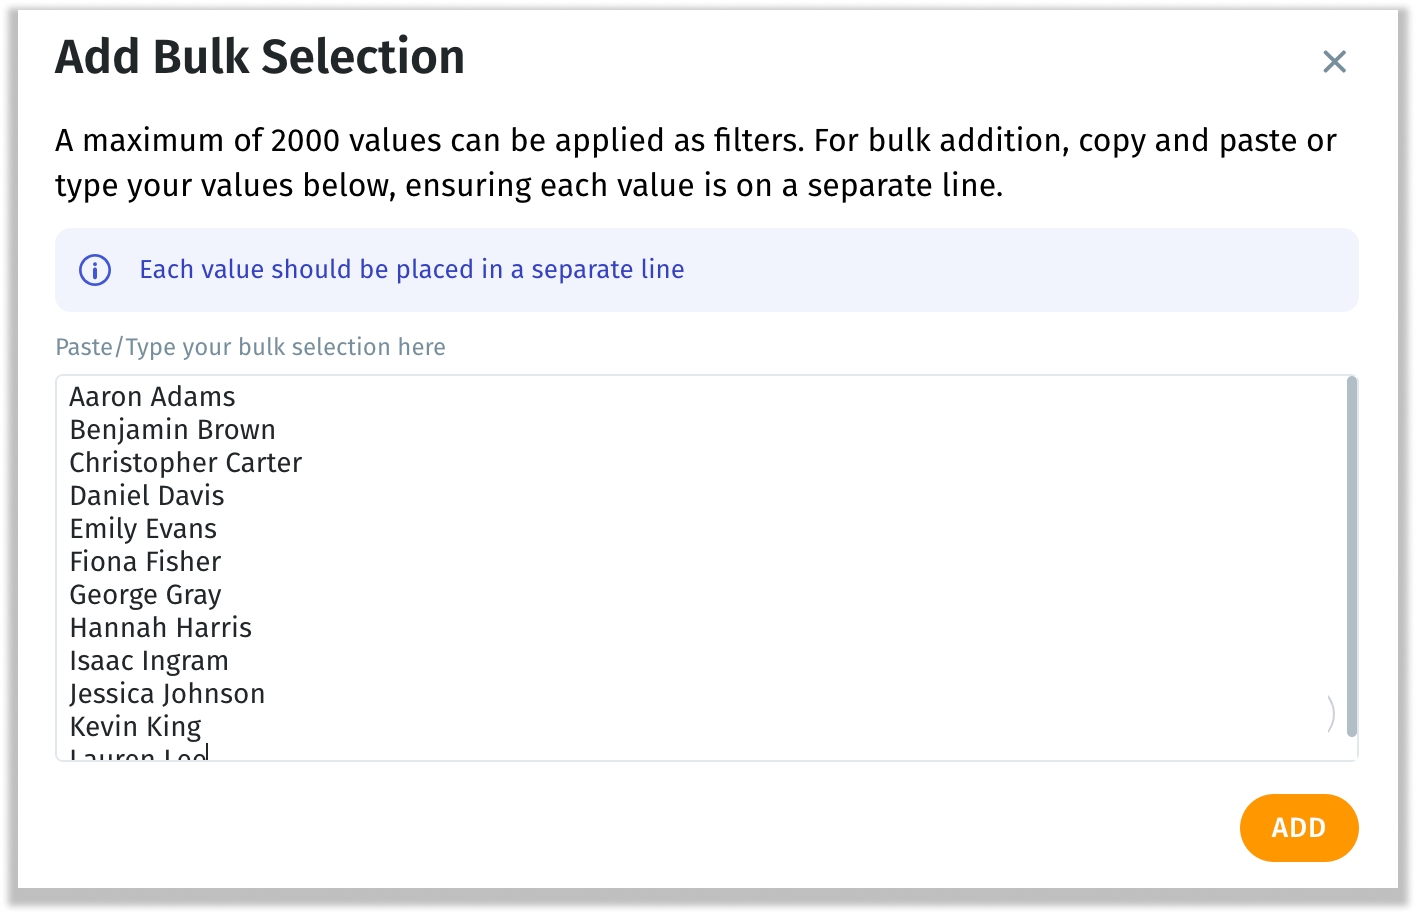
We're excited to bring in a new feature that significantly enhances the filter selection process when dealing with large sets of filter values in Vizpads and Search. This allows users to import bulk filter values, streamlining the process of handling high cardinality columns.
When applying filter values, users will now get the option to import bulk values after selecting the required column and operators. A blank screen is displayed to import or paste values from external sources, where each value will be placed on a separate line.
Once the filter values are input, these values are added as checkbox items in the filter dropdown, which can be further edited if required. This provides an additional layer of control and flexibility over the filtering process.
The bulk selection adheres to the same limit as manual selections, capped at 2000 entries for practicality and performance.
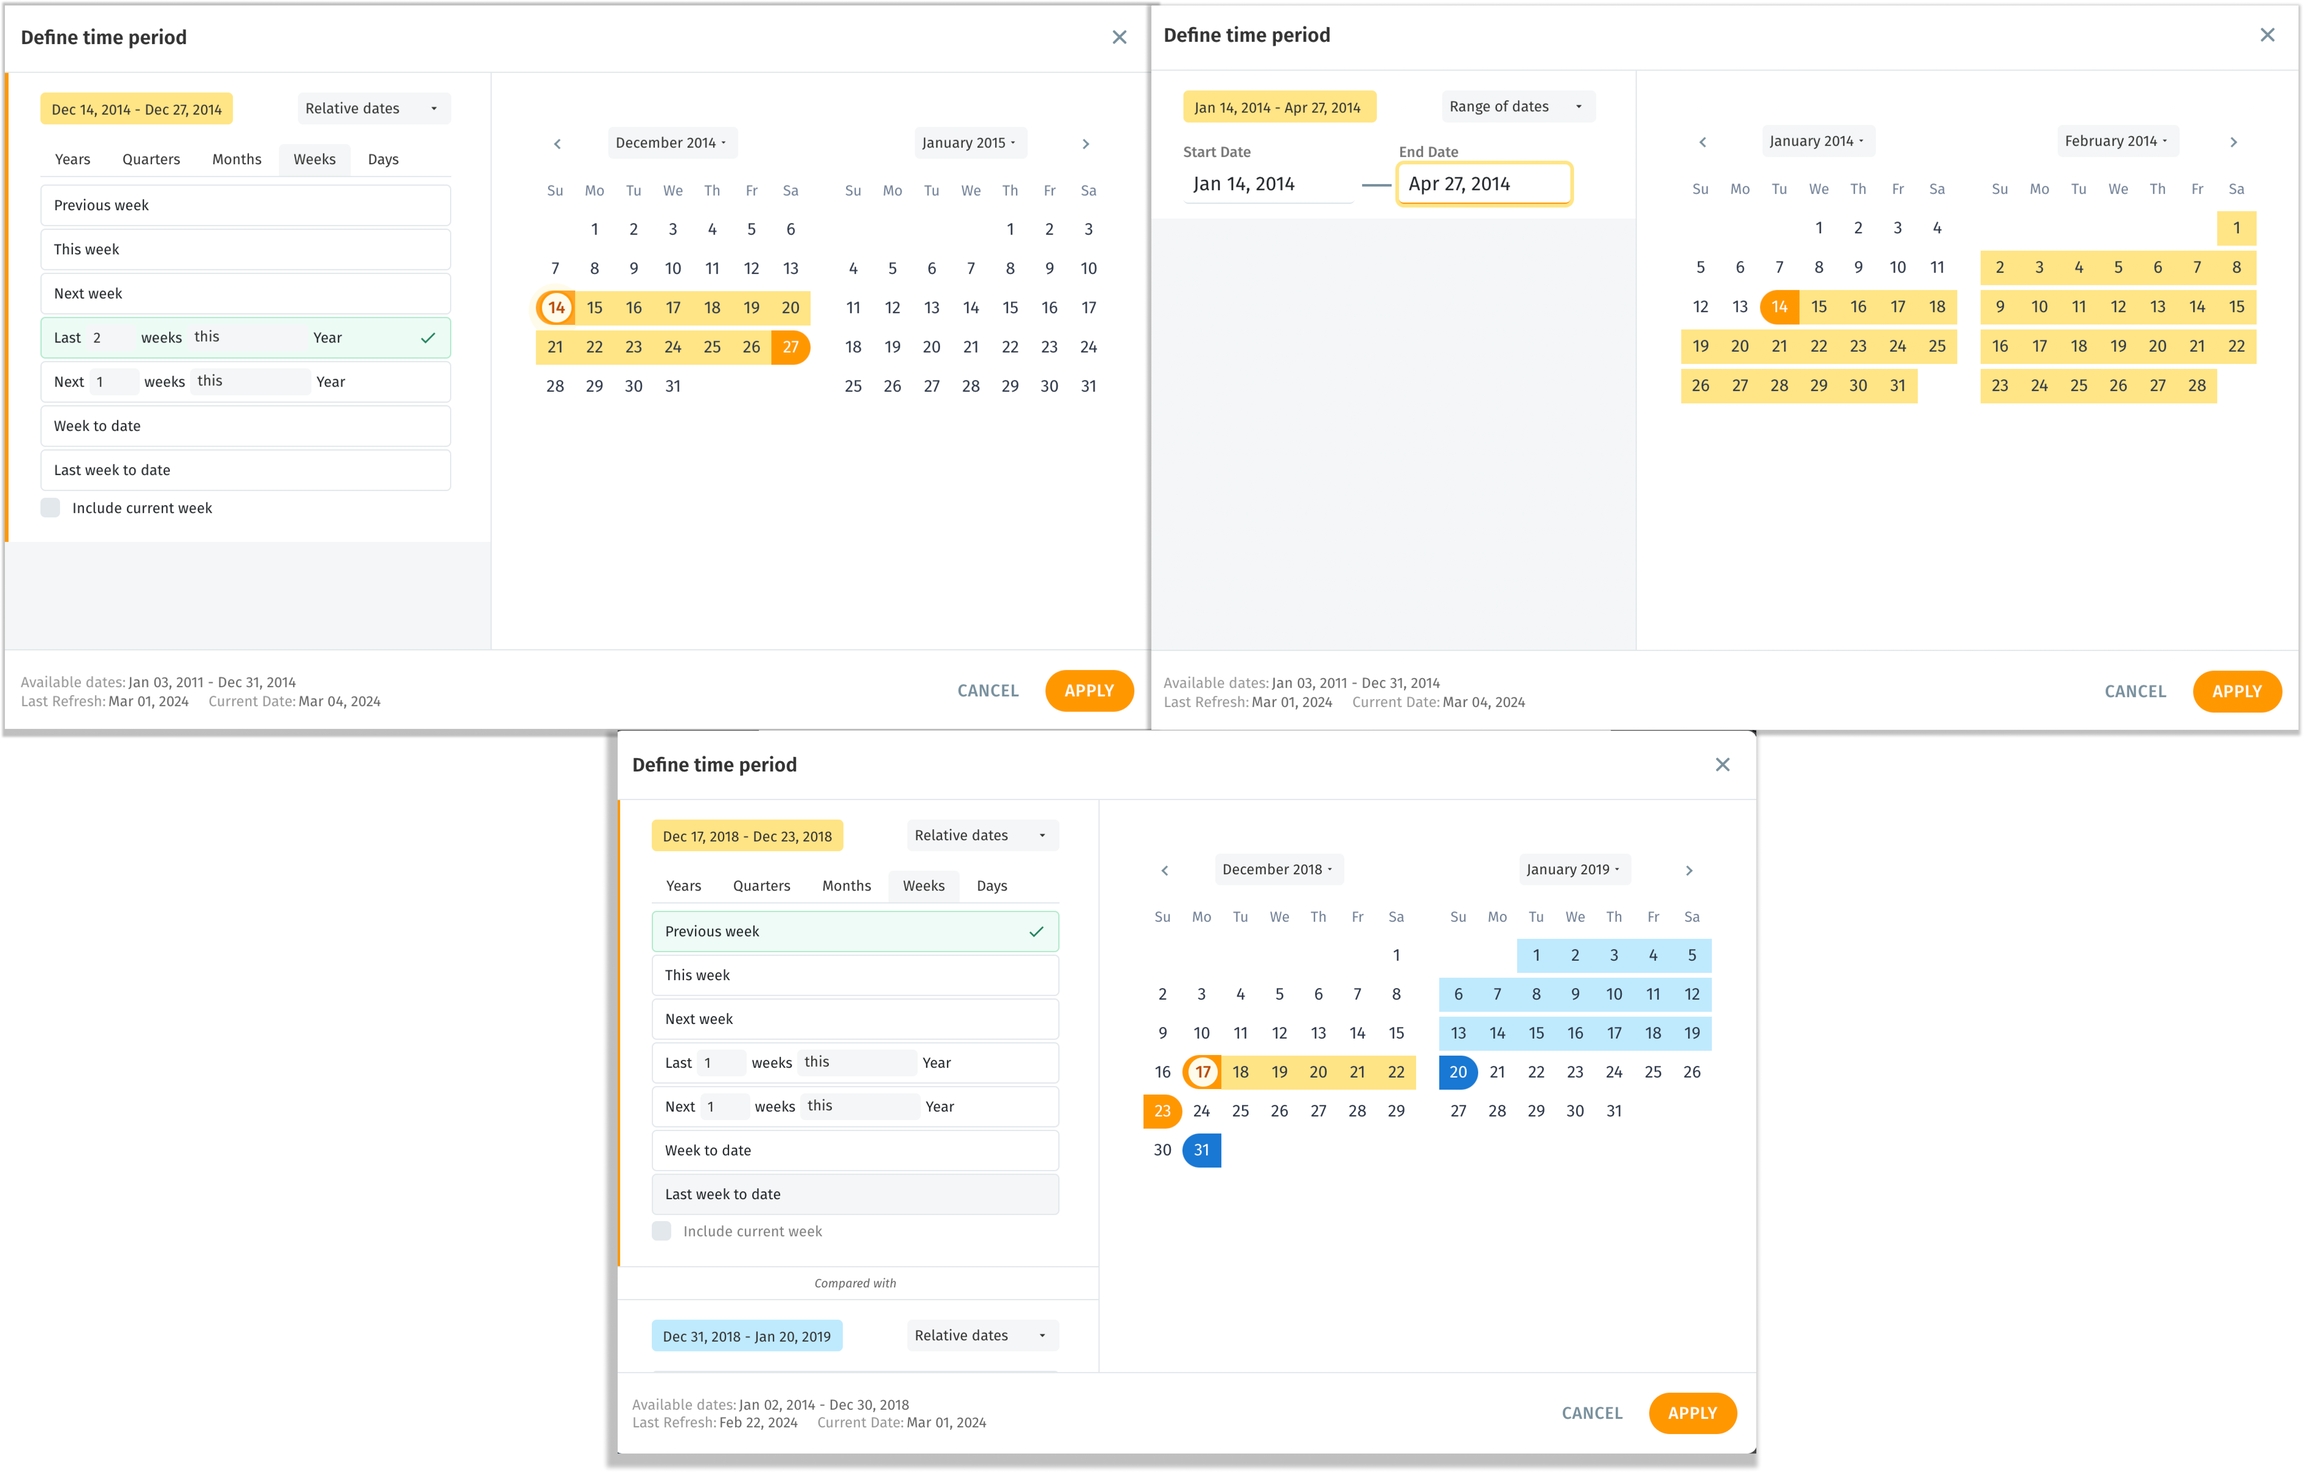
We're thrilled to roll out an enhanced date picker for seamless date range selections. Tailored for efficiency and clarity, this enhancement is aimed at transforming your date selection process.
Two options for selecting date ranges have been included:
Relative dates (for predefined time periods spanning years, quarters, months, weeks, or days)
Range of dates (for user-defined time periods)
Under “Relative dates”, users can select from the versatile predefined time periods as follows:
Previous x
This x
Next x
Last n x
Next n x
X to date
Last x to date
Here, x can be substituted for years/quarters/months/weeks/days. n can denote any number from “1 to n”.
The selected time period can be compared with any of the following:
Same period last year
Preceding period
User-defined time period
For example, users can easily select “last month to date” and compare it against its preceding period.
Once selected, the chosen dates will be highlighted in the calendar, giving a clear visual cue of the selected data range. The time/date picker has been updated across Search, Vizpads, Insights, and Feed, ensuring consistent date selections.
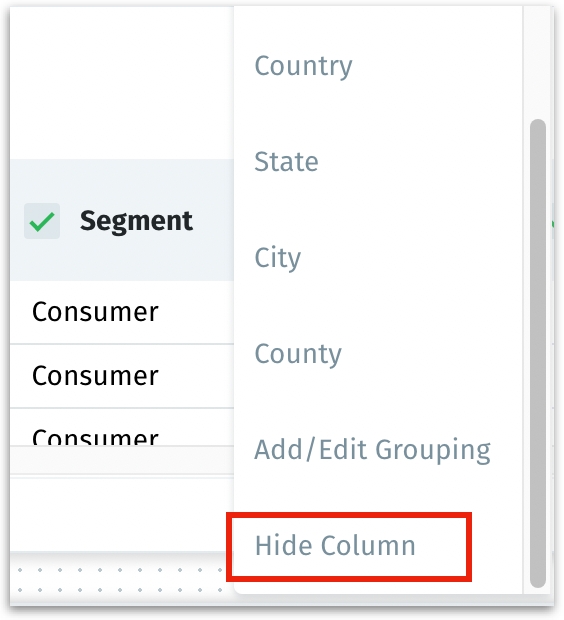
To reduce confusion among users and to enable better control over visible columns, we are introducing a new feature that allows users to hide or unhide columns in Business View.
Under Data → Business View → Edit → Hide Column, users now have the flexibility to hide/unhide required columns in a Business View during data preparation. This is particularly useful for operational columns (e.g., used in calculated columns or table joins) but not necessarily meaningful for end-user analysis.
By default, all columns included in the Business View will be visible. If a column is hidden, that column will not be accessible or displayed across any module in Tellius, ensuring a consistent view across the platform.
If a user hides a column already used in any existing object, the object will continue to render. However, once the column is removed from the object, it cannot be added back, as it won’t appear in the column list.
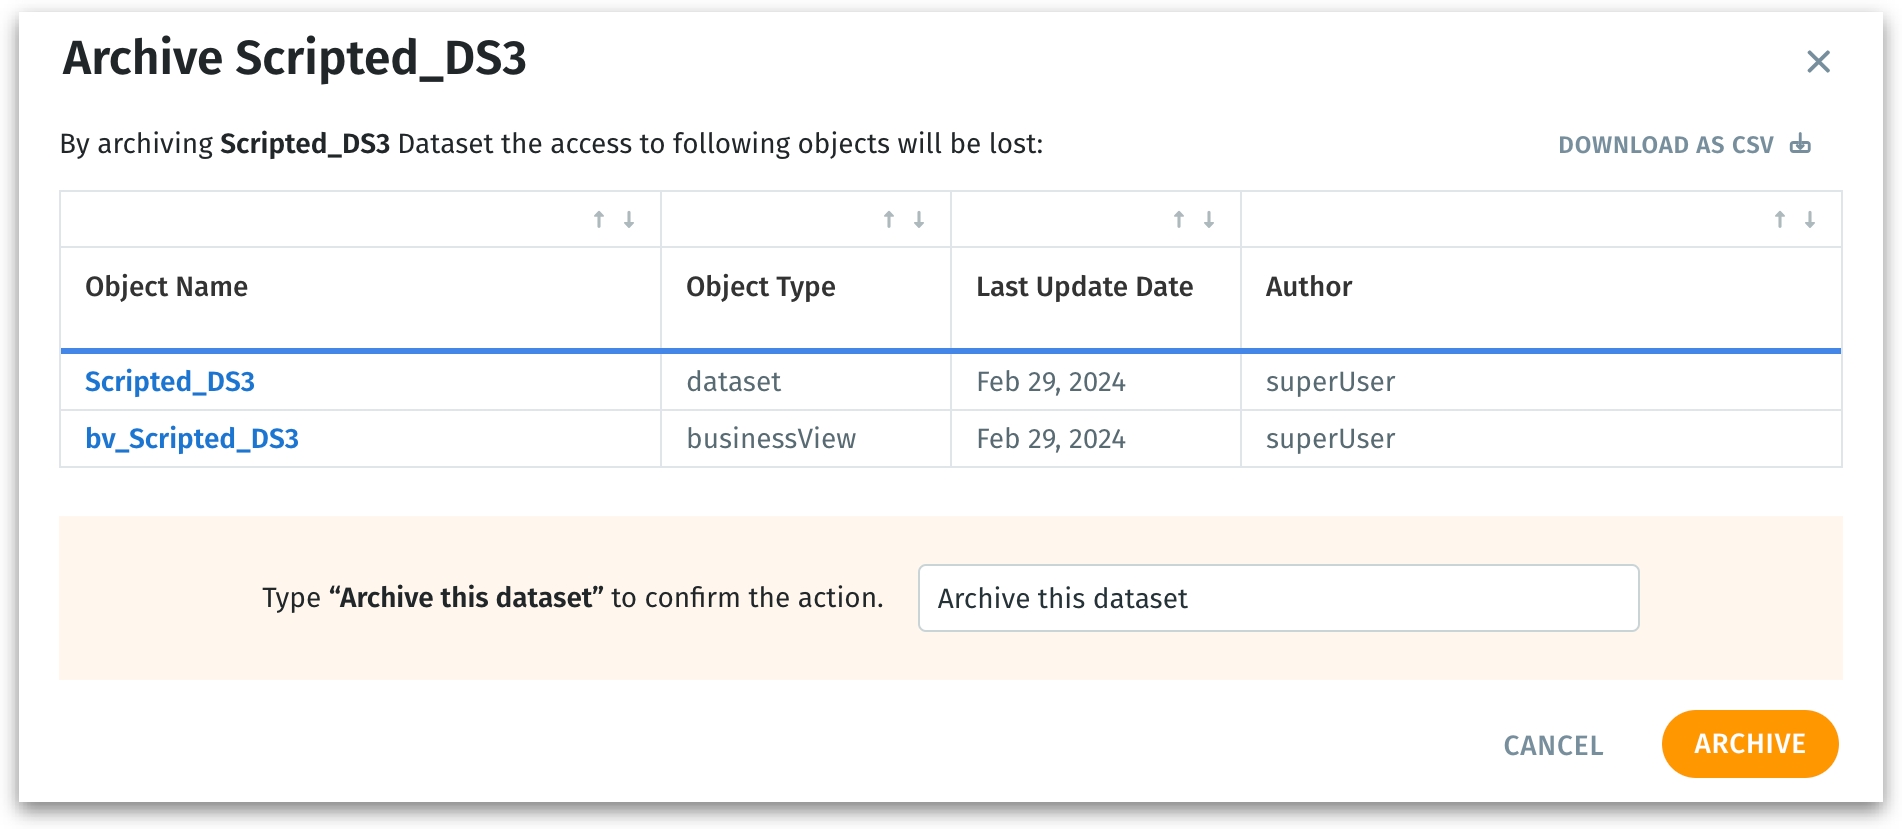
Building on the Permanent Data Storage feature introduced in version 4.3, we are excited to introduce a new “Archiving/Unarchiving” feature that addresses the challenges associated with managing large volumes of data on limited disk storage. This feature allows users to efficiently manage storage by archiving datasets not currently needed, thus freeing up disk space. Users can maintain access to important data without it occupying active storage space and unarchive it when needed for analysis or reporting.
Users can now archive or unarchive datasets directly from the dataset list in the Data module. A warning message with a downloadable CSV file is displayed before archiving, detailing the impact on associated Business Views and objects. While a dataset is archived, only the options to delete and unarchive are available.
Archived datasets appear in a separate category and can only be deleted or unarchived. A blank state with an info message is shown for archived datasets.
Business Views containing archived datasets cannot be used for building new objects but are displayed at the end of the list in a distinct category. Users can delete these Business Views, but “Edit” mode is unavailable. While "Preview" mode is available for archived Business Views, data and other functionalities like learning, calculated columns, and predictions are restricted.
Existing objects like Insights, Models, and Vizpads associated with archived Business Views will be removed and made inaccessible. Archived Business Views will be hidden in various sections (including Search, Vizpads, Insights, Predict, and Feed modules) that list out the Business View, to avoid confusion and maintain data integrity. All associated refresh operations with the dataset will be canceled.
We’ve brought in a few improvements to address issues when columns used in charts or filters are modified/deleted in the Business View. This update enhances the user experience and ensures users are well-informed about the impact of changes made in the associated Business View.
When columns are deleted or renamed in the Business View, the affected objects will not be displayed during the editing phase. Users can publish the Business View without disruptions.
Charts that are directly affected by deleted/modified columns will display a red alert with an error message. The control filters, global filters, and local filters that were affected will feature a red alert icon indicating an error.
In the Configuration pane, columns that have been changed or removed will still appear in various fields but marked with a red alert icon and a message indicating their removal or alteration.
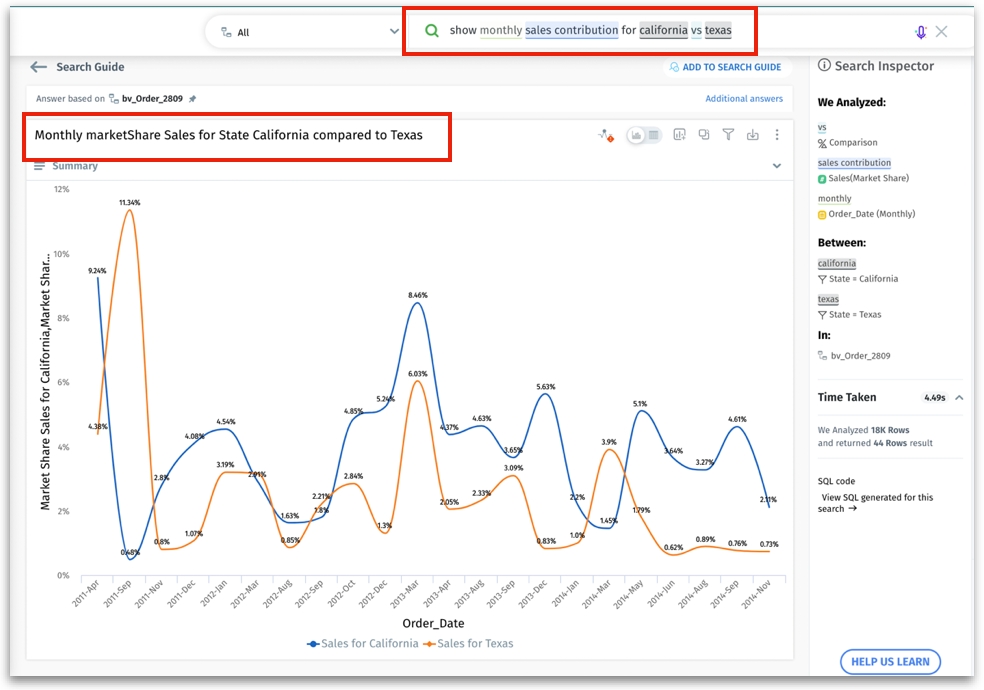
We've significantly enhanced the marketshare query functionality in Search, making it easier and more intuitive for users to interact with marketshare queries.
Users can now type the metric or KPI before the “marketshare” keyword in their queries. For instance, instead of "Show me marketshare sales," users can now input "Show me sales marketshare", aligning more closely with natural language patterns. This updated query format is applicable to all types of marketshare queries, including those with filters, comparisons, and percentage changes. The rest of the query format remains unchanged, ensuring a seamless transition to this more intuitive structure.
We have introduced support for additional keywords synonymous with “marketshare”. Users can now use terms like “Contribution” and “Share” in their queries.
We're excited to bring in significant enhancements to the Benchmark feature in Vizpads.
We’ve introduced two new aggregation options in the Benchmark dropdown: xStddev + xAvg and xStddev - xAvg. These additions help analyze and compare the data, offering a more comprehensive understanding of variability and averages.
Users can name the benchmarks and add more than one benchmark line to their charts. In the “Custom aggregation” section, users can define the required aggregation and associated formula.
The following improvements focus on enhancing user control and clarity in growth charts for a more intuitive and user-friendly experience.
During the chart rendering process for growth charts containing multiple elements, color coordination will be applied to indicate a visual link between bars and lines. The colors of lines will automatically match with the corresponding bars, clarifying the relationship between actual values (bars) and growth trends (lines).
In the Configuration panel, using the checkbox “Turn off absolute values”, users can now choose to show or hide absolute values in growth charts. By default, absolute values will be displayed.
This update solves the challenges users face with row-level formulas in DataFrame construction and editing. Previously, users encountered issues when editing formulas that depended on others created later in the sequence. This was due to the SQL being generated in the order of formula creation, leading to invalid SQL outputs when dependencies were not properly managed.
For example, imagine you have two formulas: Formula A (for Total Salary) and Formula B (for Bonus), with B referencing A. If you edit A to include B (Total Salary = Base Salary + Bonus) before creating B, you might end up with an invalid SQL since B hasn't been defined yet.
Now, regardless of when you create or edit a formula, Tellius automatically adjusts the SQL generation order, allowing you to effortlessly create and edit formulas without worrying about the order of creation.
In addition, Tellius now supports nested formulas at any level, allowing for greater flexibility and complexity in calculations. Users can build and edit formulas, knowing that even the most complex nested dependencies will be seamlessly handled by the system.
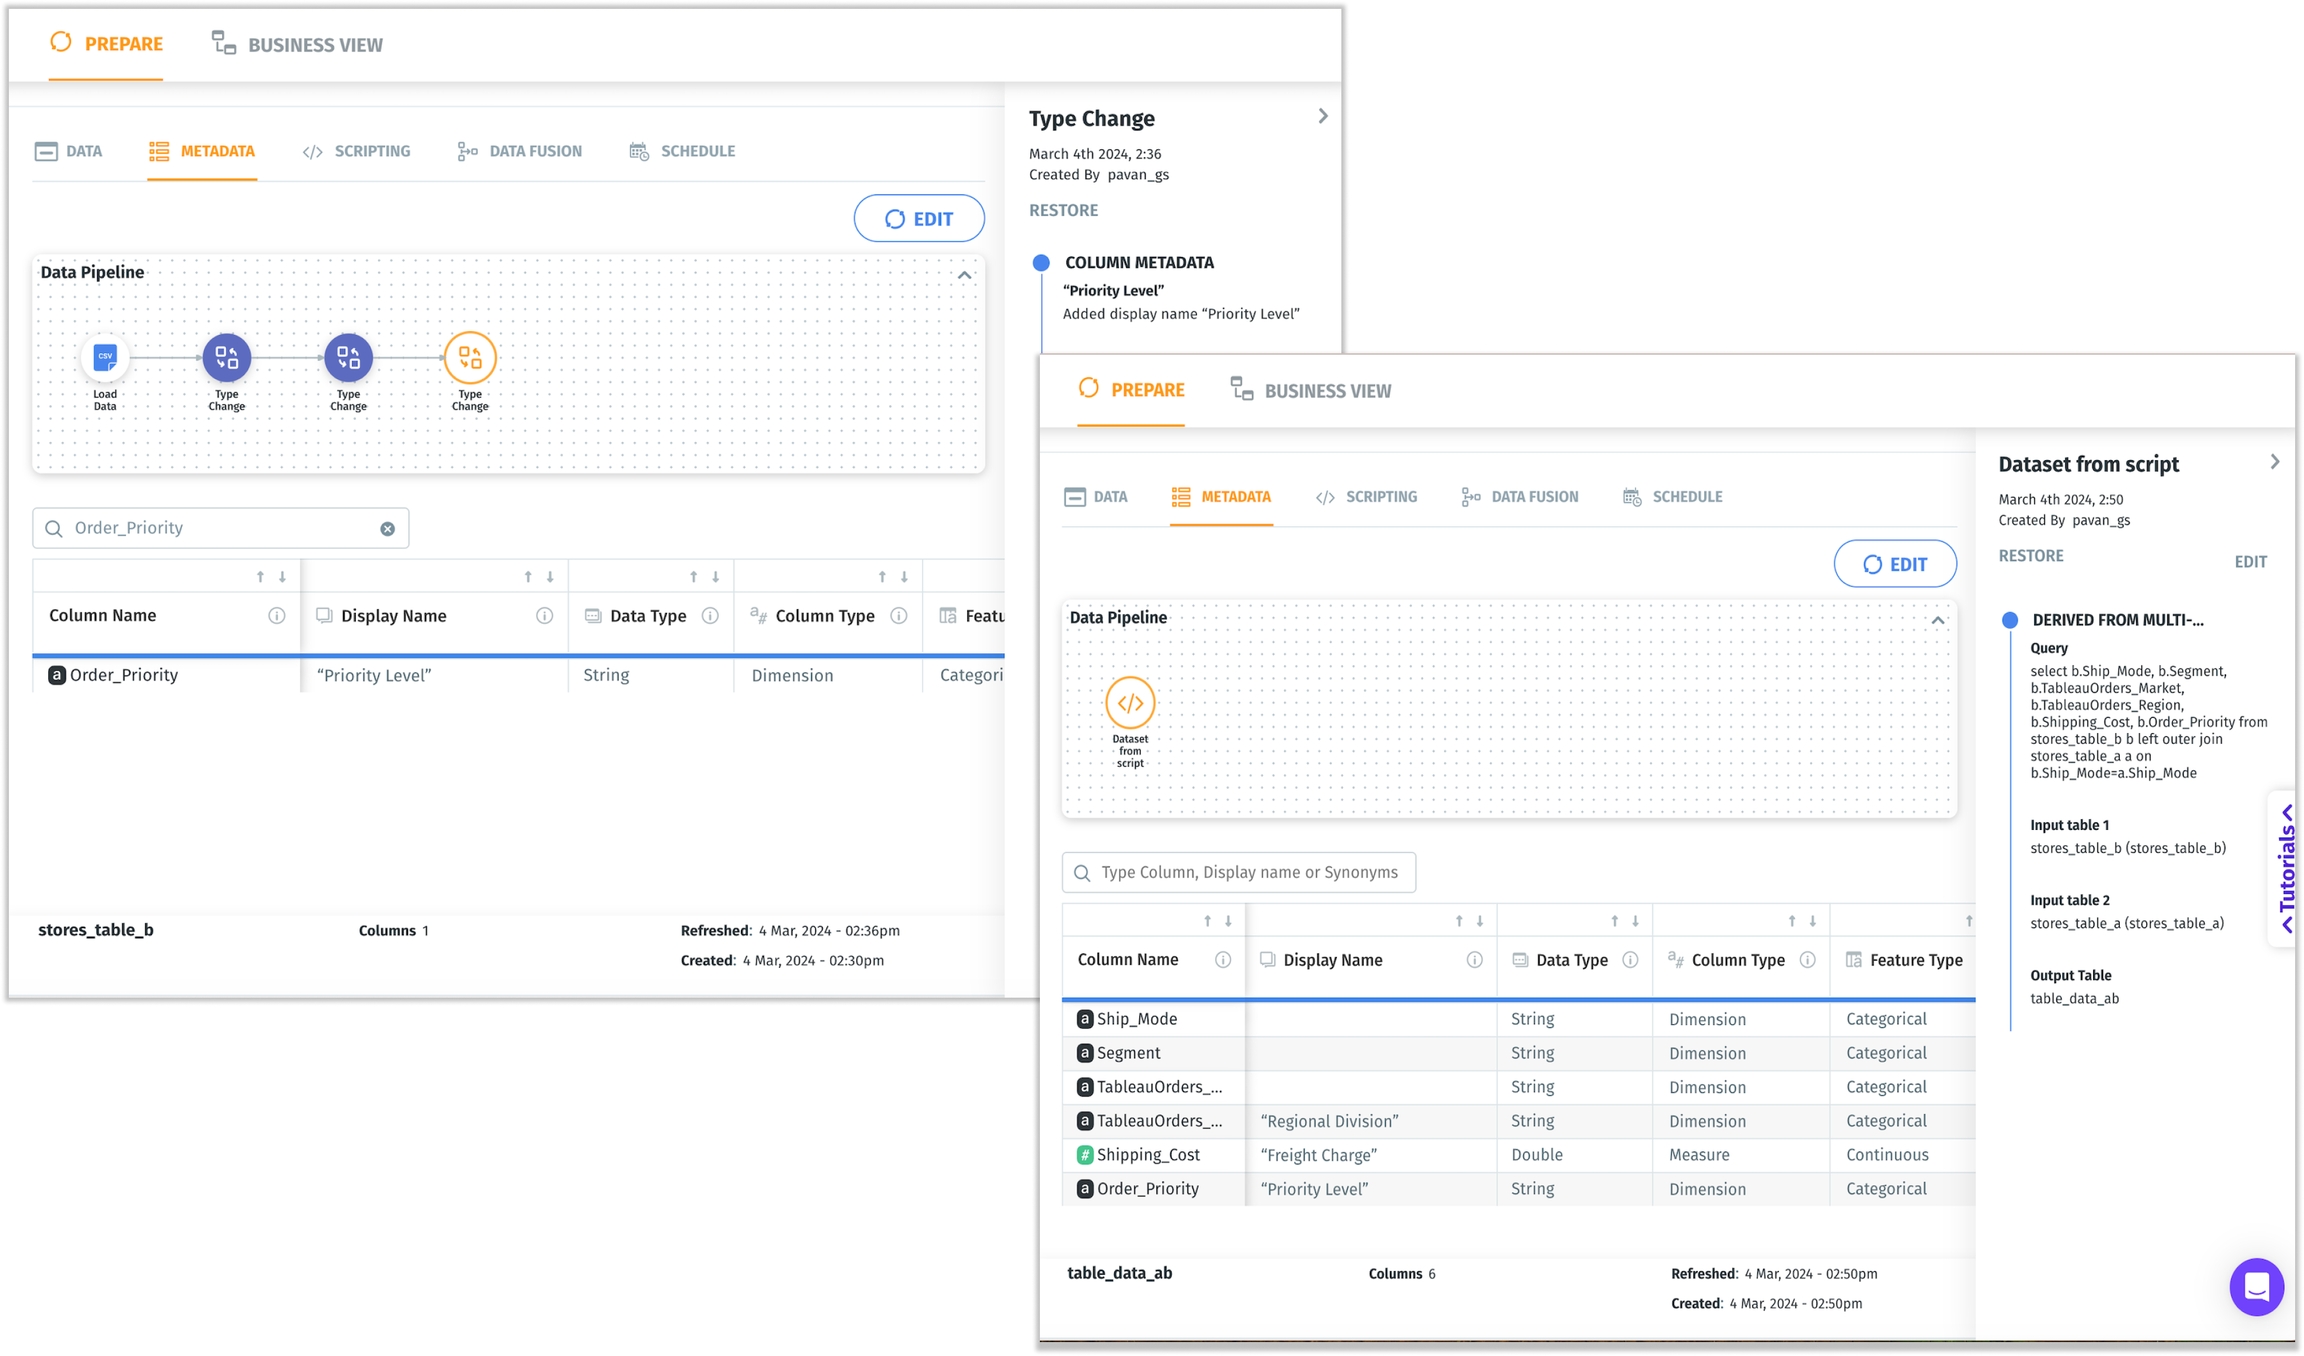
To enhance user efficiency, we've refined the process of creating scripted datasets. Previously, when a scripted dataset was generated, the associated metadata—such as display names, column descriptions, and synonyms—did not carry over, requiring manual re-entry. With this improvement, metadata from the source table will now be automatically mapped to the scripted dataset, provided column names have not been modified via aliases.
In cases where the same column names exist across multiple datasets, the system will automatically pick the metadata from the first matching dataset in the list, ensuring a consistent replication process.
It also includes an option to replicate existing metadata during the creation of a scripted dataset. The following metadata attributes will be copied to the output columns of the scripted dataset:
Synonyms
Display Name
Description
Exclusion settings for Insights/Predict functions
Index Column designation
Default Aggregation settings
Data Format specifications
This enhancement saves hours of effort, streamlining the creation and maintenance of datasets within Tellius.
In Search and Vizpads, users can now choose to include or exclude zero values in all types of table charts (including regular, detailed, and pivot tables) for enhanced clarity and interpretation.
When the “Include zero values” option is enabled in the Configuration pane, null or empty fields in the table will automatically be replaced with zeros. Once set, the “Include zero values” preference will be consistently applied across various actions, including exporting the chart, saving in Vizpad, or adding the chart from Search to Vizpad.
Users can now save charts from Search or Insights directly to a specific tab in a Vizpad. After clicking on “Add to Vizpad”, users can choose either an existing tab with available space (under the 25-chart limit with display capacity) or create a new tab for their charts. Alongside the Vizpad name, additional details such as the associated Project, the creator of the Vizpad, and the last modified date are now displayed to help users select the most appropriate Vizpad for their needs.
After adding a chart to a Vizpad, users are offered an option to directly navigate to the newly updated or created Vizpad. This allows for better organization and ease of access to saved charts.
Users can now choose the type of aggregation for calculating percentage change and absolute change directly in Vizpad. A dropdown menu has been added within the absolute change and percentage change popups, allowing users to select from Sum, Avg, Min, Max, Median, Count, and Unique Count aggregations. To ensure backward compatibility, pre-existing charts in Vizpad will be automatically updated to reflect the aggregation method previously used.
We've restored the ability to trigger Insights directly from Search. Tellius can smartly recognize user intent in various query formats, such as Trend Insight, Segment Discovery, and Cohort Insight, and configure them for relevant insights with prefilled parameters like target, time period, and filters.
Users can now include Insight-based queries while editing the Search guide. These queries are identified as Insights, and an empty state is shown in the bottom preview section due to the absence of live preview results. Upon selecting an Insights query, users are directed to an editable Insights configuration screen to fine-tune their query parameters.
To provide users with immediate contextual information about their Business Views, we’ve brought in an enhancement that displays the description of Business Views across Tellius. Users can hover over a Business View in different modules, including Search, Vizpads, Insights, Predict, Feed, Assistant, and Data, to see a short description of the data it contains. This feature is particularly useful for users to quickly understand the scope of the Business View they’re working with.
Since the “Refresh” button in Search Guide updates only auto-generated queries, hovering over it will now display a tooltip: "Updates auto-generated queries only, not the user-personalized ones.”
In Google Analytics, when hovering over any dimension or metric in the dropdown, users will see a tooltip displaying the full name of the field, ensuring clarity and ease of use, especially when dealing with longer field names.
When live Insights are triggered from charts or Insights, and if no contributors are found, a warning message will be displayed to the users instead of a blank screen.
In Google Analytics, fixed the issue with filtering and promptly displaying only the View IDs as per the search term.
Charts added from the WHAT/WHY sections in trend or comparison insights to Vizpad are now fully interactable. Users can edit aggregations, filters, and other elements of these charts, offering greater flexibility and customization.
Users can now include spaces in the names of column groups.
In the Data tab, we have introduced “Swap datasource”, which allows users to for each loaded dataset or table. While choosing the required data source to swap, it is critical to make sure that the table/view name and column names of the two data sources remain consistent.