🐣Preparing your datasets
Prepare and refine your datasets in Tellius using transformations, metadata editing, scripting, fusion, and scheduling to make your data analytics-ready and well-organized.
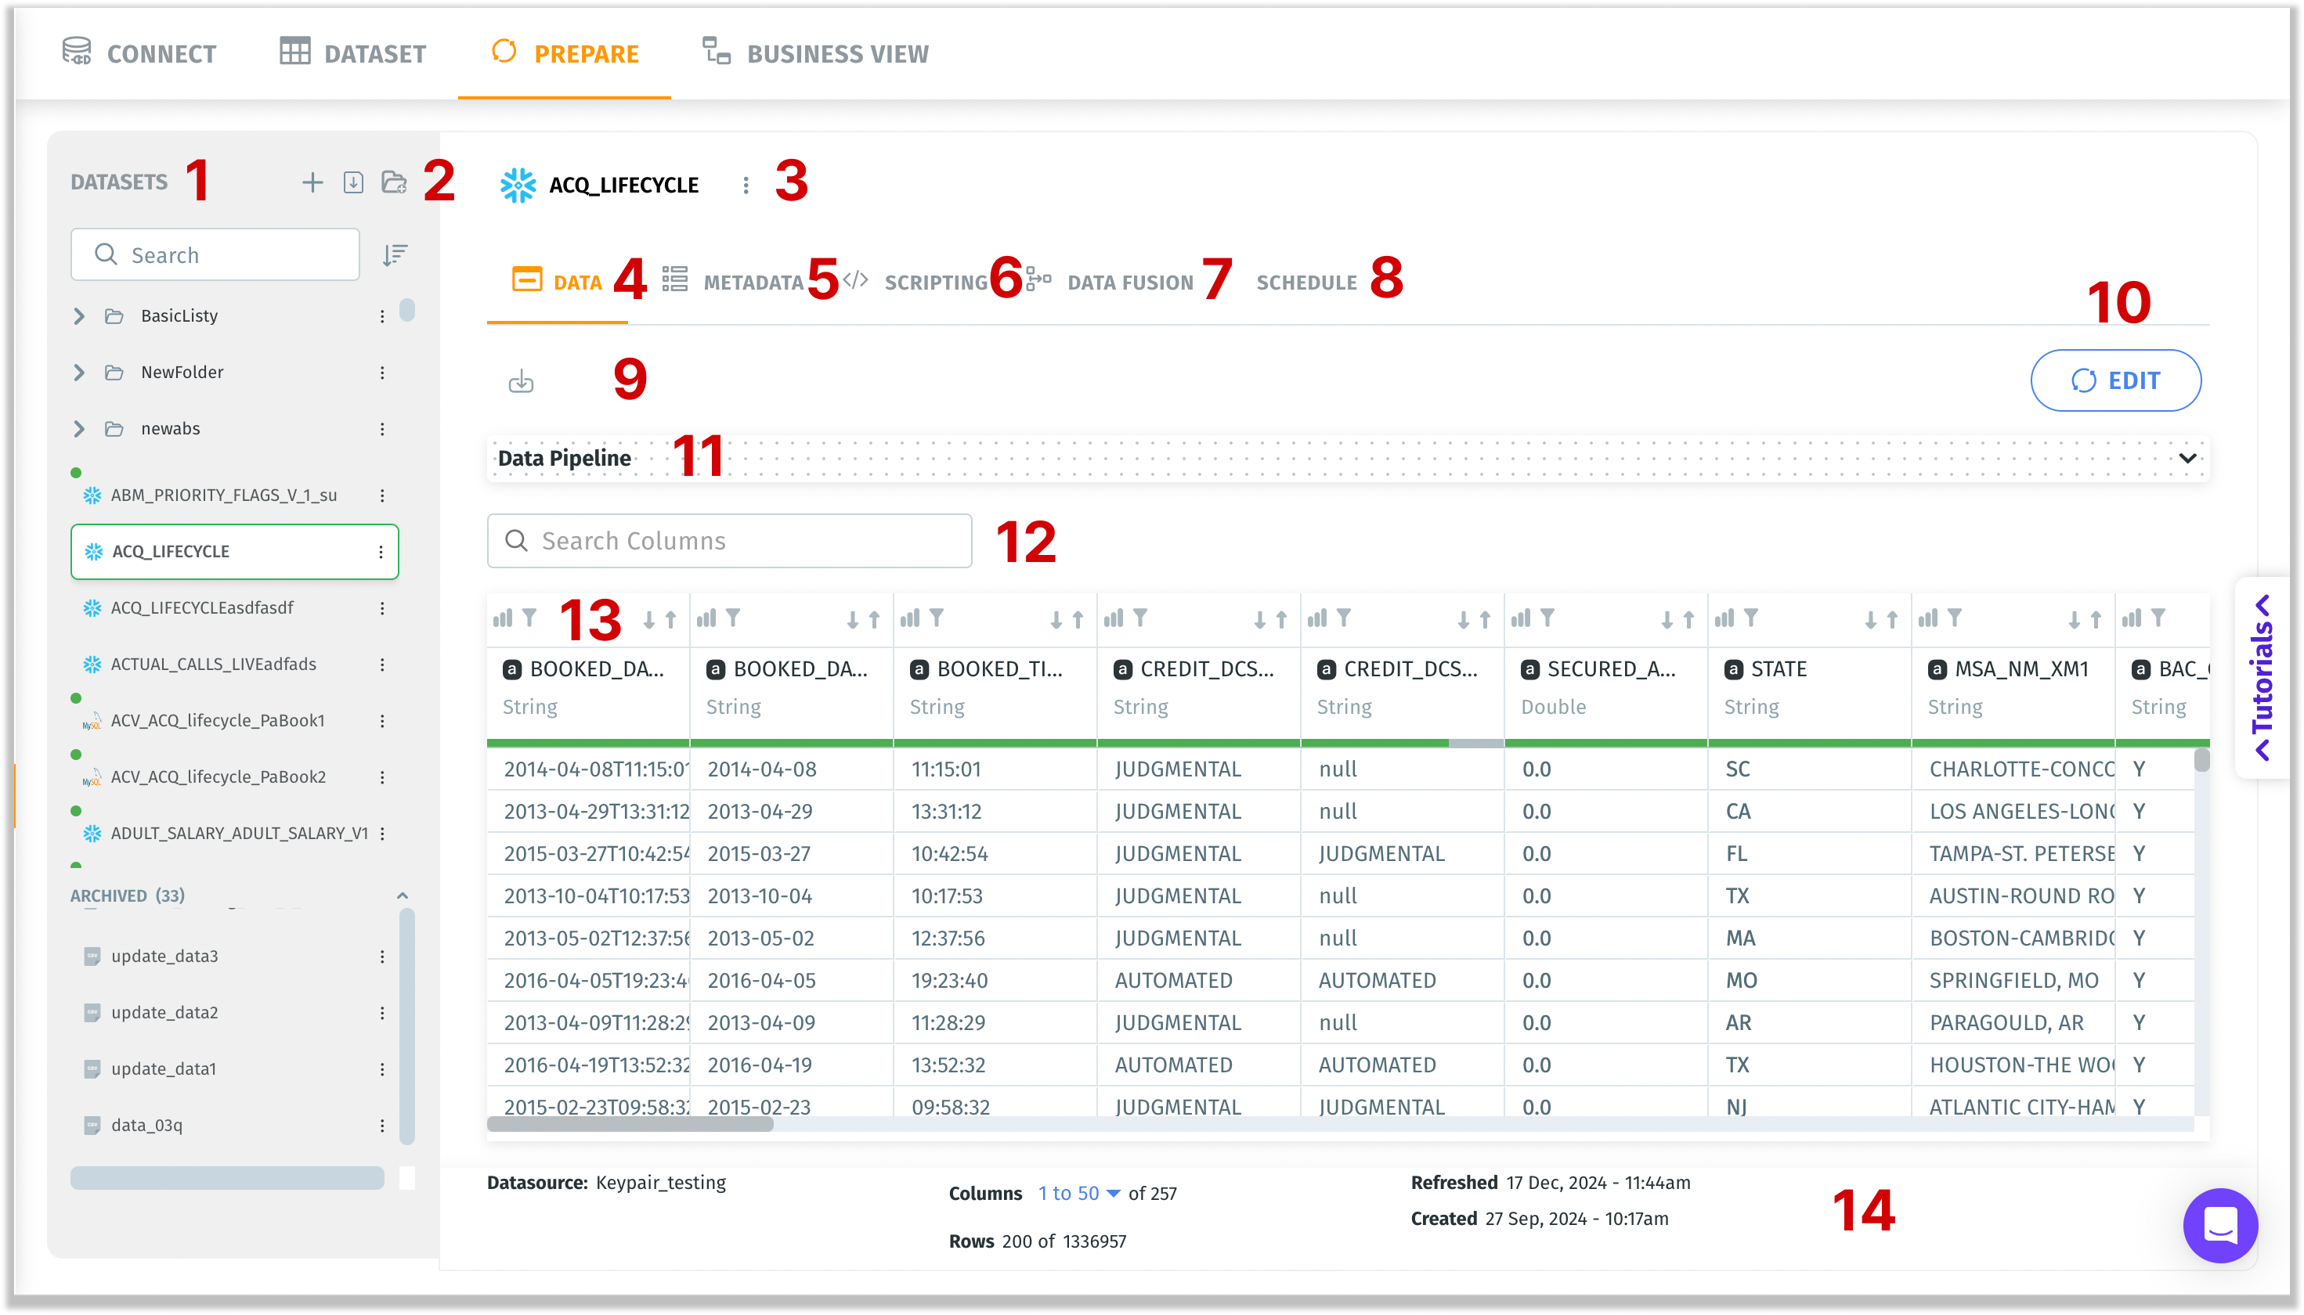
Once you’ve created or imported a dataset (through Connect), you can refine, transform, and organize it under the Prepare module. The left-hand panel lists available datasets and folders, while the central workspace offers specialized tabs: Data, Metadata, Scripting, Data Fusion, and Schedule. Each tab serves a unique purpose in preparing your data for analytics.

Datasets: A list of datasets created. This left pane allows you to quickly search and sort datasets or folders by name.
Datasets can be organized into folders.
The icon of each dataset indicates the datasource type (e.g., Snowflake vs. CSV). Live datasets are indicated with a green dot.
The archived folder at the end contains older or deprecated datasets. You can still access them but they’re separated for clarity.
Click a folder to expand or collapse its contents.
Select a dataset to open it in the central Prepare workspace.
Select dataset author(s): Superusers can filter data assets by who created them using the Author filter. This filter is available across the Dataset, Prepare, and Business View tabs within the Data module. When you click the Author dropdown, it displays a list of all users who have created assets in that tab. Select one or more authors to filter the list to only show assets created by those users. Click Reset to clear the filter and return to the full list.

Displays the following options:
Create a new dataset: On clicking this button, you will be redirected to Data → Connect. For more details, please check out this section.
Import dataset: Click on this button to import the required dataset. (Only .zip files are allowed to import)
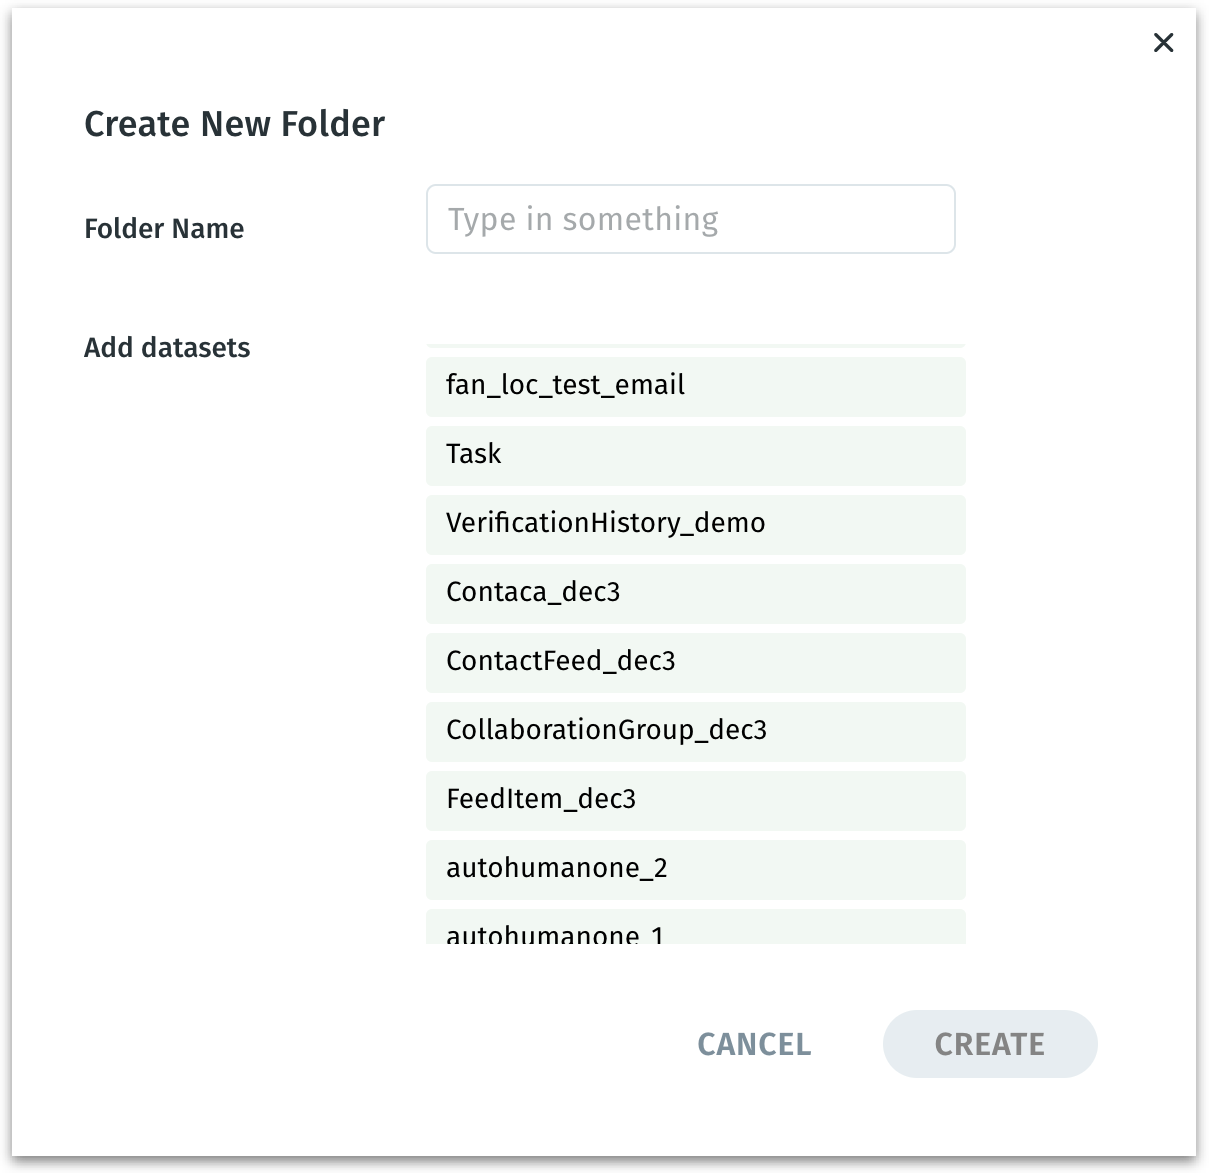
Create a new folder: Creates a new folder to categorize the datasets. Provide a relevant name and add the required datasets from the available list.

New folder creation for datasets Actions performed on a dataset: Click on the three-dot kebab menu and the following menu will be displayed. For more details, please check out this page.
Data tab: Displays all the datasets, allowing you to add or modify transformation nodes (SQL, Python, type changes) and perform data preparation actions.
Metadata tab: Here, you can
Add user-friendly display names (e.g., “Booking Date” instead of
BOOKED_DATE), synonyms, and descriptions to columns.
If you use Kaiya feature (where enabled), you can auto-generate synonyms, display names, and desciptions for large sets of columns.
Choose relevant data types (string, numeric, date/time) to ensure proper aggregations. For example, if
BOOKED_DATEis incorrectly typed as string, you can’t do date-based filtering or time-series analysis properly.Assign measures (numeric fields), dimensions (for grouping or filtering), and date columns. For more details about the distinction, check out this page.
Scripting tab: After verifying metadata, you might need advanced transformations that exceed basic pipeline nodes. For example, you want to:
Add custom columns with SQL or Python.
Join multiple datasets (often more than two) based on business rules.
Aggregate or filter big data beyond what’s feasible in a single pipeline step.
Data Fusion tab: Data fusion is intended for simpler merges, typically merging exactly two datasets in a point-and-click fashion, without writing SQL.
Schedule: Use the Schedule option to refresh and keep your data in sync with the most up-to-date information available. A user can choose from a set of refresh modes and have flexibility in setting the refresh schedule.
Export (Writeback): Think of this as “saving” the cleaned or transformed dataset outside of Tellius. Depending on which connector you pick, you’ll either generate a local file (e.g., CSV) or publish it to an external system (e.g., HDFS, Snowflake etc.). For more details, check out this page.
Edit: Transforms the page into Edit mode where you can edit and apply transformations to the selected dataset. For more details, check out this page.
Pipeline: Visual representation of transformations or nodes that have been applied to the dataset.
If you click Edit, this area will show your pipeline steps (e.g., an SQL node, Python node, or partitioning settings).
Search Columns: Quickly filters the displayed columns by typing part of the name or label.
Column headers: Displays each column in the selected dataset where you can sort the columns or apply filters on the fly. For more details on editing the dataset, check out this page.
Footer: Displays the datasource name, preview of the dataset rows and columns. Also, it displays the timestamps indicating the last dataset refresh and the dataset creation.
Last updated
Was this helpful?