🤹Kaiya conversational AI
Explore data with Kaiya, the conversational AI in Tellius that answers natural-language queries, learns from feedback, and delivers instant insights.
Welcome to Kaiya, your AI-powered conversational analytics assistant! Kaiya is transforming the way you search, explore, and analyze your data by making it as simple as having a conversation. Kaiya empowers everyone, from data experts to business users, to uncover insights and make data-driven decisions.
With Kaiya, you can:
Explore your data just by typing or speaking your queries in plain language.
Receive AI-powered analytical results in seconds.
Quickly access key metrics, trends, and anomalies without the need for technical expertise.
Kaiya remembers your preferences, learns from your feedback, and adapts to your habits, ensuring a more personalized experience over time.
Apply filters and summarize the results as required.
This guide will show you how to use Kaiya seamlessly, maximize its capabilities, and adopt best practices to help you get the most out of Kaiya.
The more you use Kaiya, the smarter it becomes—learning from your preferences, patterns, and feedback to deliver insights tailored just for you. Let’s dive in and explore how conversational search is revolutionizing the way we interact with data!
How-to guide
Click on the Kaiya icon in the left pane. The following screen will be displayed to you.
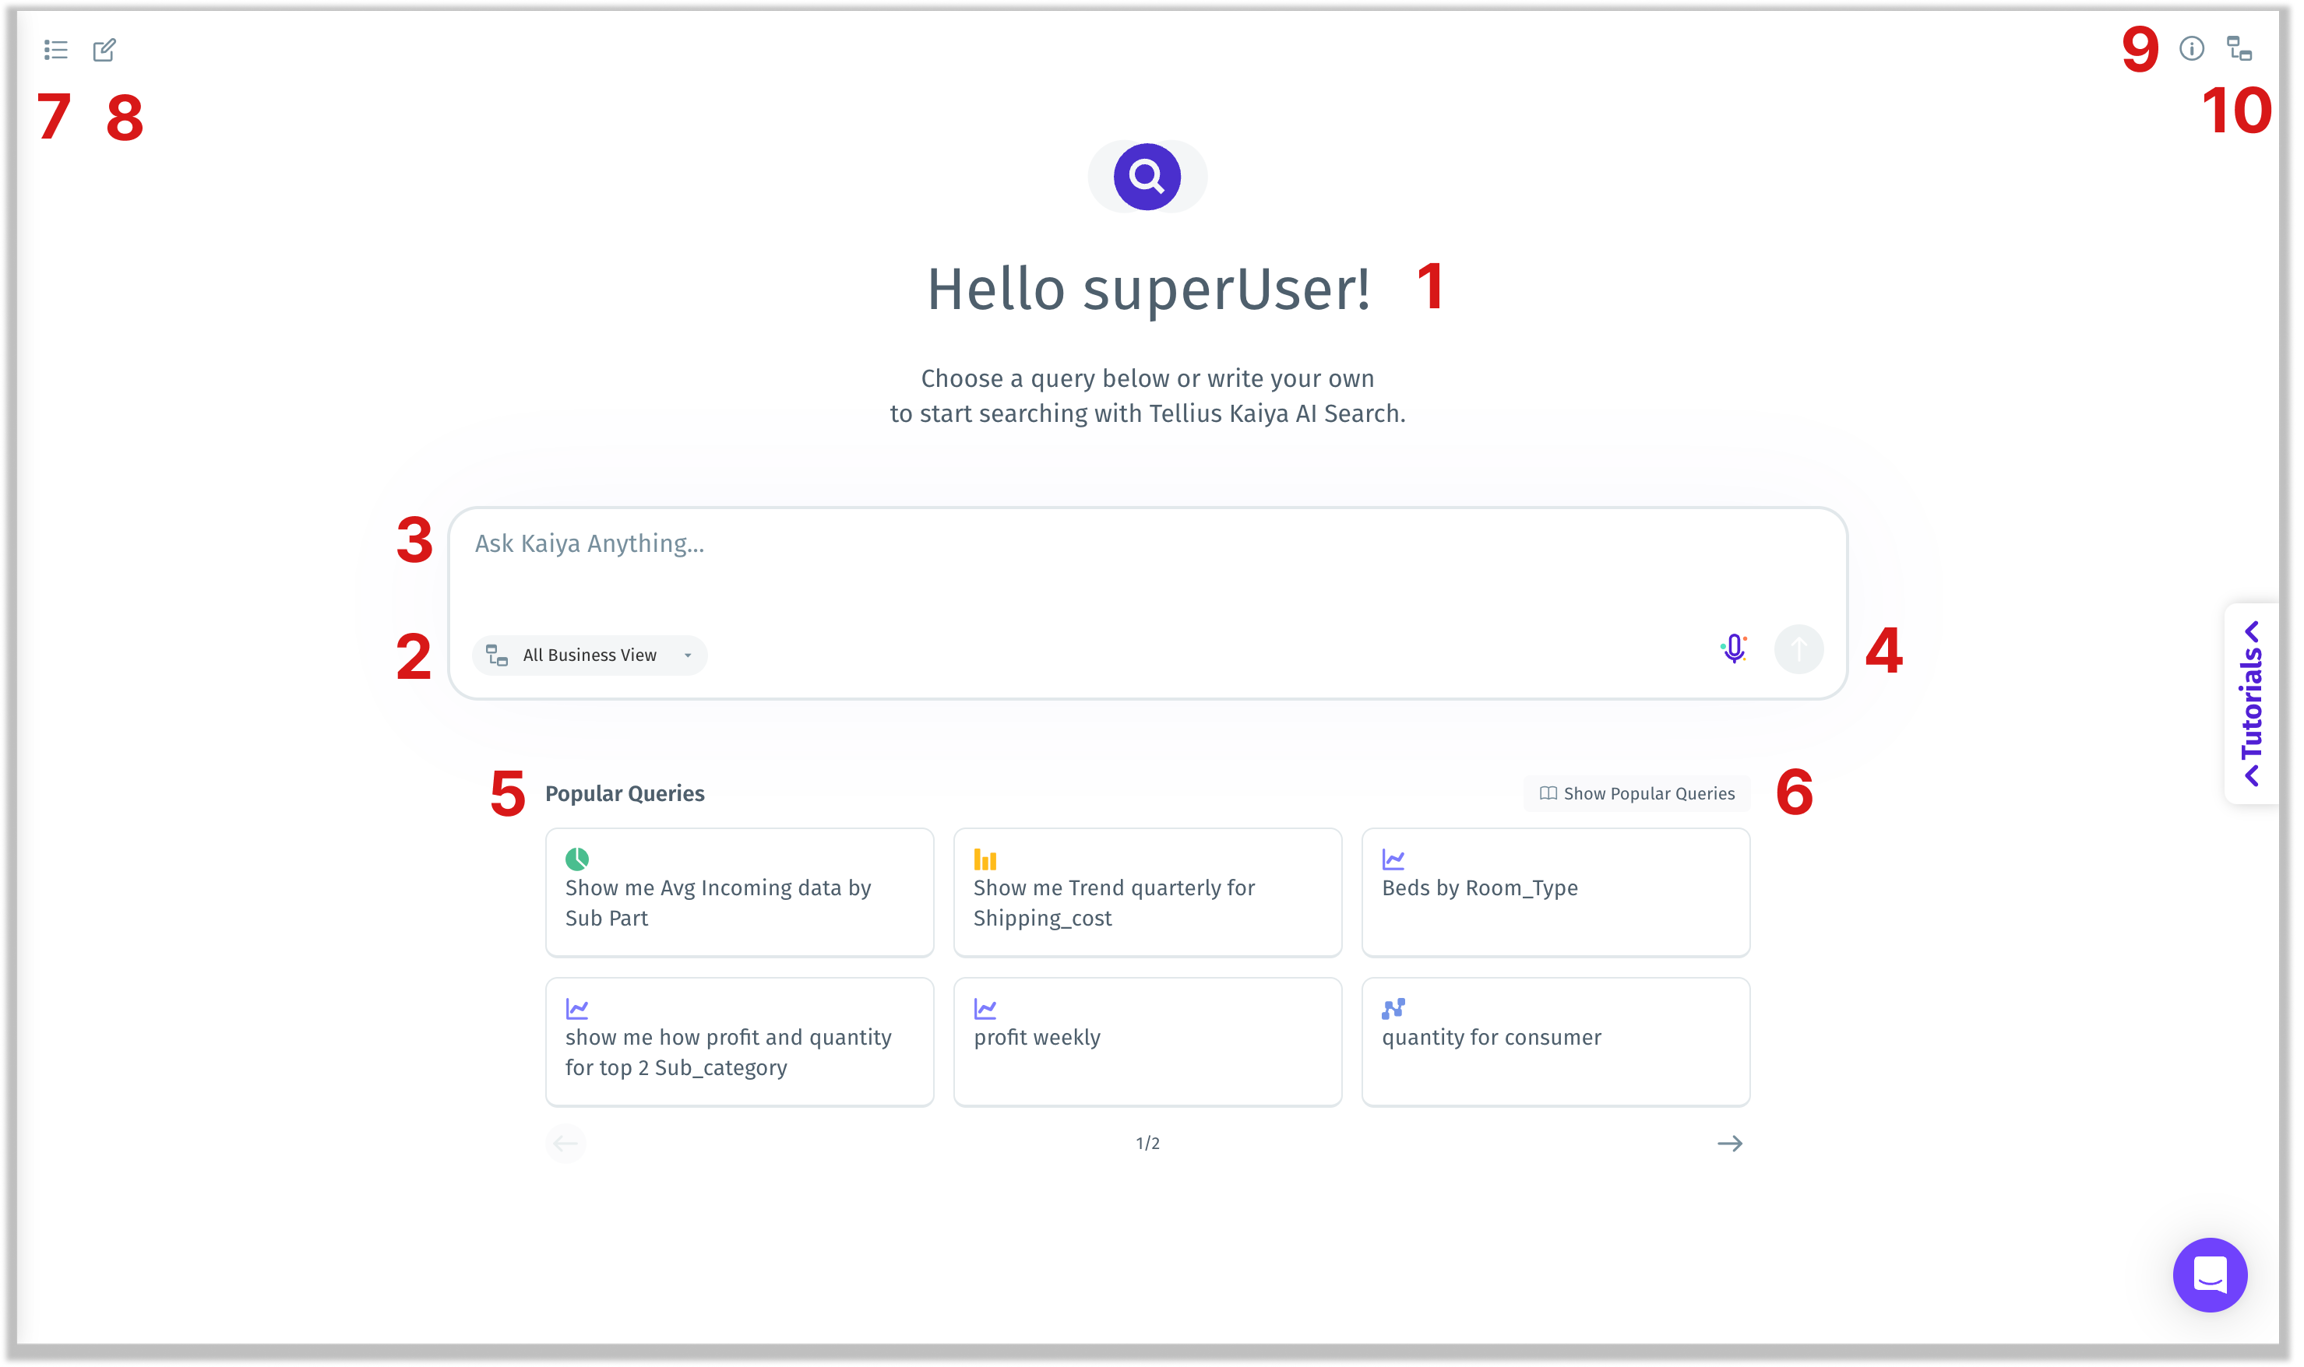
Greetings: Kaiya greets you to start using its conversational Search! Start to type your question in #3 or choose from the curated list of queries in #5.
Business View selection: Choose the relevant Business View (BV) from the list of all available BVs.
Search box: Start typing your question in natural language here and click on the arrow button in the bottom right or press Enter to execute your query.
Voice command: Alternatively, you can click the microphone button and start speaking your query. Once done, you can click on the microphone button again to indicate query completion.
Popular queries: Here, you can find the curated list of queries to kickstart your Kaiya conversational journey. Click on the required query and the same will be populated in the search box.
Show popular queries:
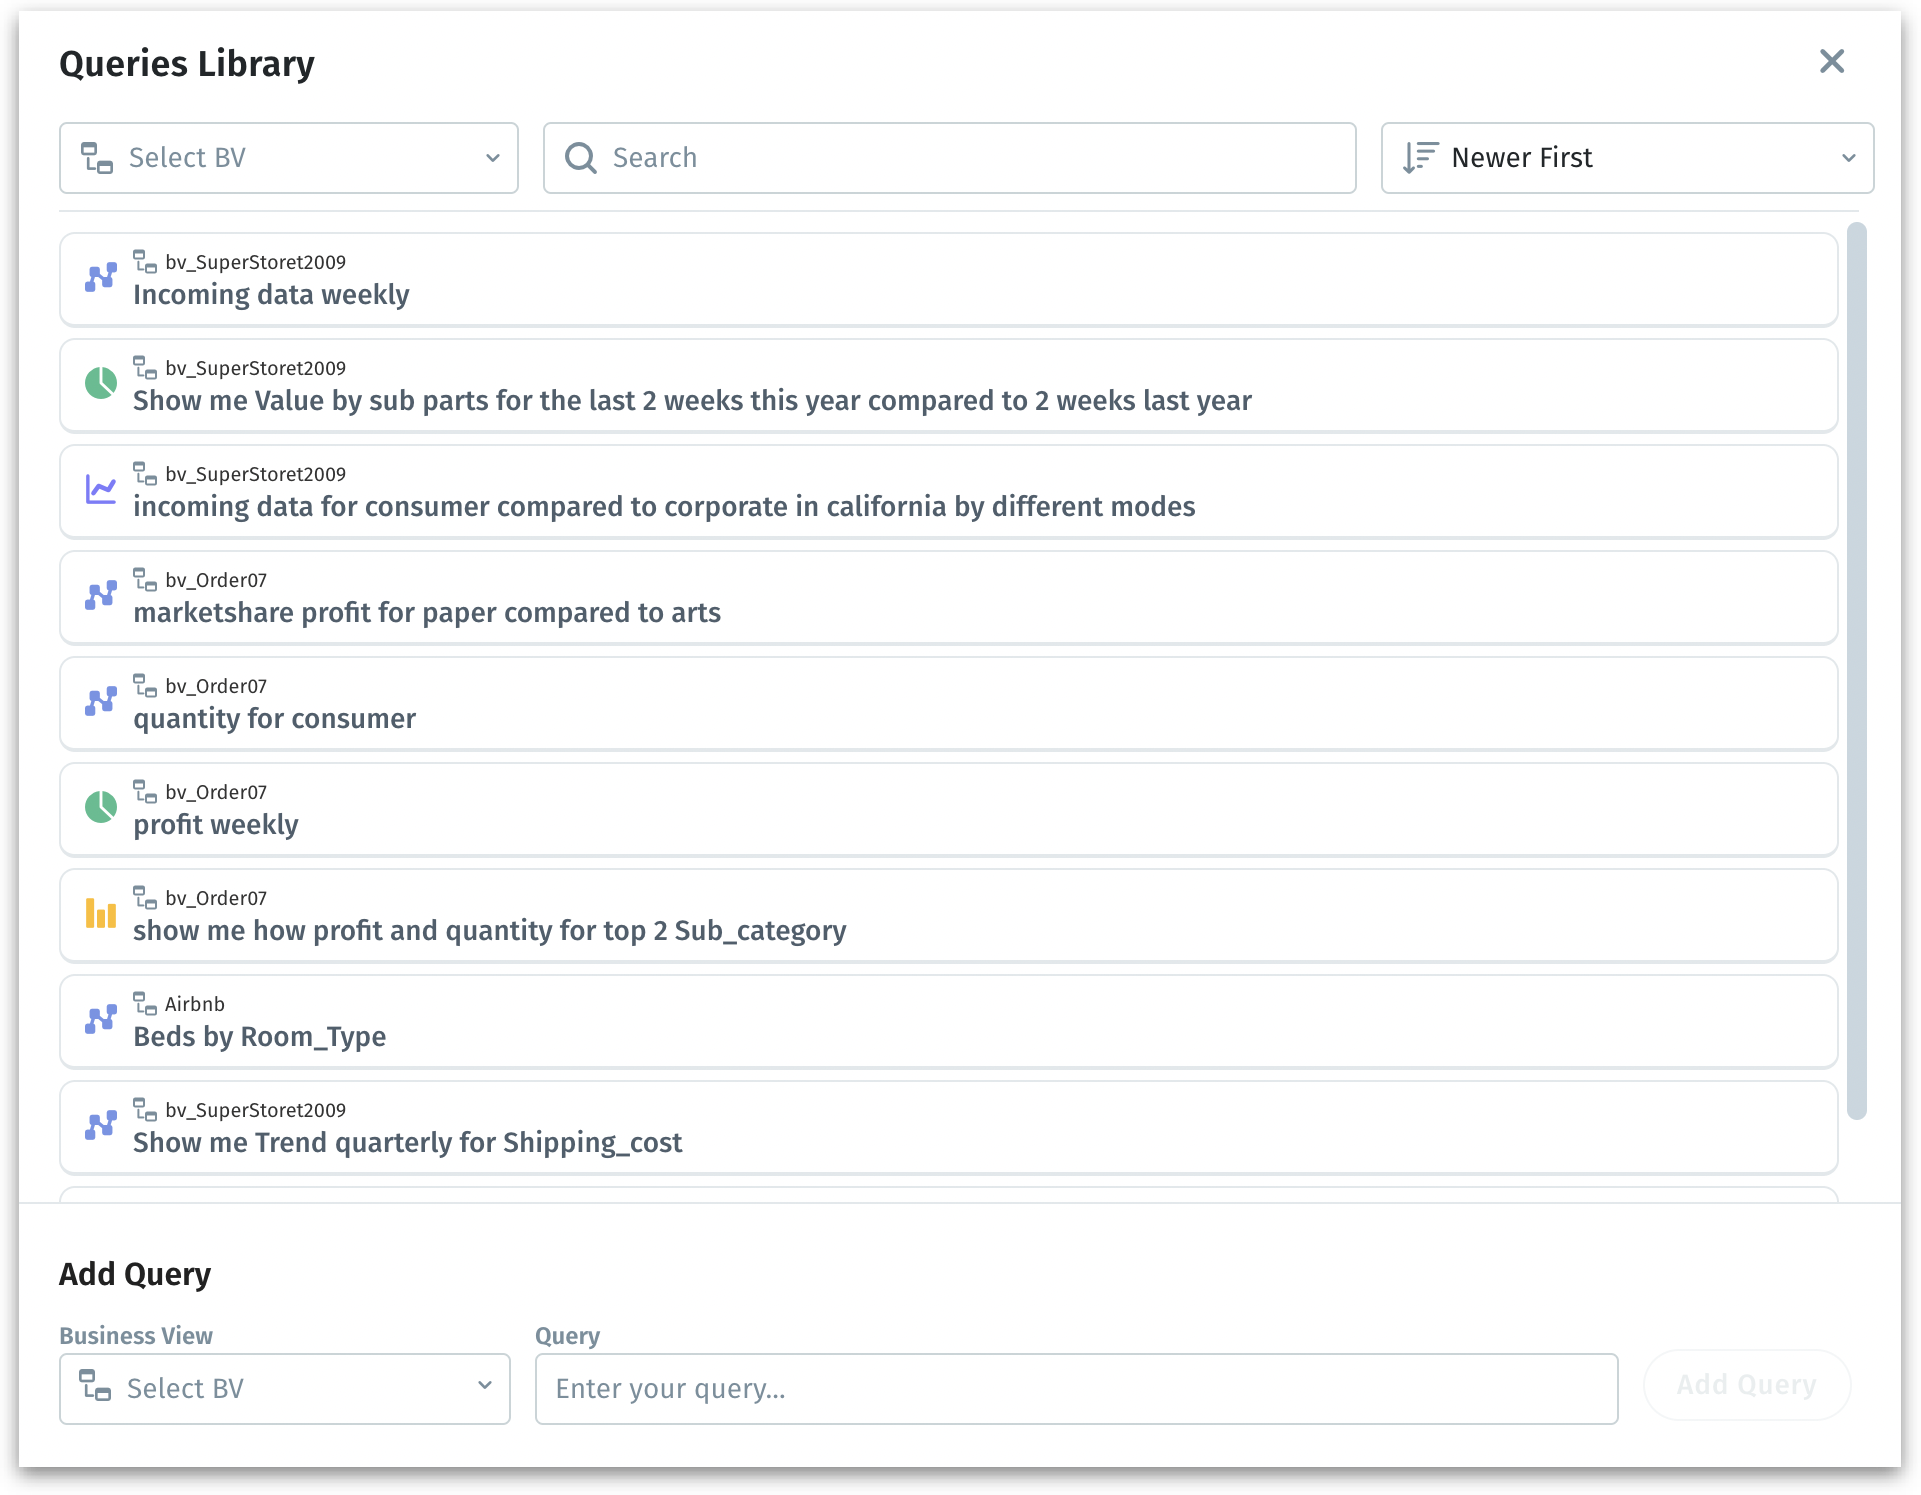
Click on the “Show popular queries” button and the Queries Library will be displayed.
Select the required Business View (BV) to view the queries associated to that specific BV. Search and sort (by new or old queries), if required.
Click on the required query and the same will be populated in the the search box.
Hover over any query to view the three-dot menu where you can edit or delete a query.
Under Add query, choose the relevant Business View, type the query to be added to the Queries Library, and click on Add Query.
Alternatively, you can ask Kaiya to generate relevant starter questions for you. Click on the wand icon in the far right corner and a question related to the BV will be generated.
Click on Preview button to preview the results of the query in the adjacent tab. Click on Add Query to add the query to the library.
Previous chats:
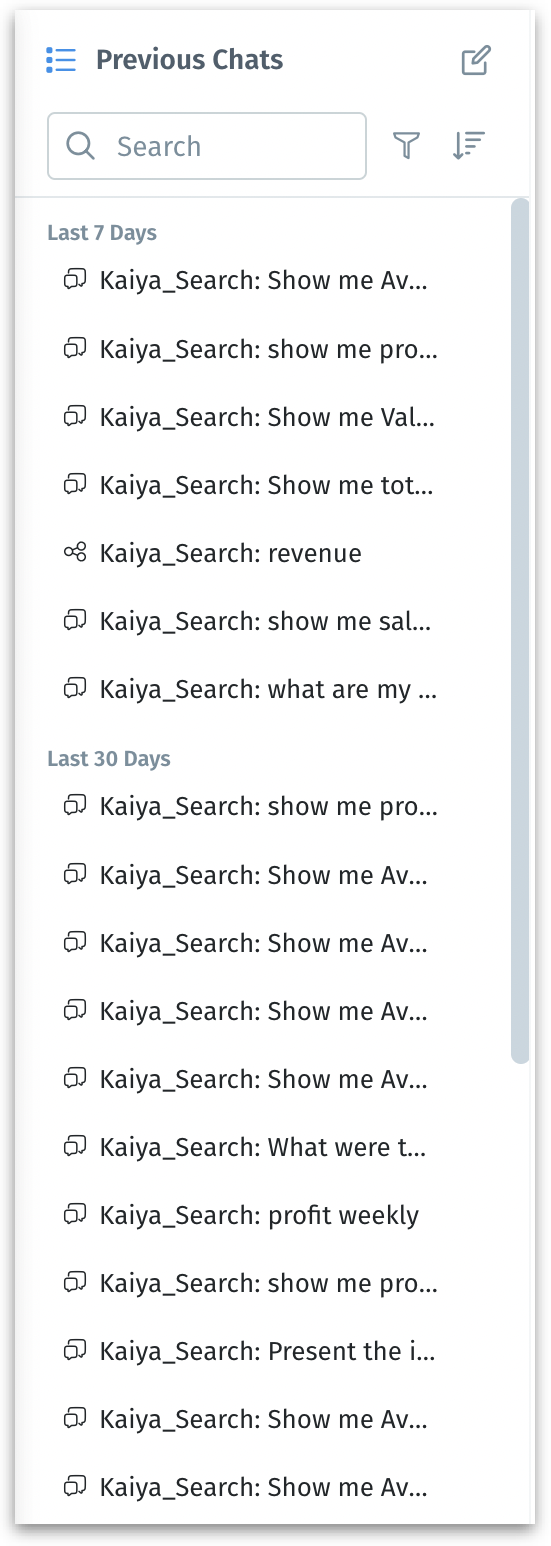
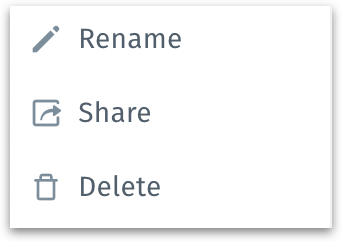
a. Select a conversation to view the thread. Hover over any conversation to view the three-dot menu where you can rename, share or delete the required conversation.
b. Click on the Previous chats icon to view the history of conversations. Search, sort, or apply filter to view all the chats, your chats, or the ones shared with you.
New chat: Click on New chat to create a new conversation.
Once a query is executed and the results are displayed, you can find details of the analysis (columns, Business View, and the number of rows analyzed along with the time taken to execute the query) under Search Inspector. You can also thumbs up/thumbs down the analysis as preferred.
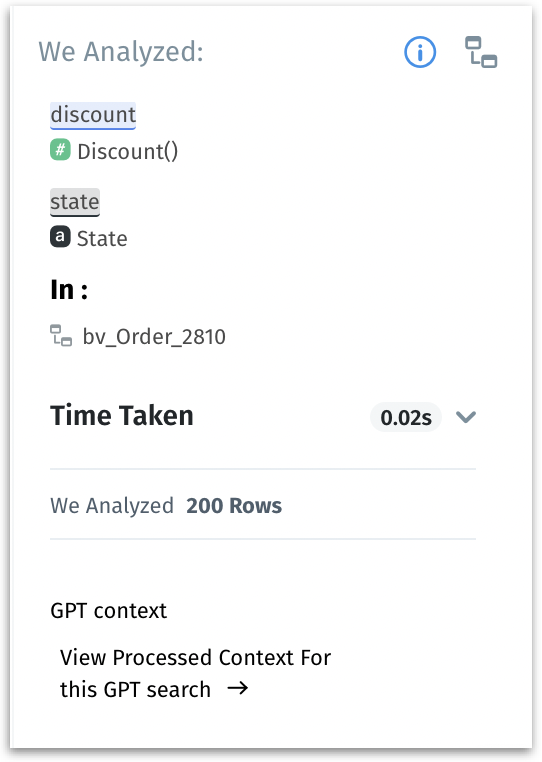
Business View: The list of all available Business Views are displayed here.
Working with Kaiya (non auto-BV mode)
Under Settings → Advanced → Kaiya → Kaiya Conversation, make sure the toggle "Auto-select Business View" is disabled for non auto-BV mode.
Choose the required Business View from the dropdown and start typing your query. Alternatively, you can choose from the initial set of queries provided below the search box.
Kaiya will work its magic. Depending on the input question, you will find the step-by-step process getting loaded. Most often, you can find these four steps:
Identifying the intent and relevant data
Enhancing context for deeper understanding
Interpreting with AI
Processing data to deliver analytical results
After the process gets completed, the results will be displayed.
The analysis of the resulting chart can be found in the Search Inspector. If you have multiple charts in a conversation, select the required chart to view the respective analysis.
Under Business View, you can find all the columns in the selected BV.
Working with Kaiya (auto-BV mode)
If you're unsure which Business View (BV) to select, Kaiya can automatically identify and select the most relevant one for you. Simply start typing your query, and Kaiya will ensure the appropriate BV is applied. To enable the auto-Business View mode,
Under Settings → Advanced → Kaiya → Kaiya Conversation, enable the toggle "Auto-select Business View".
Navigate back to Kaiya tab and start typing your query without having to select the Business View first.
The following step will be displayed as one of the execution steps.

Kaiya will go through your query and auto-select the relevant Business View for you.
The results will be displayed. You can find "Business View was auto-picked by Tellius Kaiya" near the selected BV.
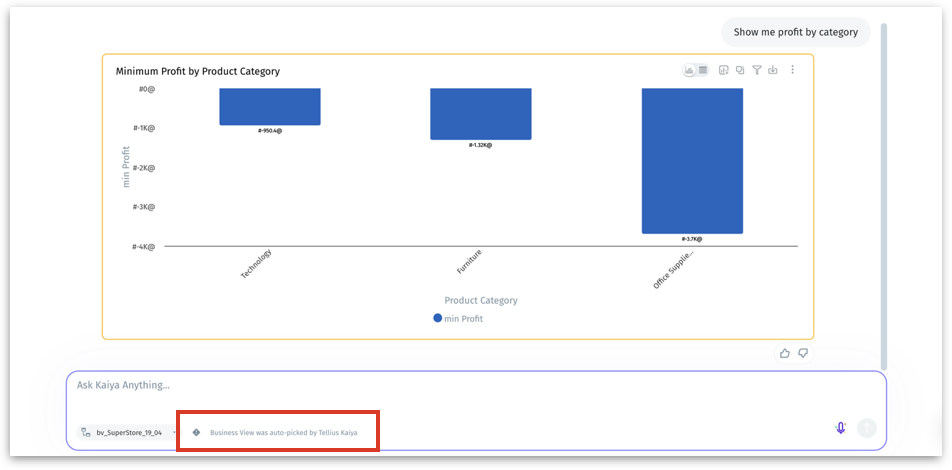
If the auto-selected BV is accurate, click on the thumbs-up button in the feedback section (below the chart). This helps Kaiya learn and remember the association, ensuring accurate results in the future.
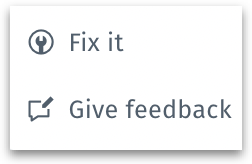
If the auto-selected BV did not meet your expectations, then click on the thumbs-down button in the feedback section. From the following menu, select "Fix it" to rectify the selected BV.
From the dropdown, select the relevant Business View if needed. While Kaiya is designed to intelligently auto-select the most suitable BV, occasional adjustments may be required. Over time, Kaiya learns from your feedback to improve accuracy for future queries.

The analysis of the resulting chart can be found in the Search Inspector. If you have multiple charts in a conversation, select the required chart to view the respective analysis.
Under Business View, you can find all the columns in the selected BV.
Ask Kaiya about your Business View
Kaiya answers natural language questions about metadata—such as measures, dimensions, calculated columns, and date fields—so that you can quickly uncover key details about your Business View (BV) without technical expertise. Whether you're a business user trying to understand data relevance before diving into analysis or an analyst seeking granular technical details, Kaiya bridges the gap between technical metadata and business context.
Metadata queries accelerate data discovery, empowers non-technical users, and reduces the back-and-forth between teams. You can ask questions about the structure and content of your dataset (BV) to:
Discover available columns (measures, dimensions, date fields, and calculated columns).
Understand calculated column formulas and their purpose.
Identify fields related to a specific concept or KPI.
Bridge the gap between technical metadata (e.g., field definitions) and business relevance.
What type of questions you can ask Kaiya about your Business View
Navigate to the Kaiya conversational search bar in the Tellius interface. Select or activate the Business View (BV) you want to explore. Use natural language to ask Kaiya questions about the metadata.
1. Different types of available columns
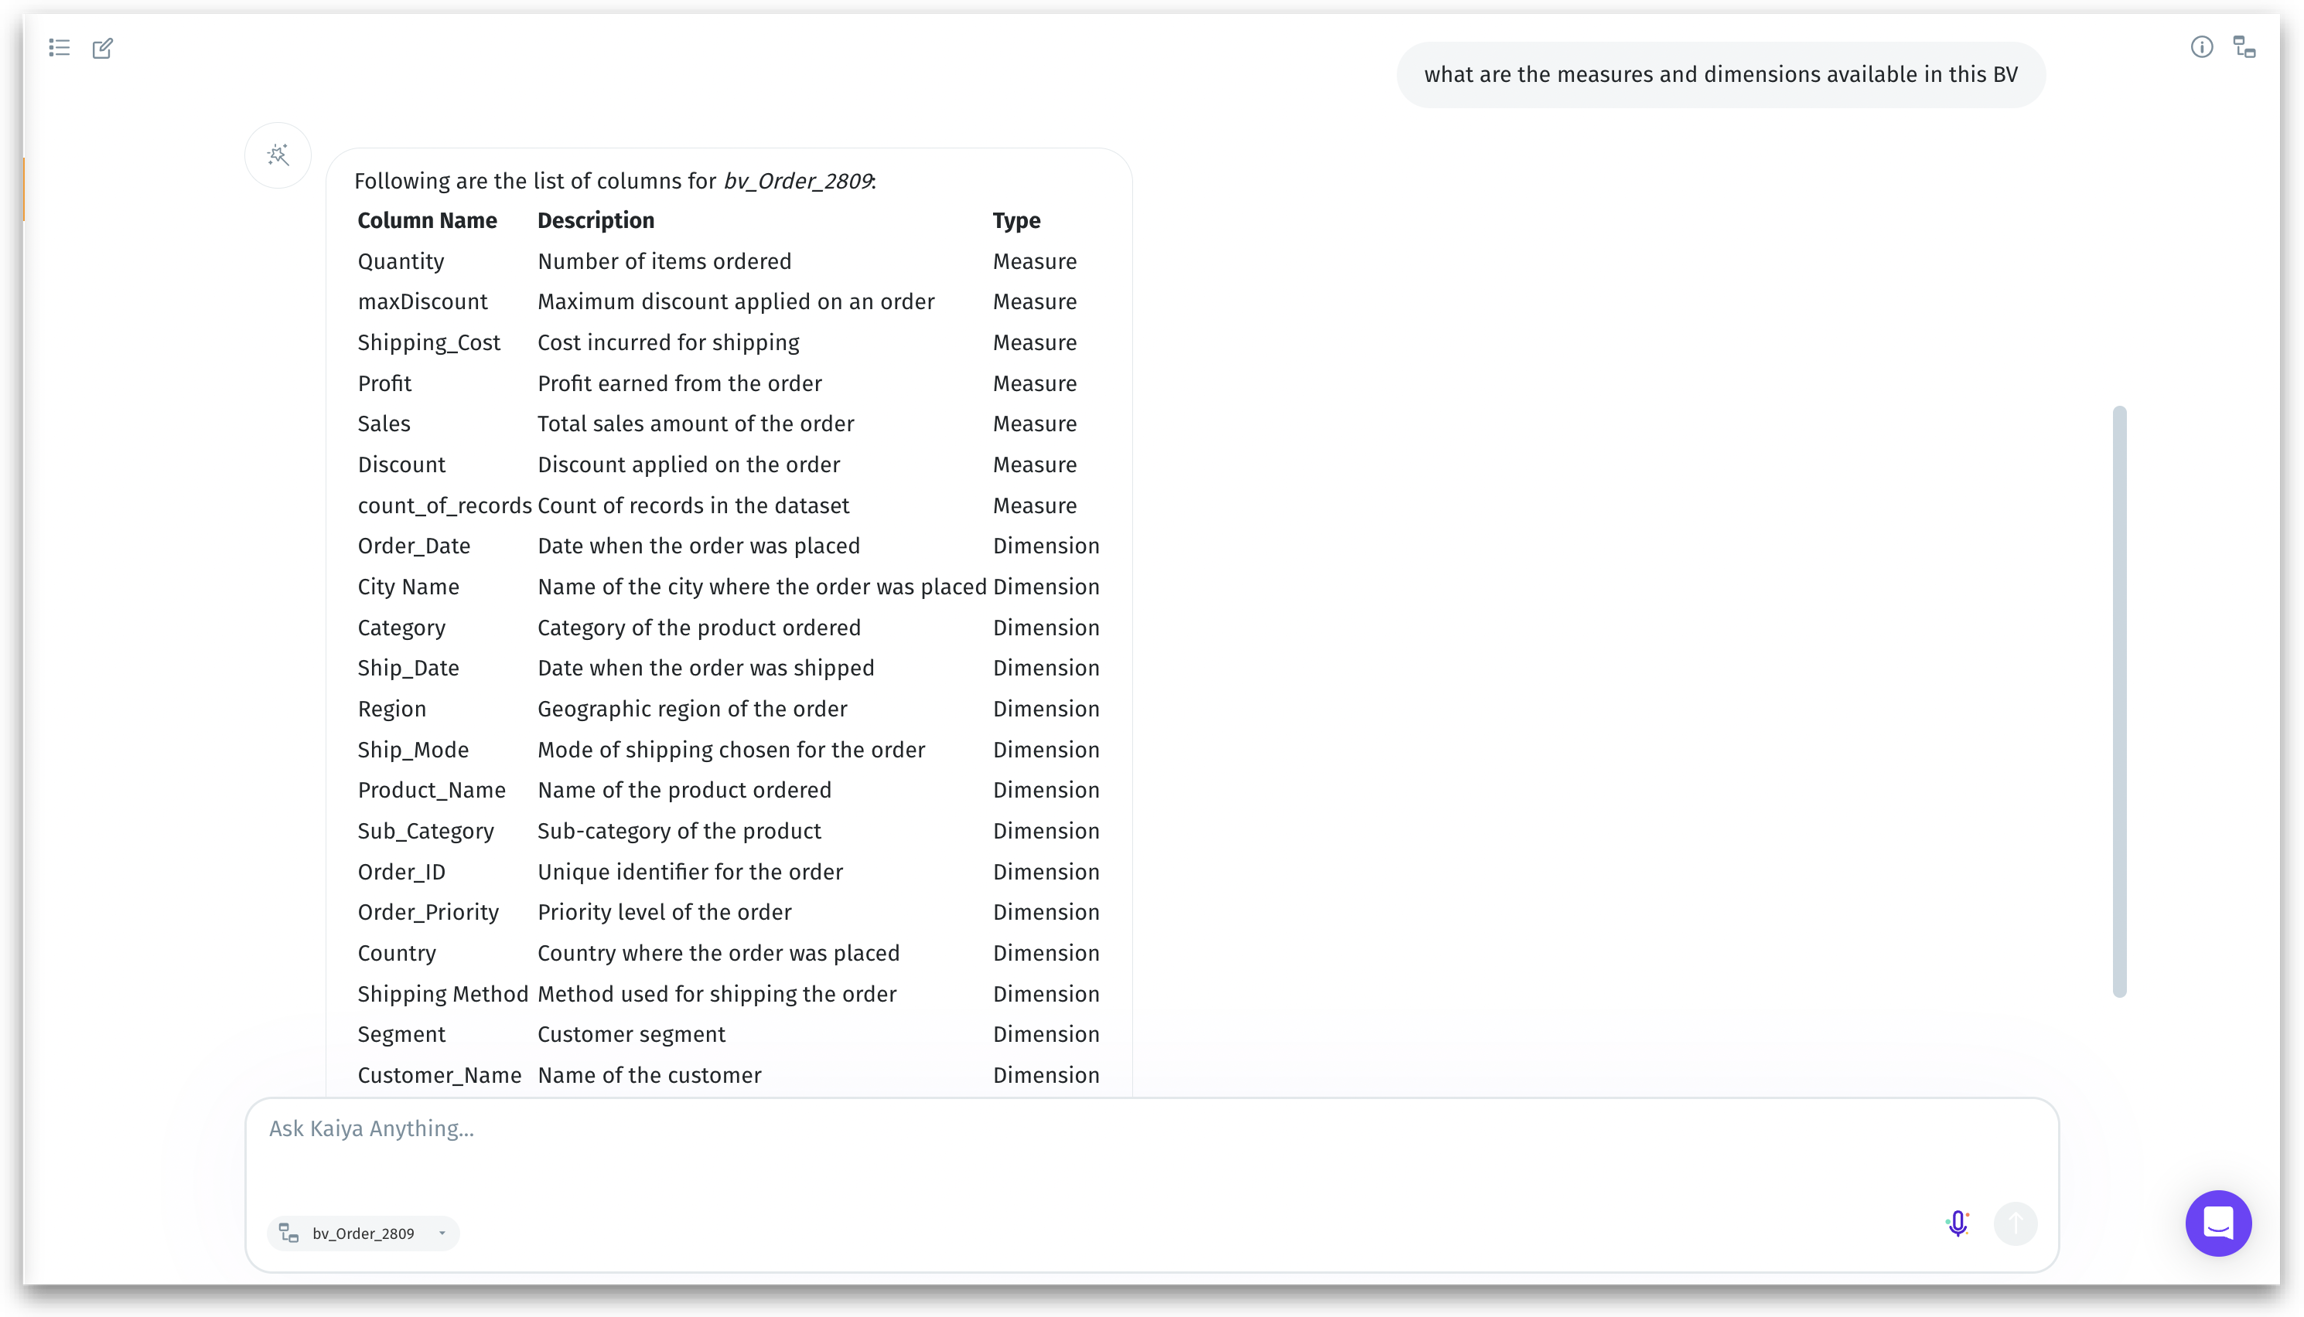
"What are the measures and dimensions available in this BV?"
Kaiya provides a structured table listing the columns in the BV, categorized as measures and dimensions.
"What date fields are available in this BV?"
Kaiya displays a table listing all calculated columns along with their descriptions.

"What are the calculated columns available in this BV?"
Kaiya displays a table listing all calculated columns along with their descriptions and types (e.g., Measure or Dimension).

2. Columns related to a specific concept or KPI
"Show me the columns related to sales in this BV".

Resulting chart
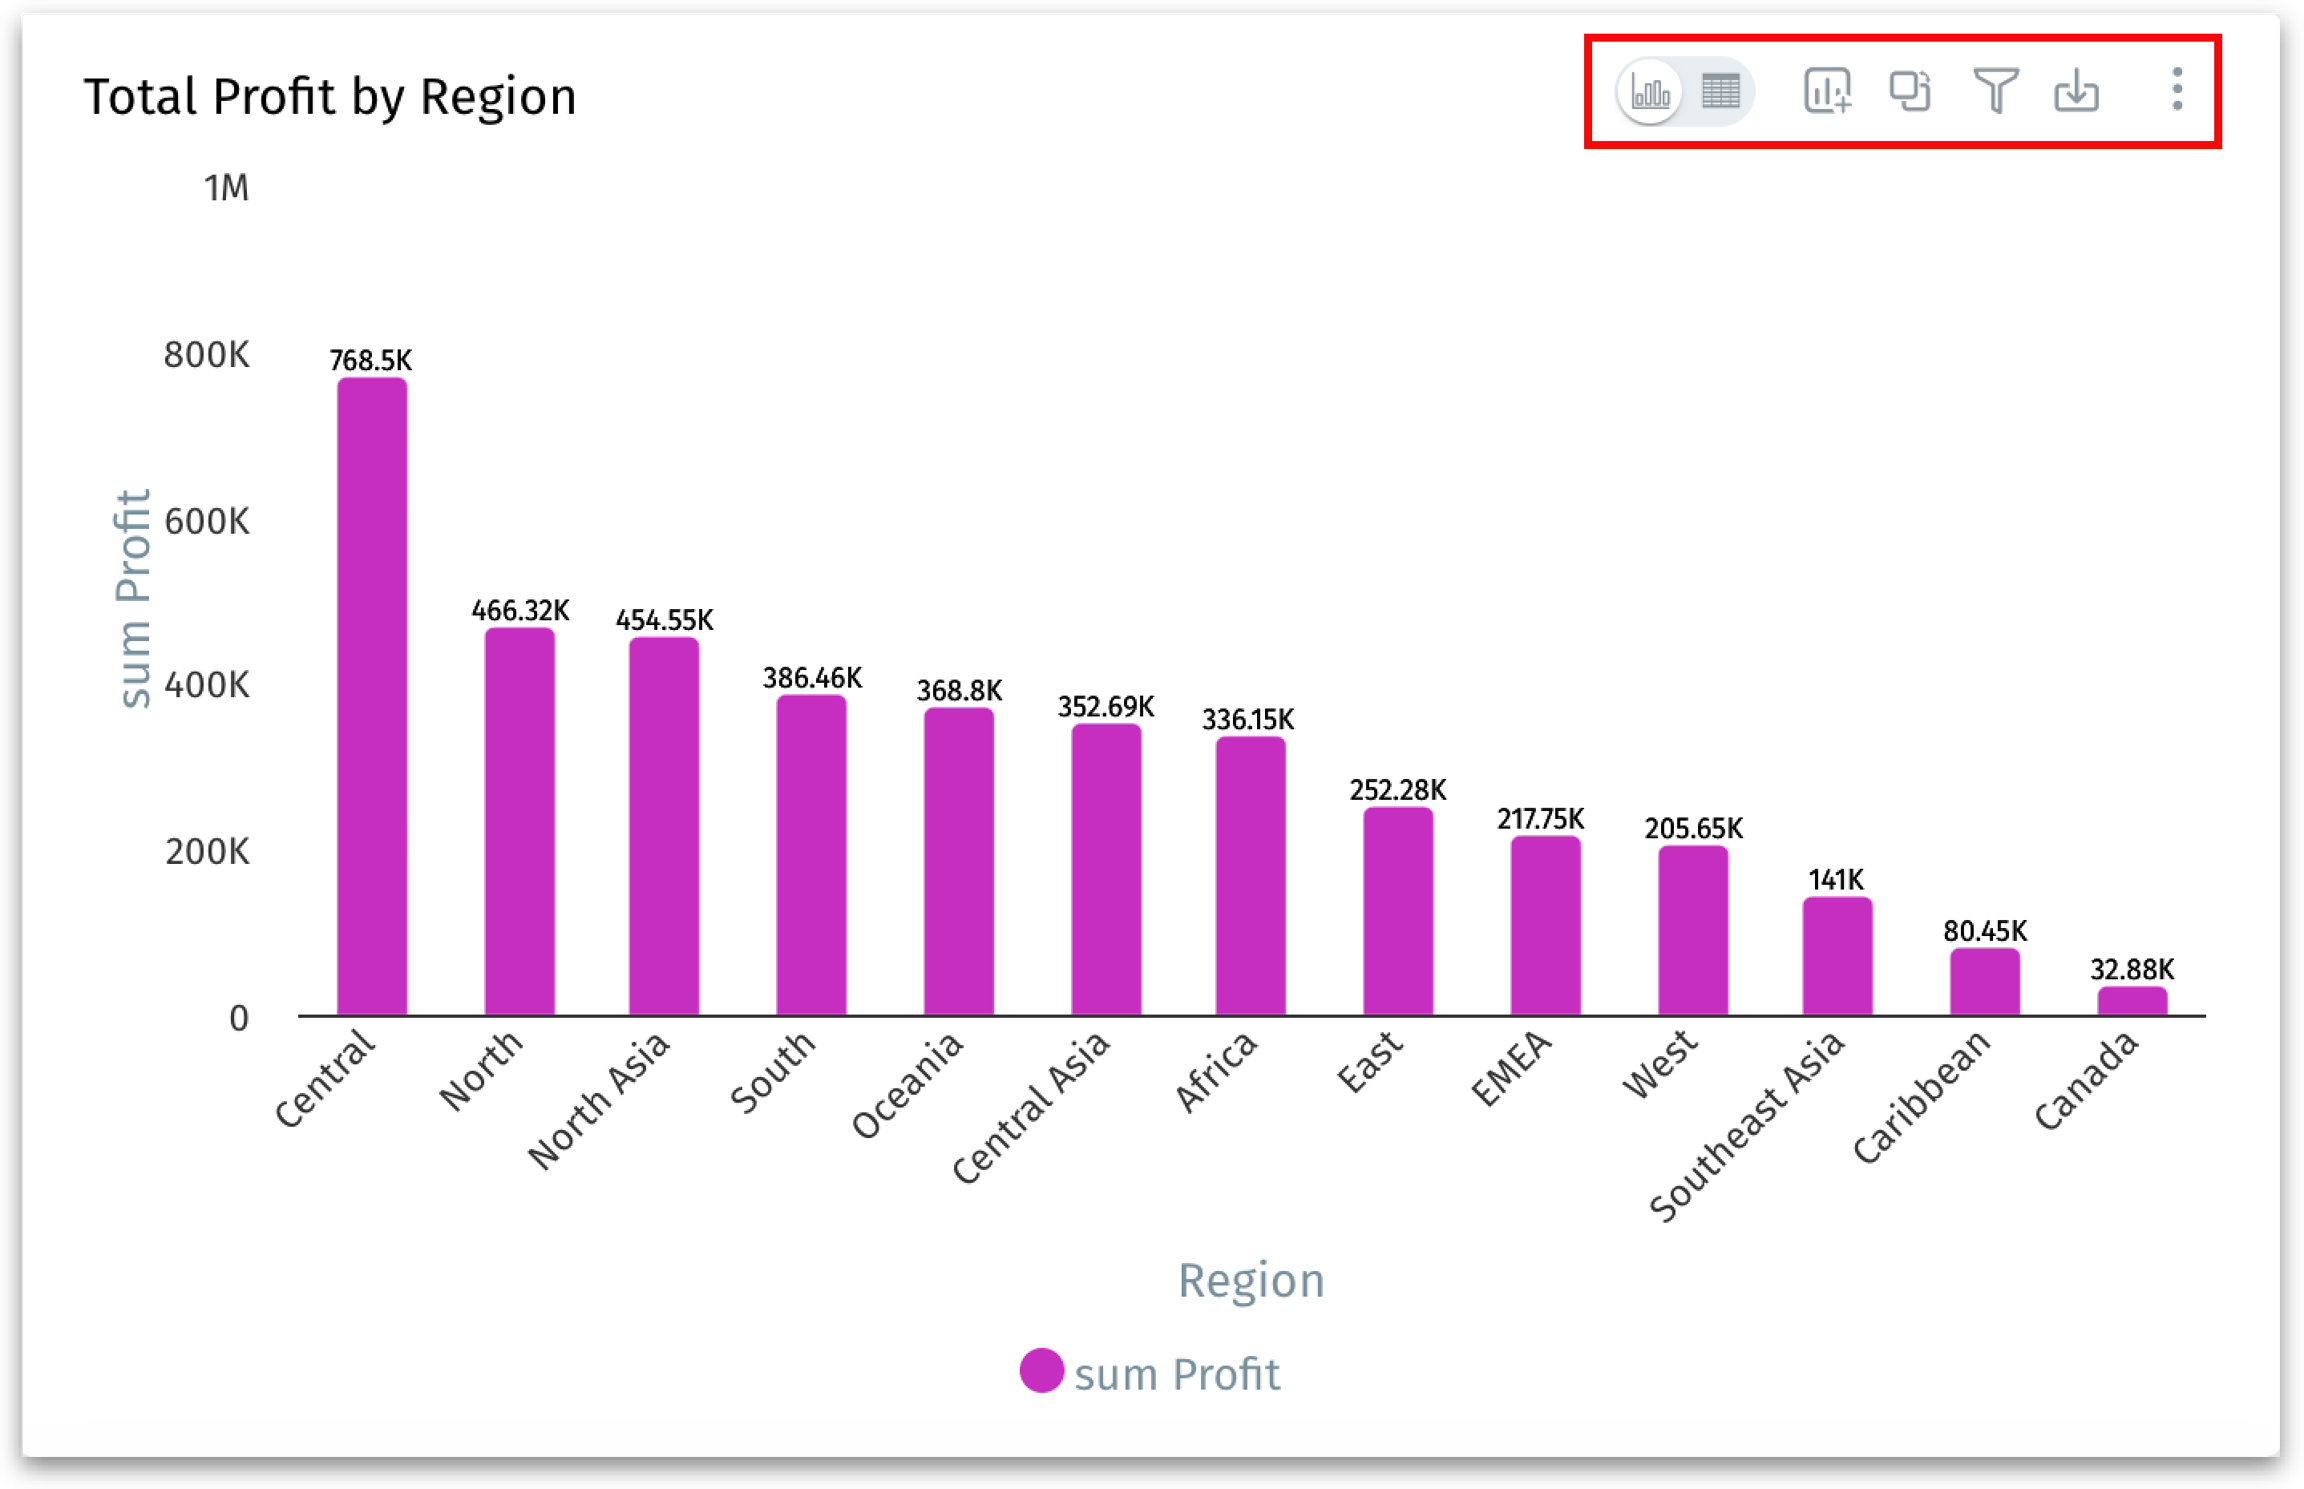
Click on the View Data toggle button to view the underlying table data of the chart. Alternatively, you can click on the three-dot submenu of a chart and select Detailed view.
Click on Add to Vizpad to add the chart to an existing or a new Vizpad. You can select from the list of available Vizpads displayed.
Click on Switch Chart to switch the chart to a different type. The list of applicable chart types will be displayed and you can select the required chart type. For more details, check out this section.
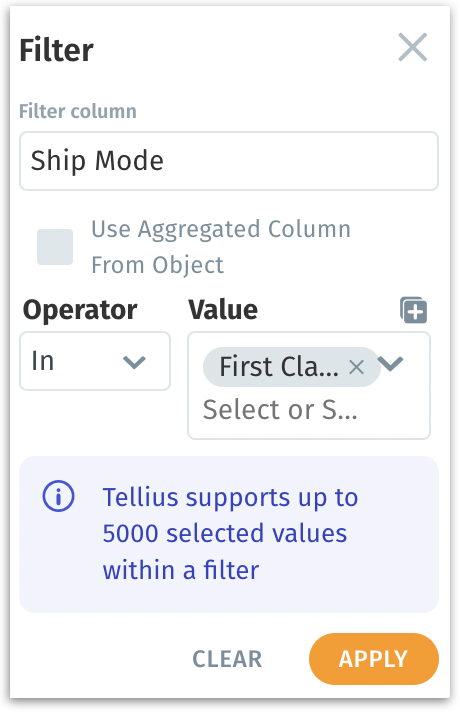
Click on Filter to apply filters to the chart.
Click on Download and select the required format in which you want the chart to be downloaded.

If you’re satisfied with the result, click on the thumbs-up button. It will be saved and your preferences will be saved for future queries.
If you’re not satisfied, click on the thumbs-down button. To remediate the results, click on Fix it. If you don’t want to resolve the issue, but only want to provide feedback, click on Give feedback.
The thumbs up/thumbs down feedback is available only in a live conversation and not in history. If the thumbs up or thumbs down is once clicked for a chart, it cannot be changed.
Preamble
Kaiya includes a Preamble—a short, insightful explanation that appears before each response. This section breaks down exactly how your question was understood and how the answer was derived. It helps you build trust, learn the logic behind the response, and verify that Kaiya correctly interpreted your intent.
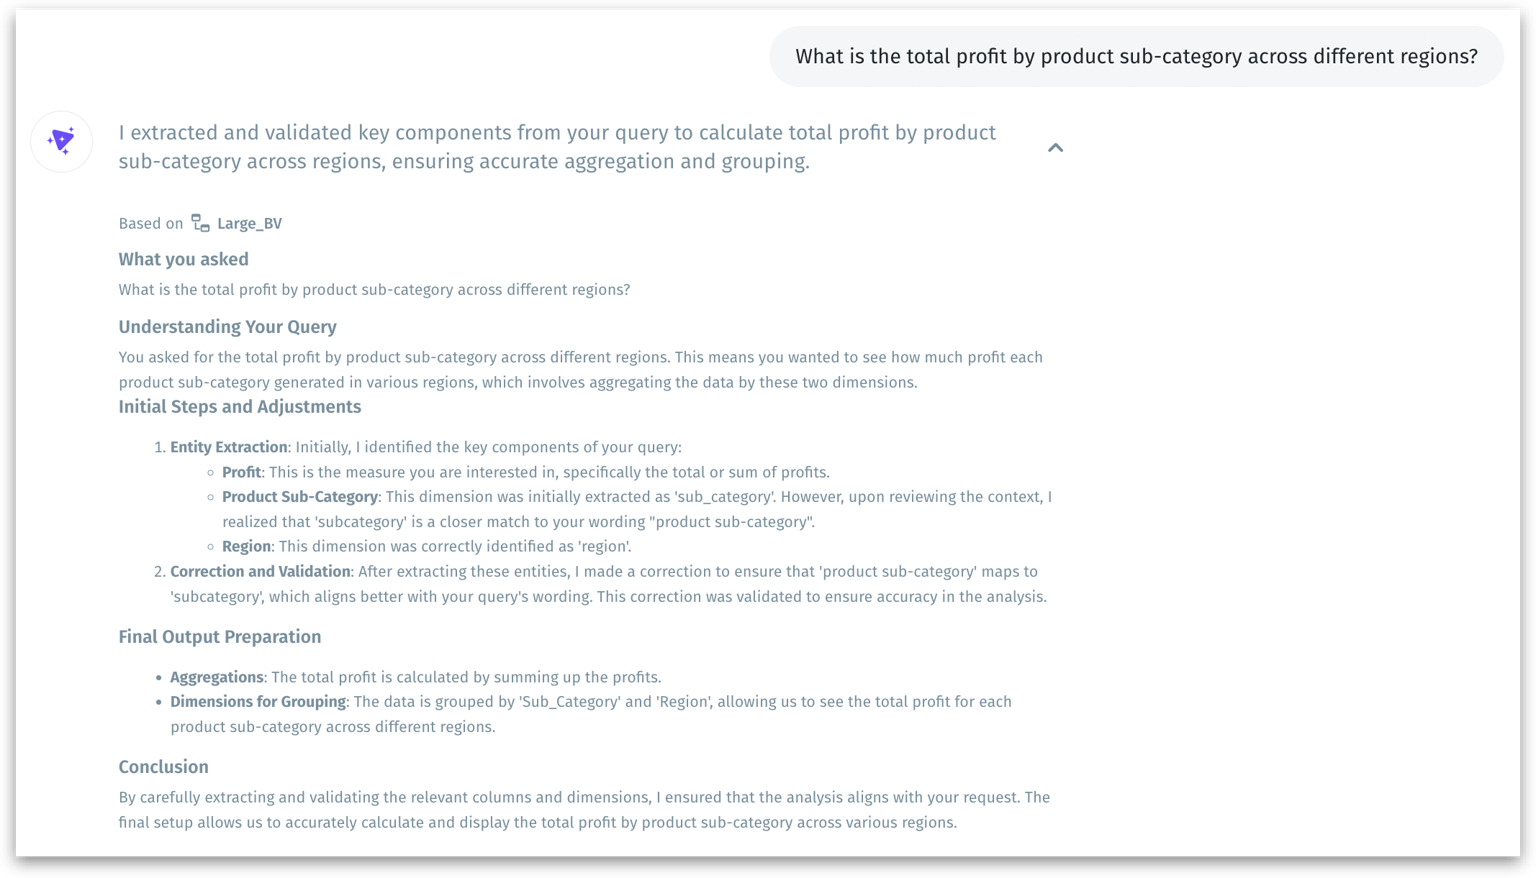
It walks you through how Kaiya:
Interprets your query
Identifies key metrics, dimensions, and filters
Selects the most relevant dataset
Analyses and applies logic
Validation & finalization
See exactly how data fields, filters, and groupings were mapped to your question. If you notice a mismatch in what was interpreted, adjust or rephrase your question.
With this preamble-first approach, Kaiya doesn’t just give you an answer—it helps you understand the reasoning behind it. This makes your analysis more reliable, traceable, and smarter with every question.
Clarification questions
Kaiya is designed to get you the most accurate answers by making sure it understands your question correctly. Sometimes, the way you phrase a question might include words that could mean different things depending on context. In those cases, Kaiya will pause and ask you a clarification question before proceeding with the analysis.
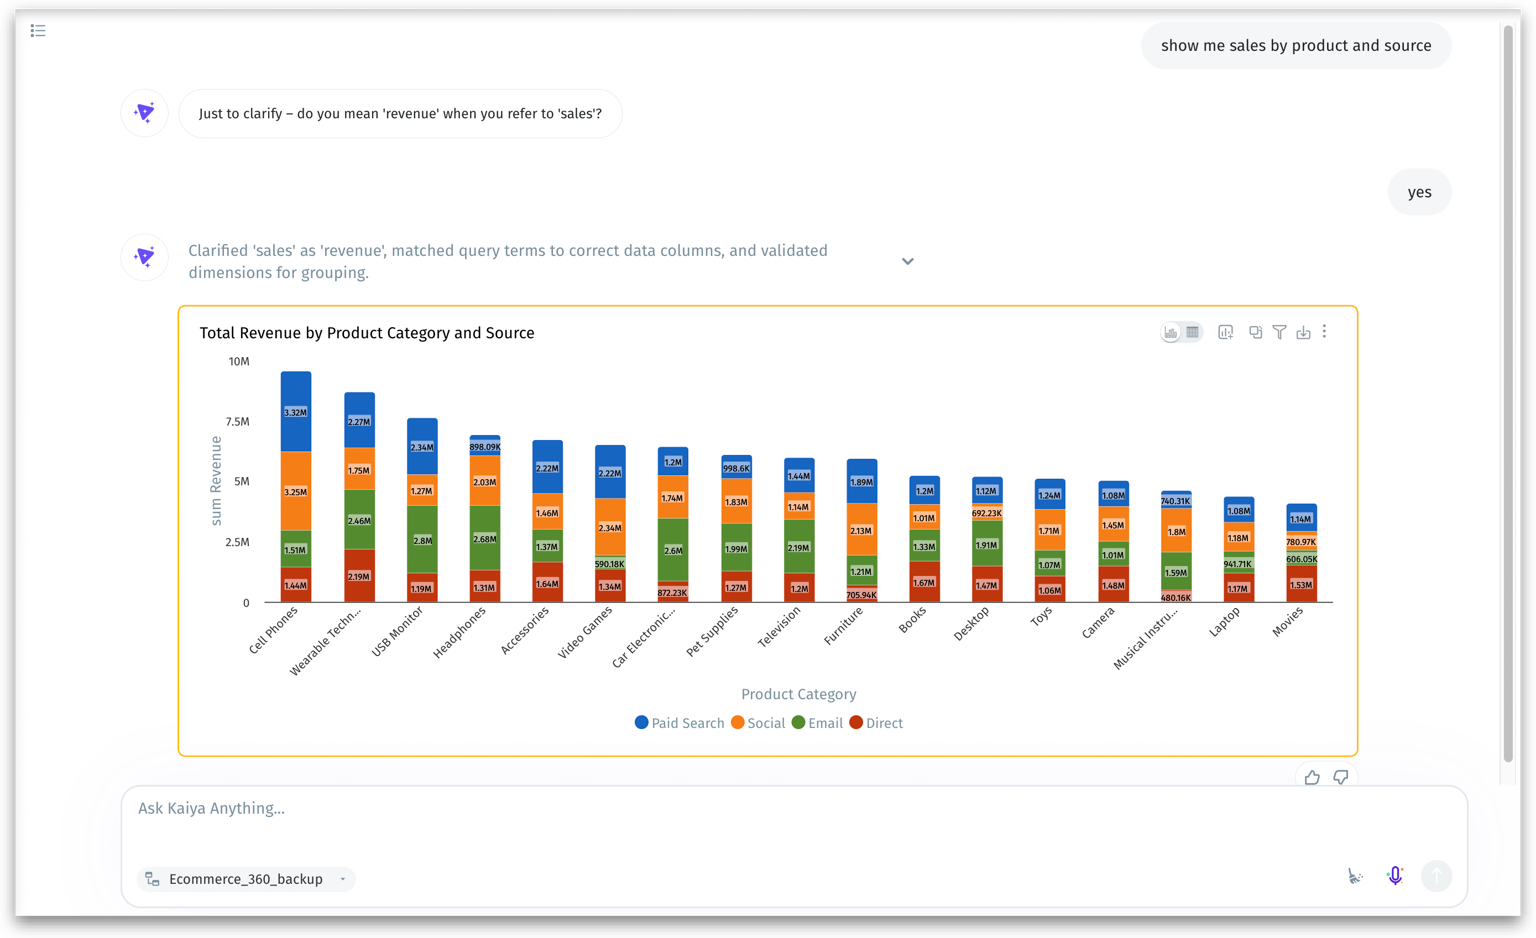
A clarification question is a smart prompt that Kaiya shows when your original question could be interpreted in multiple ways. For example, if you say:
“Show me sales by product and cost”
Cost could mean “average cost”, “total cost” etc. Kaiya might ask:
“Just to clarify, did you mean to see ‘sales’ by ‘product id’ and ‘average cost’?”
This ensures that Kaiya understands exactly what you’re looking for—before it selects columns, generates charts, or calculates results.
Once you respond to the clarification prompt, Kaiya updates your request using the confirmed terms. This promotes transparency, improves trust, and helps you get more meaningful results from your data conversations.
Was this helpful?