🌐Applying global filters
Learn how to apply Tellius global filters across Vizpad tabs for consistent data context. Configure date, measure, and dimension filters to align charts accurately.
Global filters apply consistent filtering across all tabs within a Vizpad. Any filter configured at the global level cascades to every chart and tab in the Vizpad, ensuring uniform data context across the entire dashboard.
In a Vizpad, click on the Add Filter button and the following menu will be displayed.
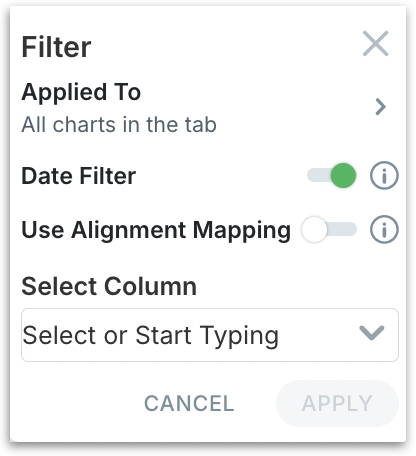
Click on the Applied to option to determine the charts for which you will apply the filter.
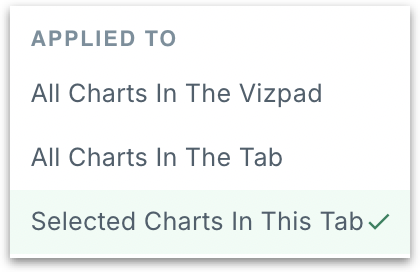
If you want to apply a global filter (for all charts in all tabs), then select All charts in the Vizpad. All subsequent filter configurations apply to every Vizpad tab.
If you want to apply filters all the charts in the current tab, then select All charts in the tab.
If you want to apply the filters only to specific charts, then select Selected Charts in this tab.
Once you set up the filter to be applied, then the following panel appears along with checkboxes for each chart/table in the current tab.

You can select the required charts and the count will be increased accordingly in the panel. Select all selects all the visuals in the tab, and the filter will be applied to the selected charts once you click on Apply.
If you want to apply filters to any date columns, then enable the Date filter toggle.
When Date filter toggle is disabled, only measures and dimensions will be displayed in the Select Column dropdown. If it is enabled, then only date columns will be displayed in the Select Column dropdown.
Once All charts in the Vizpad is selected, then the minimum and maximum range will be auto-selected. However, it overrides manual range modification so you can make necessary changes as required.
The auto-range will be selected as follows:
Measures: Selects the minimum and maximum values of the measure.
Dimensions: Defaults to
IN(inclusion) operator.Date columns: Calculates
MIN(date_column)toMAX(date_column)from entire dataset.
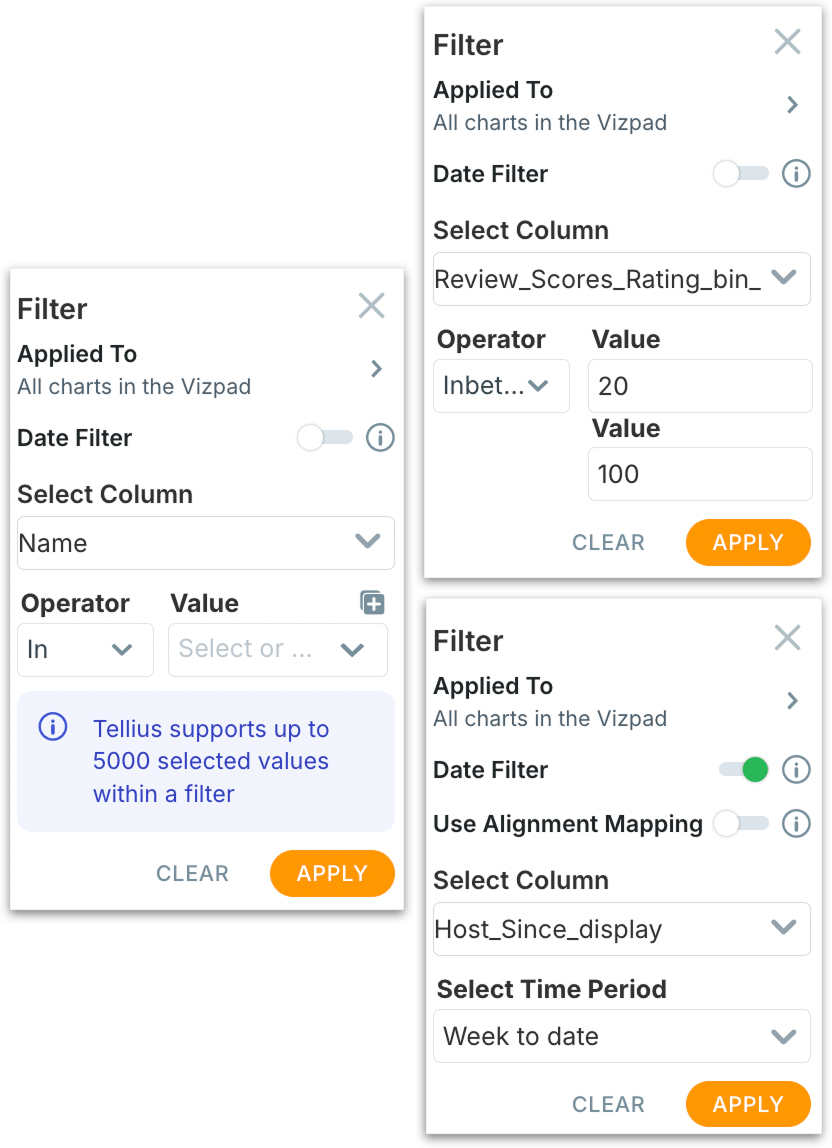
Enable the Use Alignment Mapping toggle if you want to refer only the mapped measures. This will be displayed only if Date filter is enabled.
Click on the Select time period field and the following window will be displayed. The available Measure → Date mappings for the Business View will be listed.
Choose the required time range from the available list.
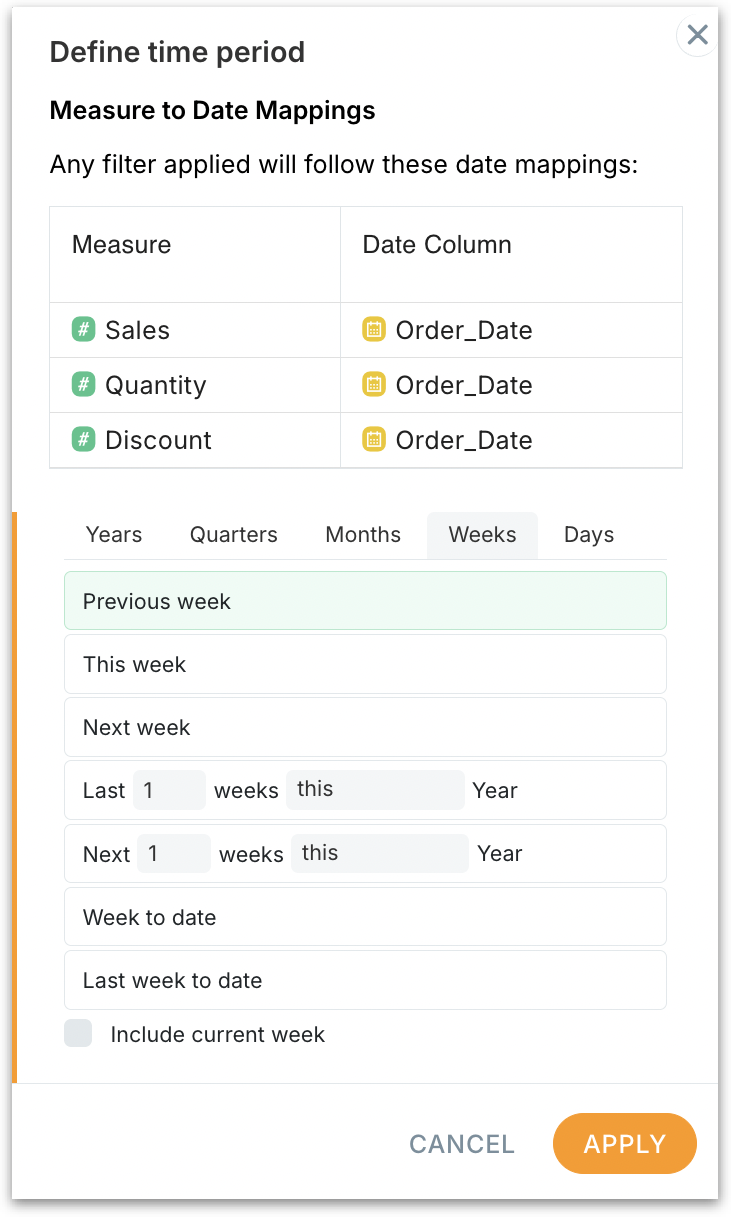
Click on Apply to save the changes. The date filter will be applied to the selected chart(s).
To set up new Measure → Date mapping(s) or to edit the existing mappings, please check out this page.
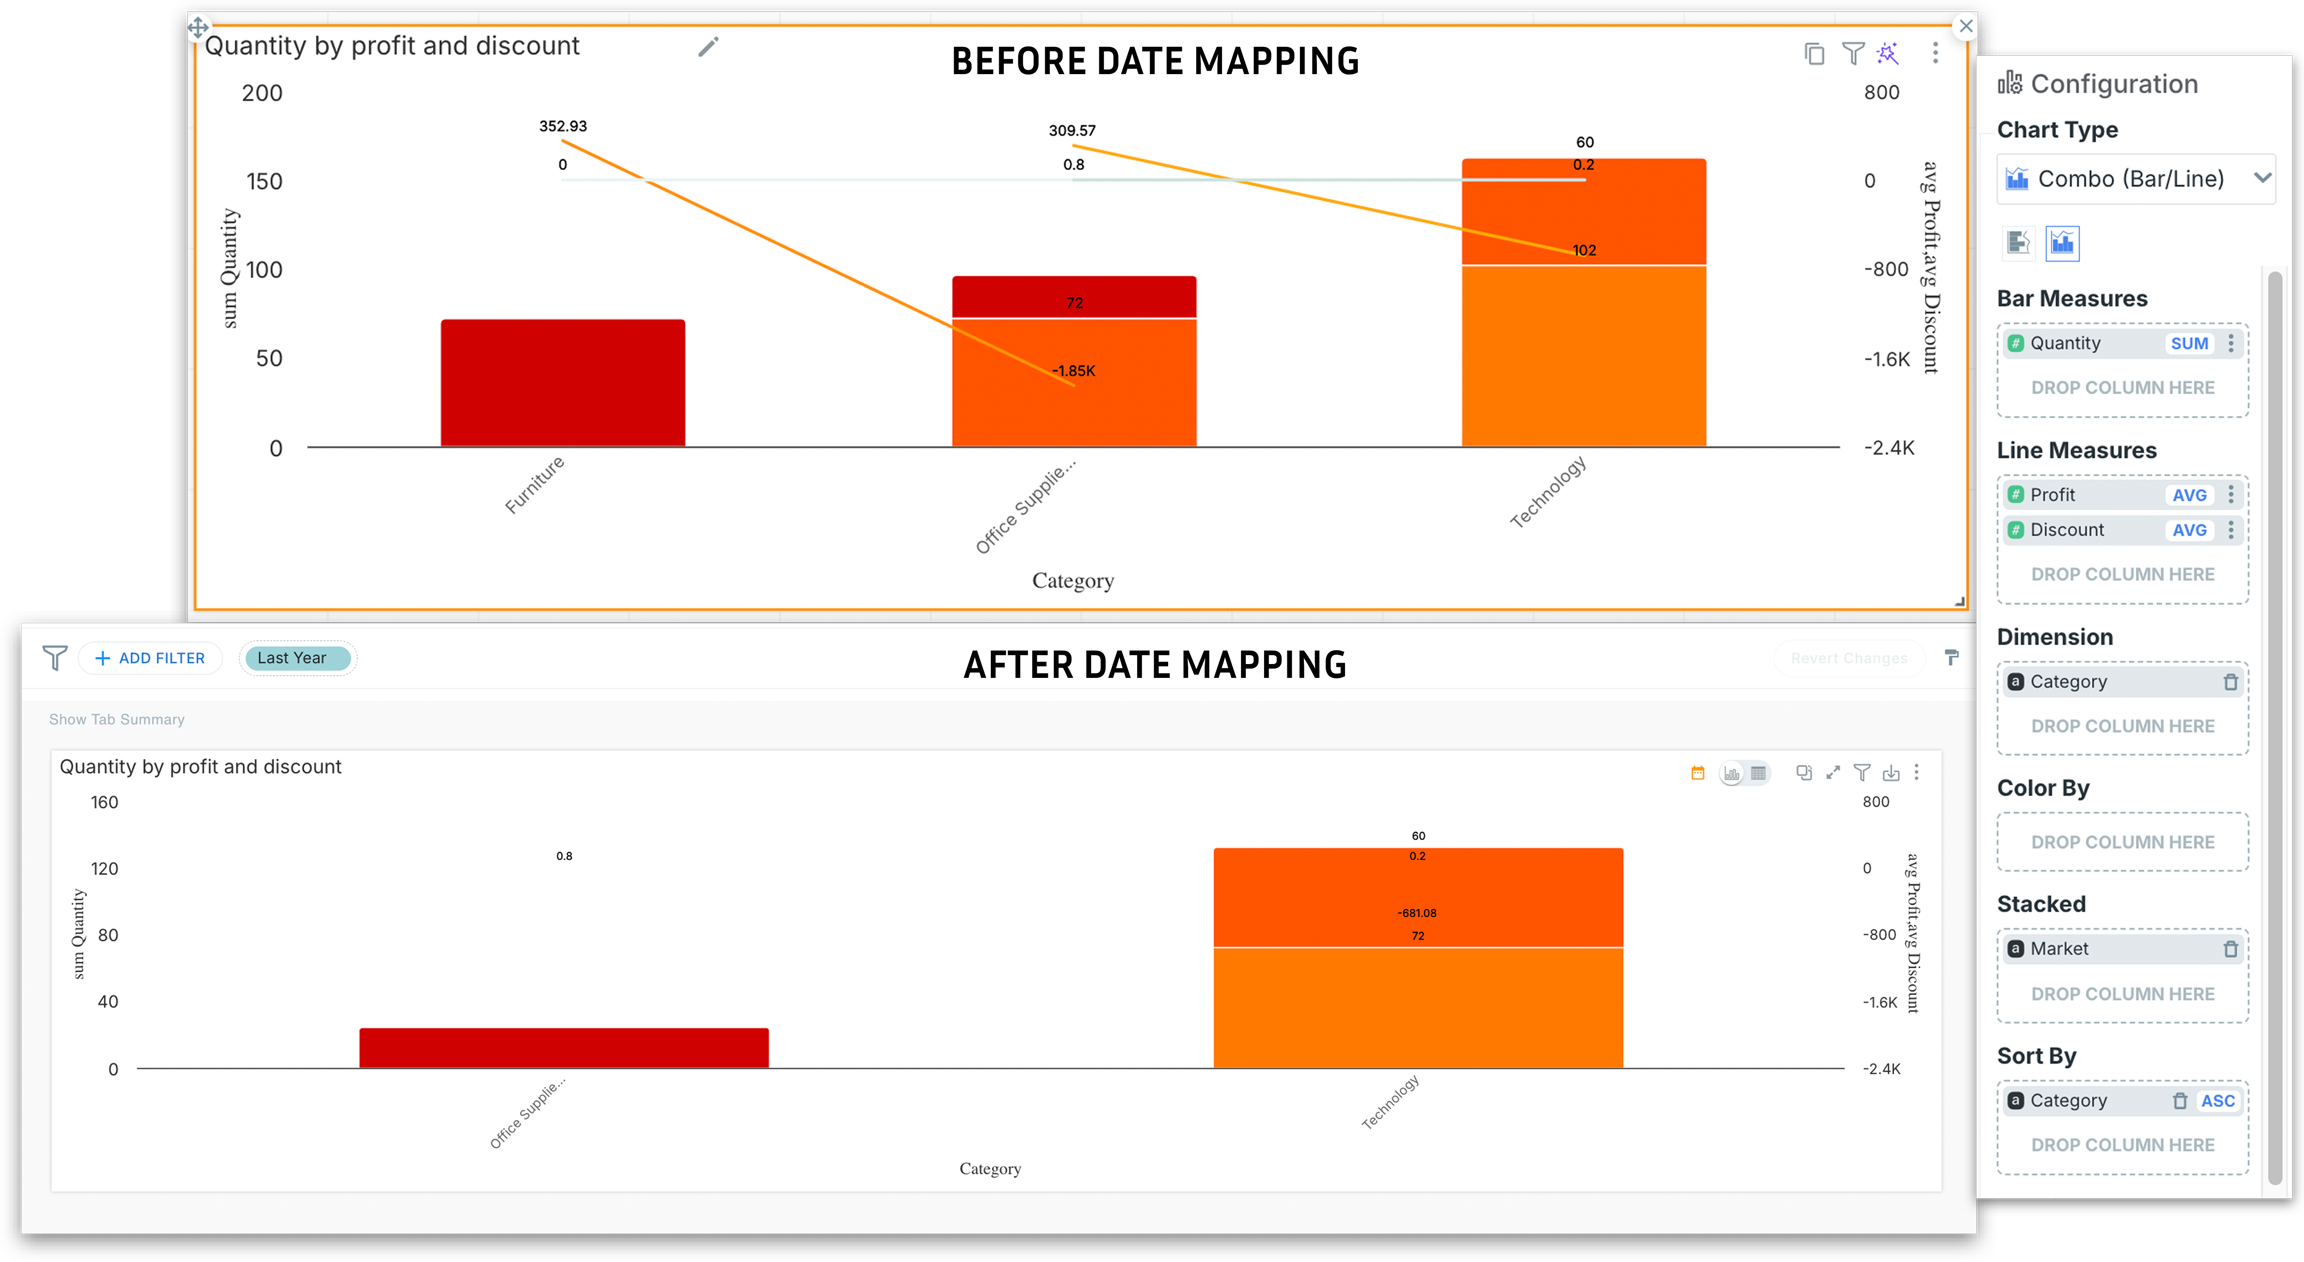
Because you mapped Sales, Quantity, Discount → Order_Date and chose Last year with Date mapping enabled, Tellius first kept only the rows whose Order_Date fell in last year. Then it aggregated by Category.
Without mapping, the time filter could have hit a different date column or been applied across measures. Mapping forces the filter to use the correct date per metric, so your bars and lines are apples-to-apples for “last year.”
Was this helpful?