
Release 4.1
Tellius 4.1 introduces powerful metadata management, data dictionaries, ranked columns, multi-user Feed subscriptions, enhanced Vizpads, and smarter search.
Released in February 2023
We welcome 2023 with a whole new release! 🎉 We’re stoked to announce the latest version of Tellius, 4.1, which comes equipped with a collection of exciting features focused on improving context, collaboration, and visibility. Here is the comprehensive list of features and improvements introduced in 4.1:
🚀 New features
Metadata for columns
Understanding the context of every column helps business teams leverage their data and visualize insights faster. So we’ve introduced a metadata view to empower users with an optimal view of all the information about their data in one place.
With this feature, users will be able to add the following types of metadata during data preparation:
Column description
Display name
Data format
Data aggregation
Data type
Include/Exclude columns for Insights and Predict
Synonyms
Special type
Rank
Indexing
Column type
Feature type
Users can easily edit and sort the metadata of each column. The values will be reflected throughout the platform (Search, Insights, Vizpads, Predict, Feed, and Data).
In a dataset, multiple columns can be selected, and changes can be applied to them in bulk.
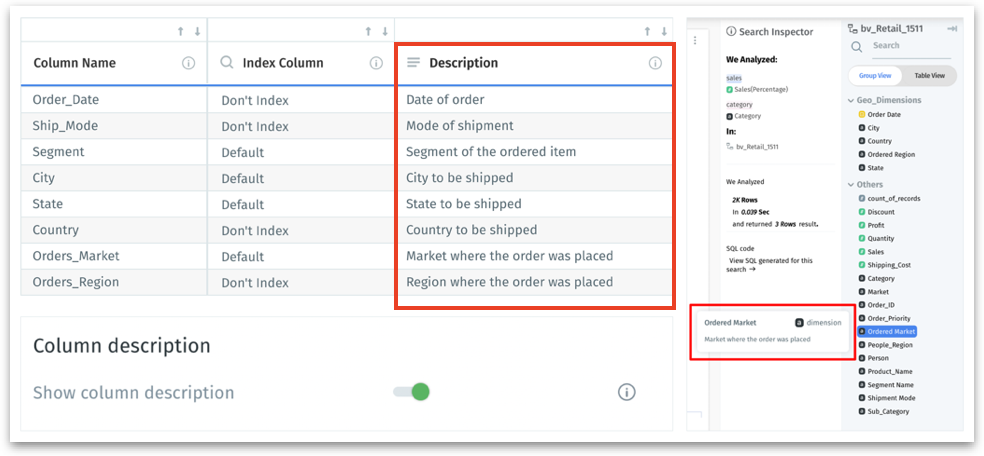
Data dictonary for columns
Data dictionary is included to help users interpret the context of each column. Across the platform, when a user hovers over a column, its corresponding description and the type of column (measure/dimension) will be displayed in the tooltip. The metadata facilitates business users to be more aware of the descriptions of columns defined in a dataset.
The description of each column needs to be set up in the metadata view during data preparation. Also, the option Show Column Description needs to be enabled under Settings to view the description on contextual tooltips.
Selection of columns for analysis
During data preparation, users have the flexibility to choose the columns to be included for analysis. Every column comes with a toggle option to be included in Insights and Predict. The unselected columns will be excluded from any analysis by default unless modified by the user. The Insight Configuration and Insight Summary will display the list of included and excluded columns along with the reason for exclusion.
Provision to rank columns
During data preparation for live datasets, users can rank the columns (from 1 to 20) to prioritize them over the non-ranked columns. The ranked columns get auto-picked for Live Insights.
If required, a ranked column can still be excluded from Insights or Predict. The ability to rank is unavailable for non-live datasets.
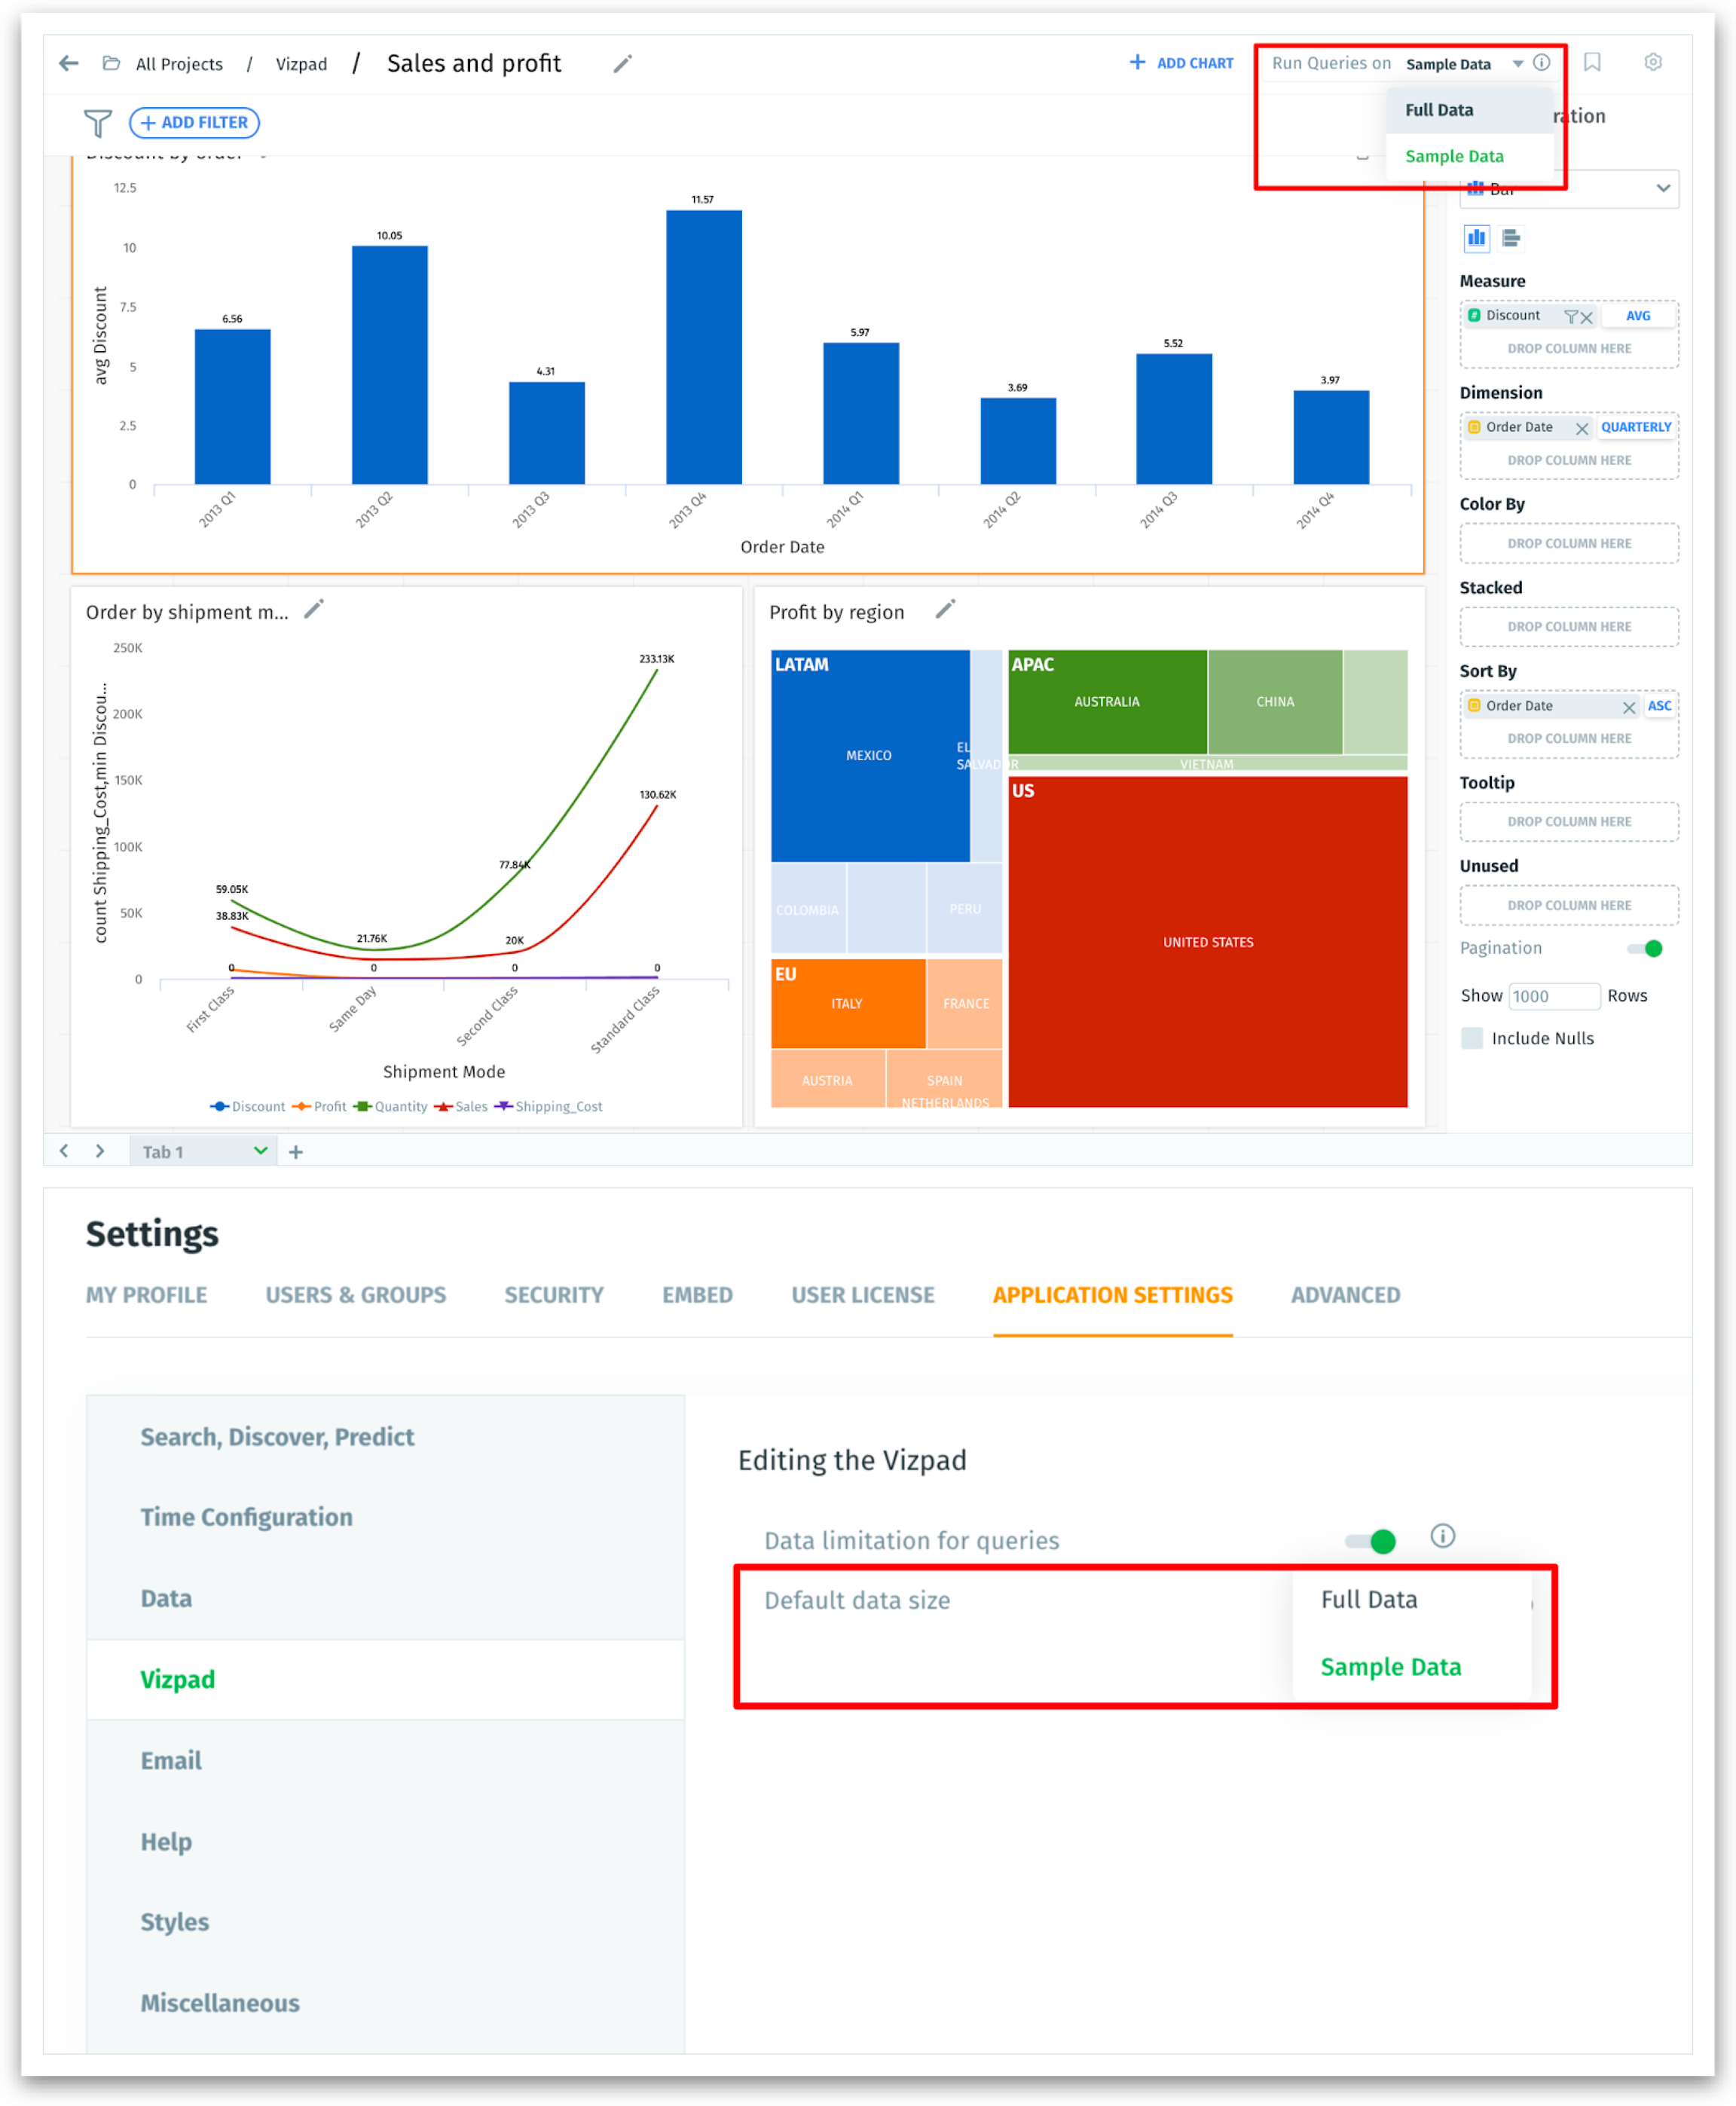
Processing of queries on sample data
Usually, when users create a chart in Vizpad, the results will be rendered for the entire dataset. To avoid the time-consuming overhead of processing large datasets, Tellius introduces a way to run the queries on a limited dataset (sample data). The feature helps save time and makes the overall Vizpad building process more efficient. In the Settings page, admins can enable/disable the option to run the queries on sample data.
The sample data is applicable only while building the Vizpad. Once the Vizpad is saved, the results will be displayed, utilizing the entire dataset.
Multi-user subscription to Feed
Since only the creator of the Feed receives email alerts, Tellius introduces a way for anyone interested in the Feed to subscribe to get regular email alerts. To avoid duplication of Feeds, a new Feed will be created only after checking for any similar Feed. The user can either subscribe to the existing Feed to receive periodic updates or create a new Feed.
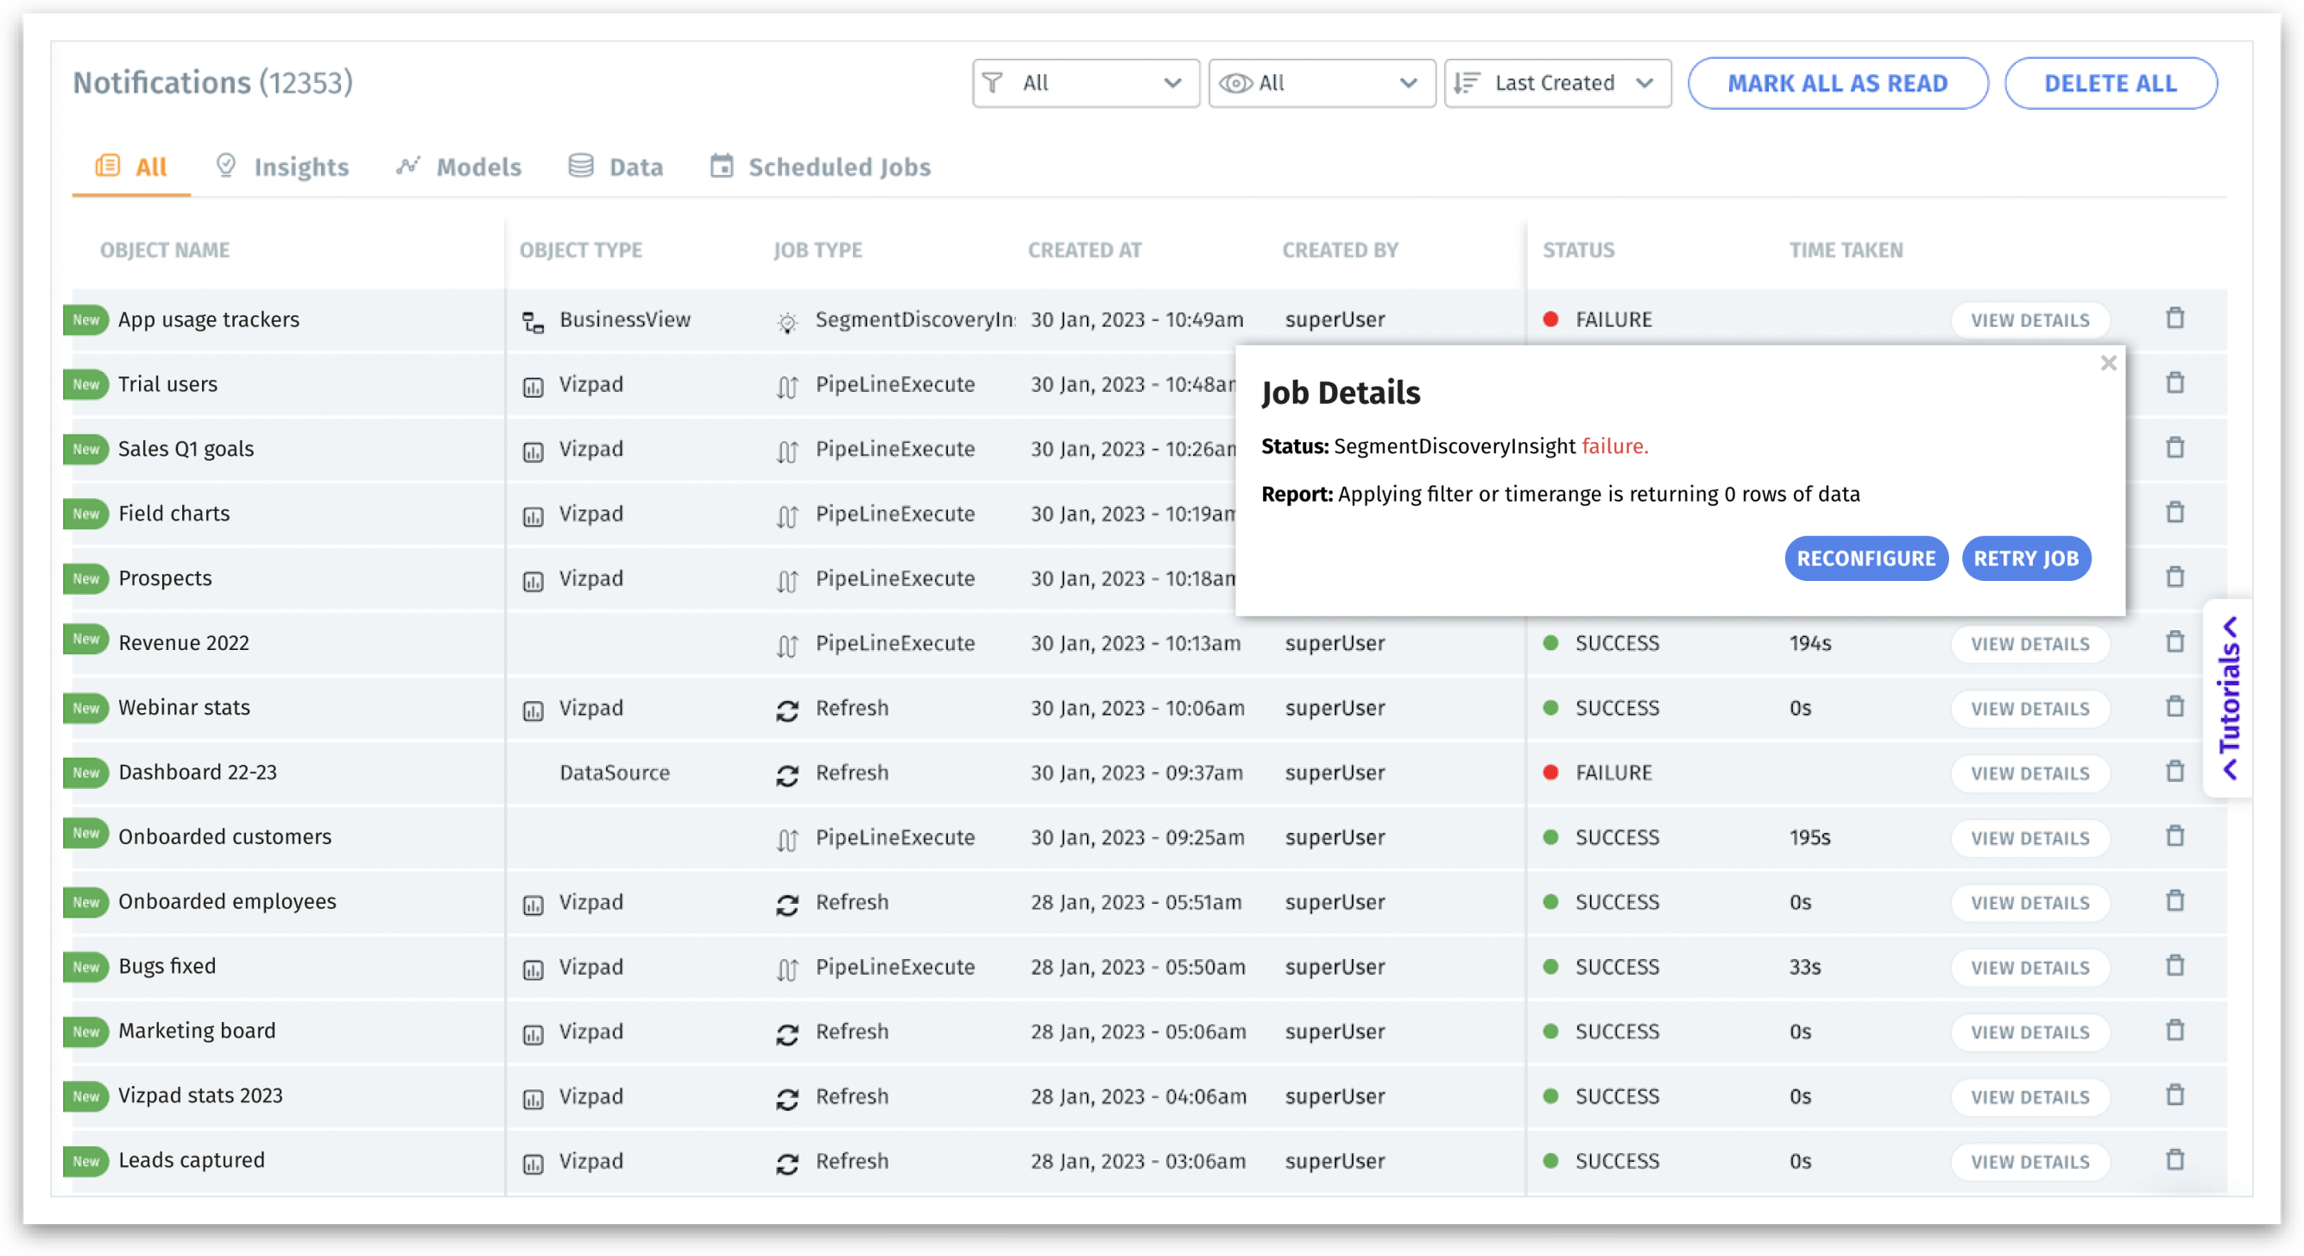
Additional metadata on the Notifications page
The Notifications page now displays the metadata (name, type) of every object associated with a job. The metadata enables the user to correlate the type of an executed job with an actual object. If required, users can choose to retry specific failed jobs.
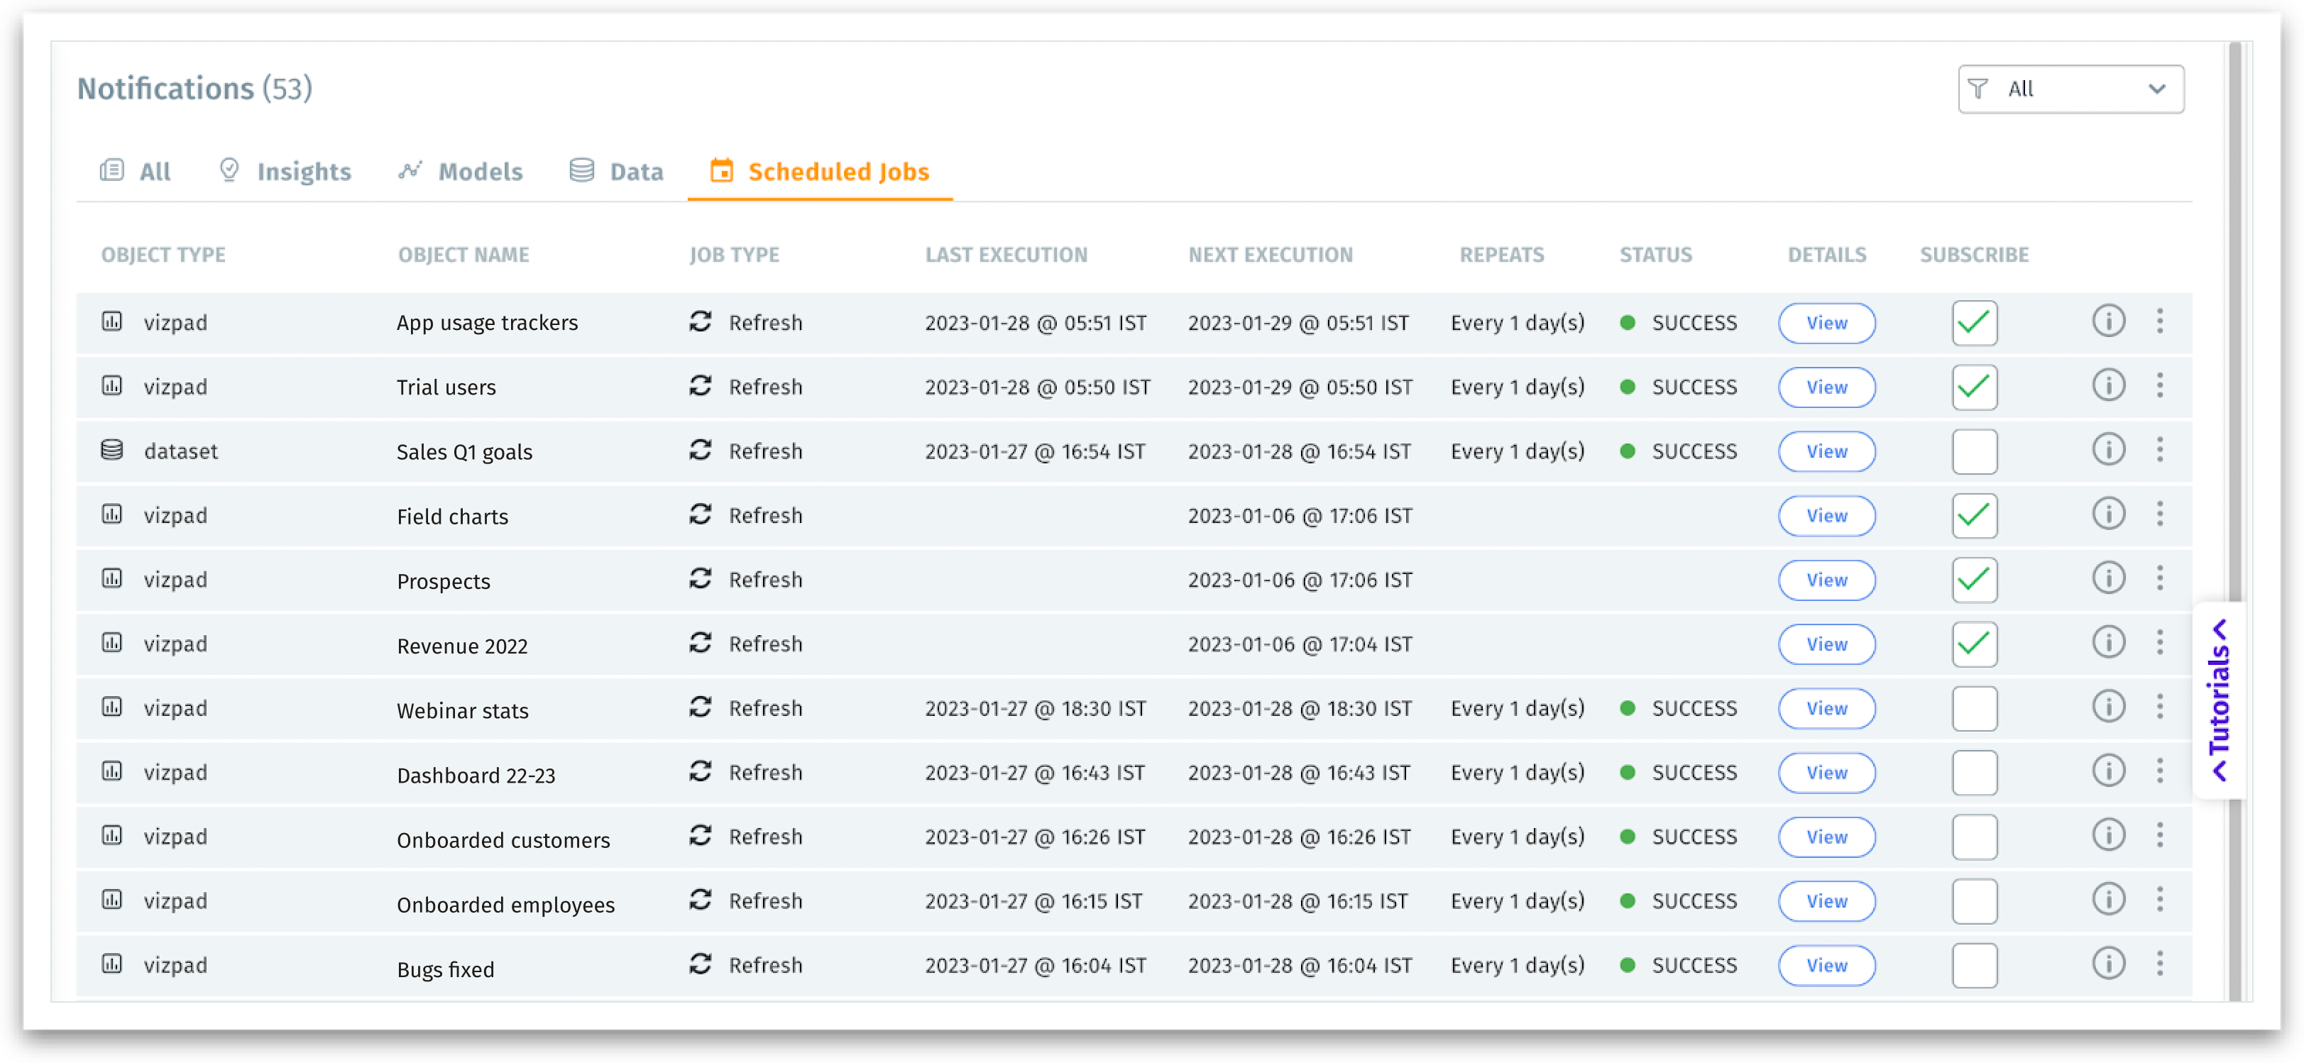
Subscription to scheduled jobs
A new tab has been added to display all the scheduled jobs associated with objects accessible to a user. Users can subscribe to the required jobs to receive regular email notifications. It provides a way to monitor the status (success/failure) of the job and stay informed of the objects shared with them.
Kerberos-based authentication for Spark SQL
Now, users can access Spark SQL tables via Kerberos. In addition to authenticating via username and password, the Spark SQL connector supports Kerberos-based authentication.
📈 Enhancements
Display of columns in Search and Tellius Assistant
To enhance the search experience and help users be more informed of the columns in a business view, the following improvements have been added:
Search - When a search query is being typed, the columns present in the corresponding business view will be displayed in the right pane, organized under Group View and Table View. Once a query is successfully executed, the same details will be pinned next to the Search Inspector.
Tellius Assistant - Once a business view is selected, the columns will be displayed in the right pane.
Users can show/hide the business view details as required.
‘Weekly’ aggregation enhancements for date filters
In a Vizpad chart, when users choose a date column with ‘weekly’ aggregation as the dimension, the following improvements will be applicable:
The actual weekend dates will be displayed in the chart instead of weekend numbers.
A toggle option has been included in the Application Settings to set weekend dates as default when date filters are applied.
Additional treemap algorithms
In a Vizpad chart, users can change the treemap algorithm to represent hierarchical data. Tellius now supports all four algorithms by Highcharts:
Slice and Dice (applied by default)
Squarified
Stripes
Strip
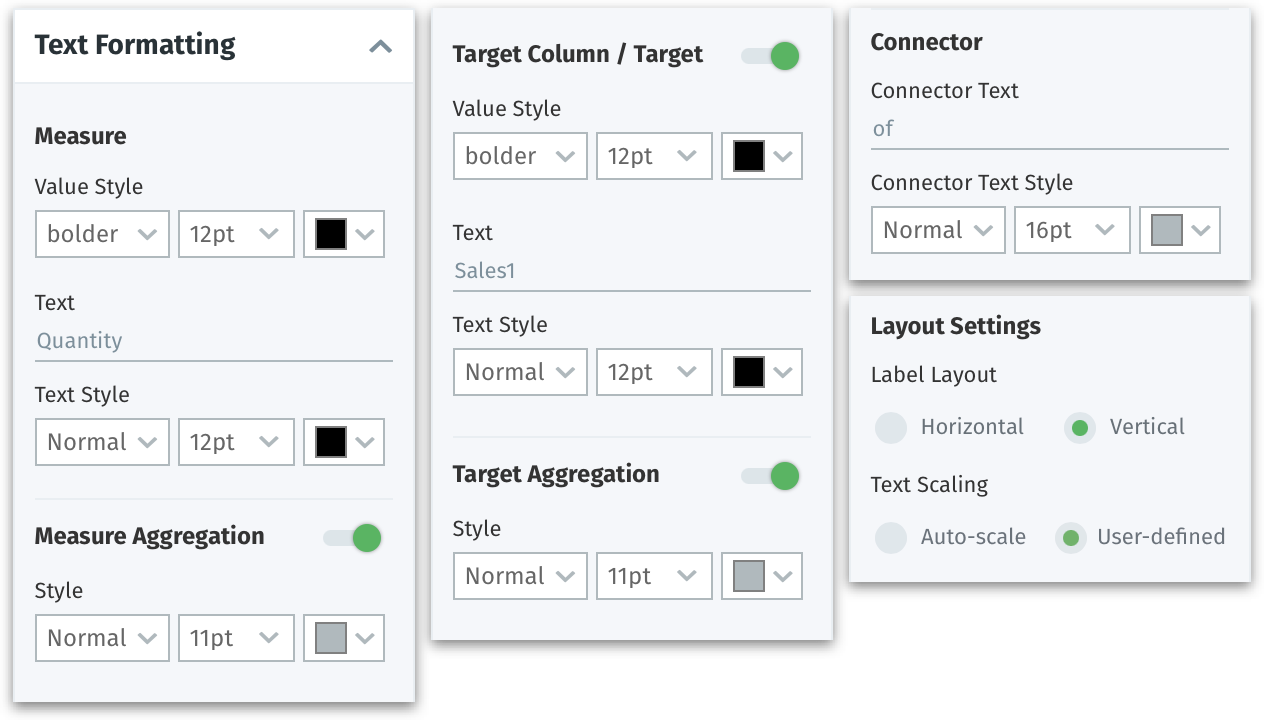
Enriched KPI target chart
To enhance the KPI target chart’s readability, we’ve introduced a way to easily customize and format the font size, font color and style of the following:
Measure (title and values) and aggregation
Target columns (title and values)
Connector text (such as ‘of’)
Users have the flexibility to customize the font size displayed in KPI and KPI target charts using the following two options:
Auto-scale - Tellius chooses a responsive sizing based on the size of the chart and length of the text
User-defined - The font size set by the user will be considered.
Users can also show/hide aggregation, connector text, and target columns. The text in the chart can be aligned horizontally/vertically and arranged relative/fixed as required.
Vizpads generation on intranet
Tellius has introduced a way to improve the user adoption of Vizpads when they are connected to an on-premises network. Vizpads can be opened seamlessly from scheduled emails when users are logged in to Tellius without an outbound internet connection. The required URLs to be configured are included in Settings to support the rendering of Vizpads and to prevent timeout errors:
Feature importance of columns
A new tab Feature Importance has been added to display the importance of each column. Once a model has been created using XGBoost or regression algorithm, the feature importance would be displayed in percentages as a part of the Model summary.
Share objects using name
Across Tellius, users can now share an object (Vizpad, chart, Insight, Model) by typing in the user’s first name or last name. The email IDs associated with the names would be automatically displayed for more clarity.
Data type of cluster labels
Once clustering is done, the cluster labels will be created with the data type: dimensions (String) instead of measures (numeric) so as to enable users to categorize and visualize data in different charts.
Proxy support for connectors
Tellius now supports proxy configuration to connect with Salesforce and Google Analytics. Users can avail of the optional proxy support to seamlessly load the datasets.
Forbidden Python libraries
The following libraries have been removed and thus cannot be imported into Python during data preparation.
shlex
sh
plumbum
pexpect
fabric
envoy
commands
os
subprocess
requests
🛠️ Minor fixes
The Vizpad rendering, loading, and performance issues (side panel, tooltip, CSS, Anomalies, garbage collection) have been fixed and optimized.
The switching between different tabs in a Vizpad has been made seamless, with the warning message displayed only when any changes are made to the current tab.
HTML tags included in the Search queries will be sanitized and rejected with an “Invalid query” error.
For bar, line, and combo charts, data will not be plotted for null values unless “Include null values” is selected by the user.
The default aggregation set for a column (measure) during data preparation will be reflected across the platform unless modified by the user.
Conditional formatting and number formatting capabilities have been fixed for KPI charts.
The visibility of data labels for the waterfall charts has been rectified.
The dataset renaming issue for DataFusion has been fixed.
Filtering of high cardinality columns using a Vizpad list has been fixed.
The date format displayed in the downloaded Vizpad charts (in CSV format) has been rectified.
The timeout limit for the generation of multiple reports on Vizpad has been increased.
The gaps in email settings and SMTP configurations have been fixed now.
⛔ Deprecation
In the upcoming release 4.2, connecting directly to BigQuery data tables via GCS bucket feature will be deprecated.
Was this helpful?