👁️Actions in View mode
Explore the actions available in Vizpad View mode—switch metrics, adjust resolutions, export charts, apply filters, and manage custom views without editing the original.
Vizpad-level actions
Users without edit permissions will be restricted only to the View mode. The following operations can be performed in View mode:

Anomalies - Show/hide anomalies
Favorite - Mark/Unmark the Vizpad as favorite
Query execution time - Show/hide query execution time
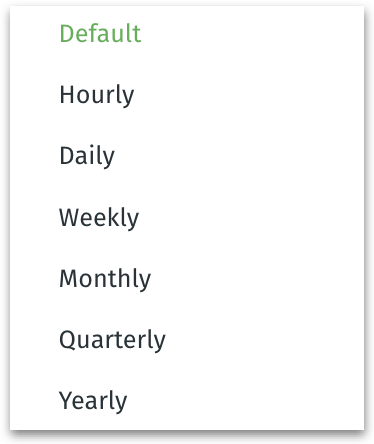
Resolution - Change the global resolution of the charts in the Vizpad. If chart A is prepared for yearly resolution and chart B is prepared for weekly resolution, then clicking on this icon and choosing Monthly resolution will change charts A and B to have monthly resolution.
Notification - Sends a snapshot of the Vizpad as an email to the specified user at the specified time.
Export - Download the Vizpad in PDF or PPT format.
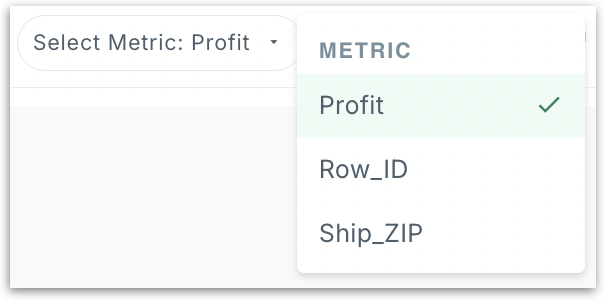
Switch Metric - Switch Metric lets you replace a chart’s current measure with another measure. Click on Switch Metric to see the list of available measures (this can be configured in Vizpad Edit mode). Once you pick the measure you want, all charts that use the original measure will automatically re-render with the new metric.
Please note that any changes made in View mode are strictly for temporary viewing. The changes are not permanent, and they will not be saved to the original Vizpad. To retain any changes, they must be made in the Edit mode. However, you can save Custom Views in View mode, so the changes made will persist for that Custom View.
To revert the Vizpad to its original state and undo all the changes, click on Reset Vizpad near the colored circles representing the Business View(s) used in the Vizpad.

Viz-level actions
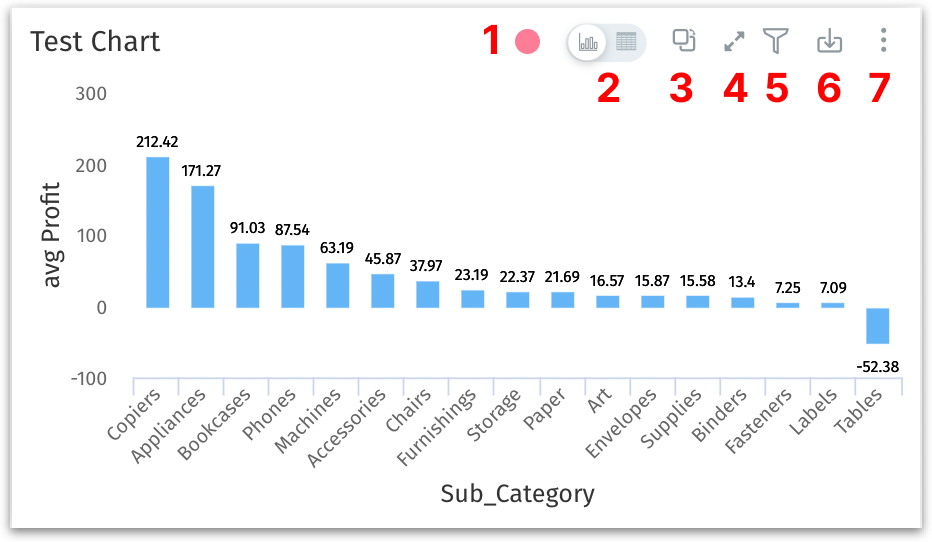
Hover over any chart to view more details in tooltips. Hover over any individual Vizpad in its top right corner to view the following options:
Business View color
The circle of color represents the Business View associated with the Viz. If a Viz has data from multiple Business Views, then multiple colored circles can be found. Hover over any circle and the associated Business View will be displayed as a tooltip.
The legend for the colored circles can be found in the top right corner of the Vizpad near the eye 👁️ icon. Click on the 👁️ icon if you want to show/hide the circles of color across the Vizpad.
View Chart/View Data
Click on this icon to switch between the visual chart representation and its underlying table data.
Alternatively, click on the three-dot menu and select "Detailed View". This will present the chart data in a tabular format.
Click on this icon and the available chart types will be displayed. The charts that are incompatible will be greyed out automatically.
The existing chart will be converted to the selected chart type, where all current values and filters will remain applied.
Resize
Click on this icon to enlarge the chart or contract to its default size.
Filter
To apply filters, click on the funnel icon. For more details on applying filters, check out this section.
The option "Use aggregated column from object" allows you to filter using data aggregated at a higher level. This is beneficial when analyzing broader trends or patterns.
Click on the export icon to download the current chart.
Select the preferred format (JPG, PNG, PDF, CSV or PPT) in which the chart needs to be downloaded.
For downloading tables, check out this page.
Three-dot menu
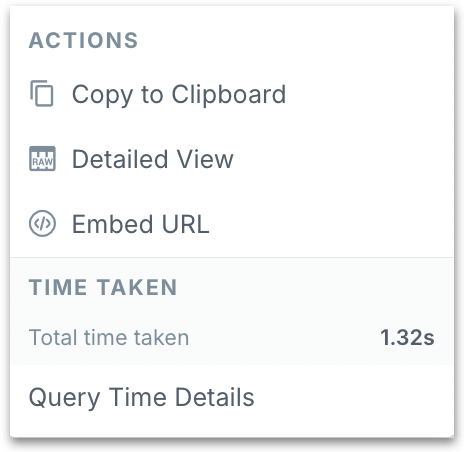
a. Copy to Clipboard: Saves the chart or table to your clipboard, including all associated settings. You can then navigate to any other tab or Vizpad (in Edit mode) and paste it there. For more details, check out this page.
b. Embed URL - Click on Embed URL to get a URL that directly links to that particular chart from your dashboard. This URL, when opened in a different browser tab or embedded into another web page, displays the chart as a standalone element.
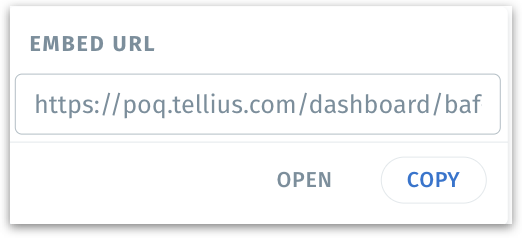
Click on Copy to copy the URL or click on Open to open in an adjacent tab.
Benefits of using Embed URL
To share specific Viz without granting access to the entire dashboard.
For sharing data with stakeholders or team members who only need to see a specific part of your Vizpad, making it easier to communicate specific data points or insights.
To integrate the Viz into web pages, blogs, or your company's intranet.
The embedded Viz will update automatically to the most current data if connected to real-time data.
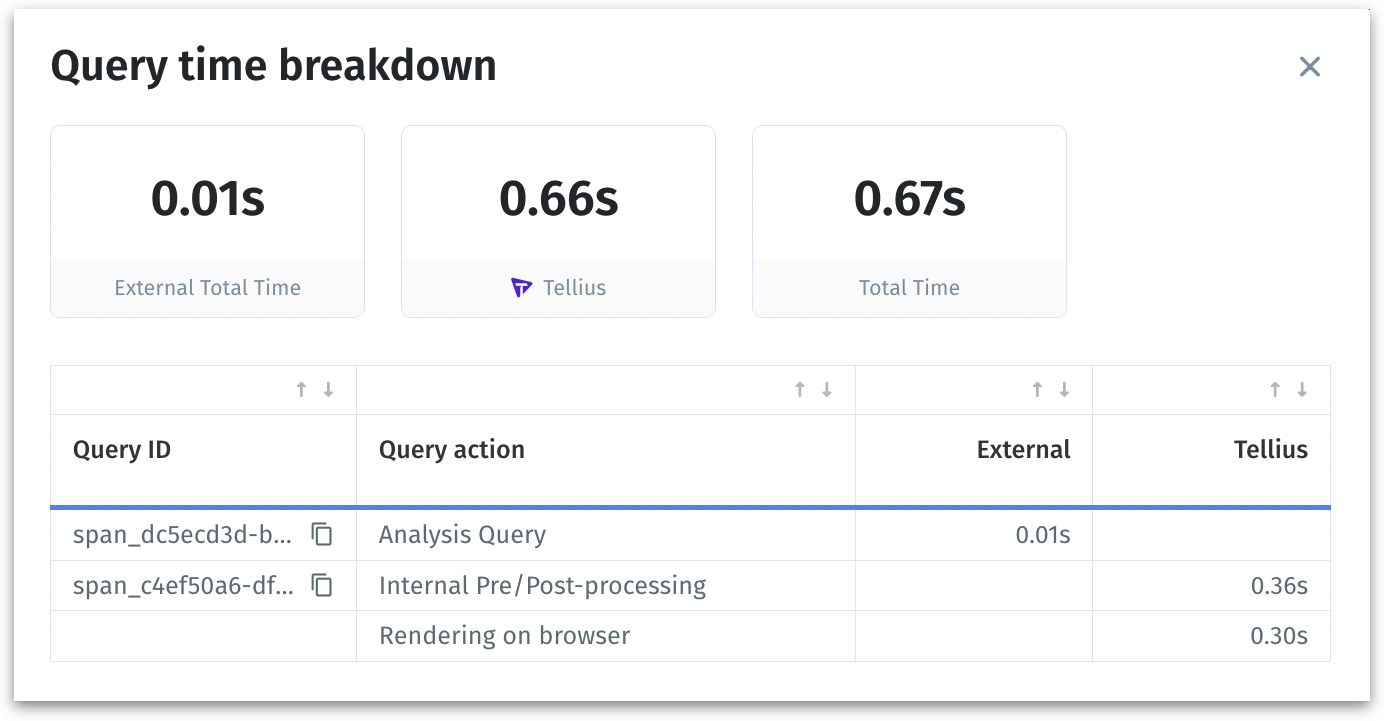
c. Time taken - The time taken to load the chart by Tellius and other external engines will be displayed. Click on Query time details to view the complete breakdown. For more details, check out this page.
Was this helpful?