👋Get familiar with our Data module
Explore the Tellius Data module—connect data sources, build datasets, prepare transformations, and create Business Views that simplify analysis for every user.
The centralized Data interface is designed to manage every stage of this process: from viewing all established data connections to adding new data sources into Tellius, scheduling updates, and customizing your view of data sources.
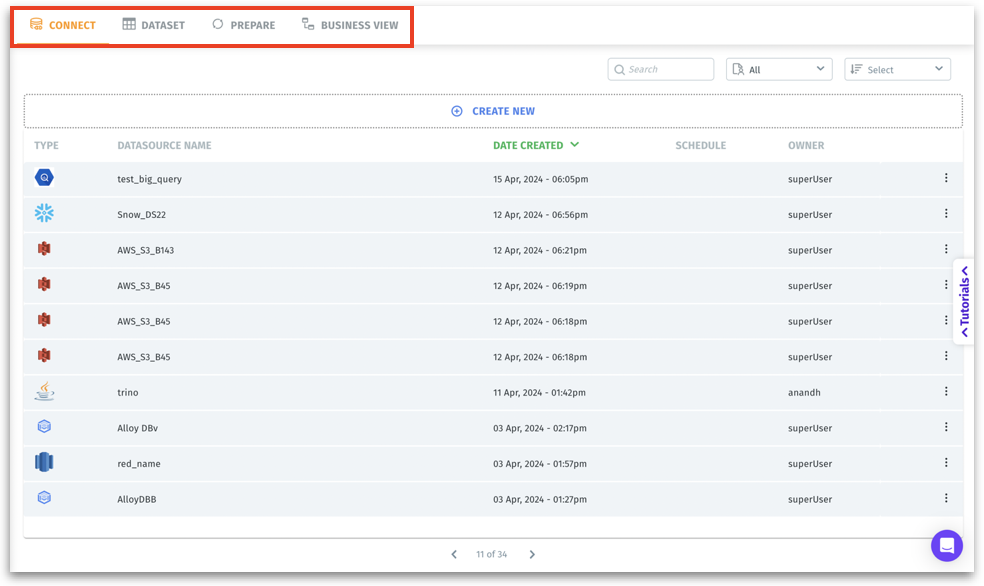
On the Data page, you can find the following four tabs:

Connect: This button/tab leads you to the data connection management interface where you can view, add, and manage data sources. The Connect module is the first step in Tellius’s data lifecycle. Before you can analyze data, you must bring it into the platform.
Dataset: Once data is connected, you move here to create and manage datasets derived from the raw data connections.
Prepare: After having datasets, you come here to transform, cleanse, and enrich them—applying filters, calculations, and joins before analytics.
Business View: The fourth primary navigation point. Defines a semantic layer over your data. This is where you convert your prepared datasets into user-friendly business metrics, attributes, and hierarchies. It enables non-technical users to self-serve analytics without needing to understand raw tables and fields.
Wait, what's a Business View, and how is it different from dataset and data source?
Below is a concise comparison and straightforward explanation that helps you quickly grasp the differences in terminology and workflows within Tellius.
1. Data source
A data source is the external “origin” of your raw data—such as a database, cloud warehouse, CSV file, API endpoint, or SaaS application. Connecting a data source lets Tellius access your raw tables, files, or streams of information.
The “Connect” page is dedicated to data sources. Here, you can:
Add a new connection.
Configure credentials and endpoints.
Test and save the connection.
2. Dataset
A dataset is a curated, structured slice or combination of one or more data sources. After connecting the raw data, you select specific tables, apply joins, filters, and basic transformations to form a refined dataset. Datasets serve as prepared data layers, ready for deeper analysis, exploration, or machine learning.
The “Dataset” page guides you through selecting data from your connected sources.
3. Business View
A Business View (BV) is a semantic layer built on top of datasets. It presents your data in understandable business terms—defining dimensions, measures, hierarchies, and key metrics in language that non-technical users find intuitive.
BVs remove complexity and transform it into a more analytics-ready format, enabling self-service analytics without the need to understand underlying tables and joins. They serve as prepared data layers, ready for deeper analysis, exploration, or machine learning.
The “Business View” page provides a guided workflow where you pick dataset fields, categorize them (as metrics, attributes, or hierarchies), and label them in a business-friendly manner.
Each layer has its own dedicated page and guided steps within Tellius, ensuring you can move logically from data sources to datasets and finally making it a BV through intuitive, step-by-step interfaces.
Data Source: Raw external data connection (configured in the Connect module).
Dataset: Refined data selection layer built from one or multiple data sources (managed in the Dataset module).
Business View: A semantic, business-friendly layer defined on top of datasets (created in the Business View module).
Was this helpful?