🐥Preparing your Business Views
Prepare Business Views in Tellius by organizing datasets, configuring columns, adding calculations, and managing refresh settings for analytics-ready data.
A Business View (BV) is a curated layer that sits on top of one or more datasets. It allows you to define how data is presented to end users, configure calculated fields, organize columns, and control refresh settings—ultimately making data more intuitive and analytics-ready.
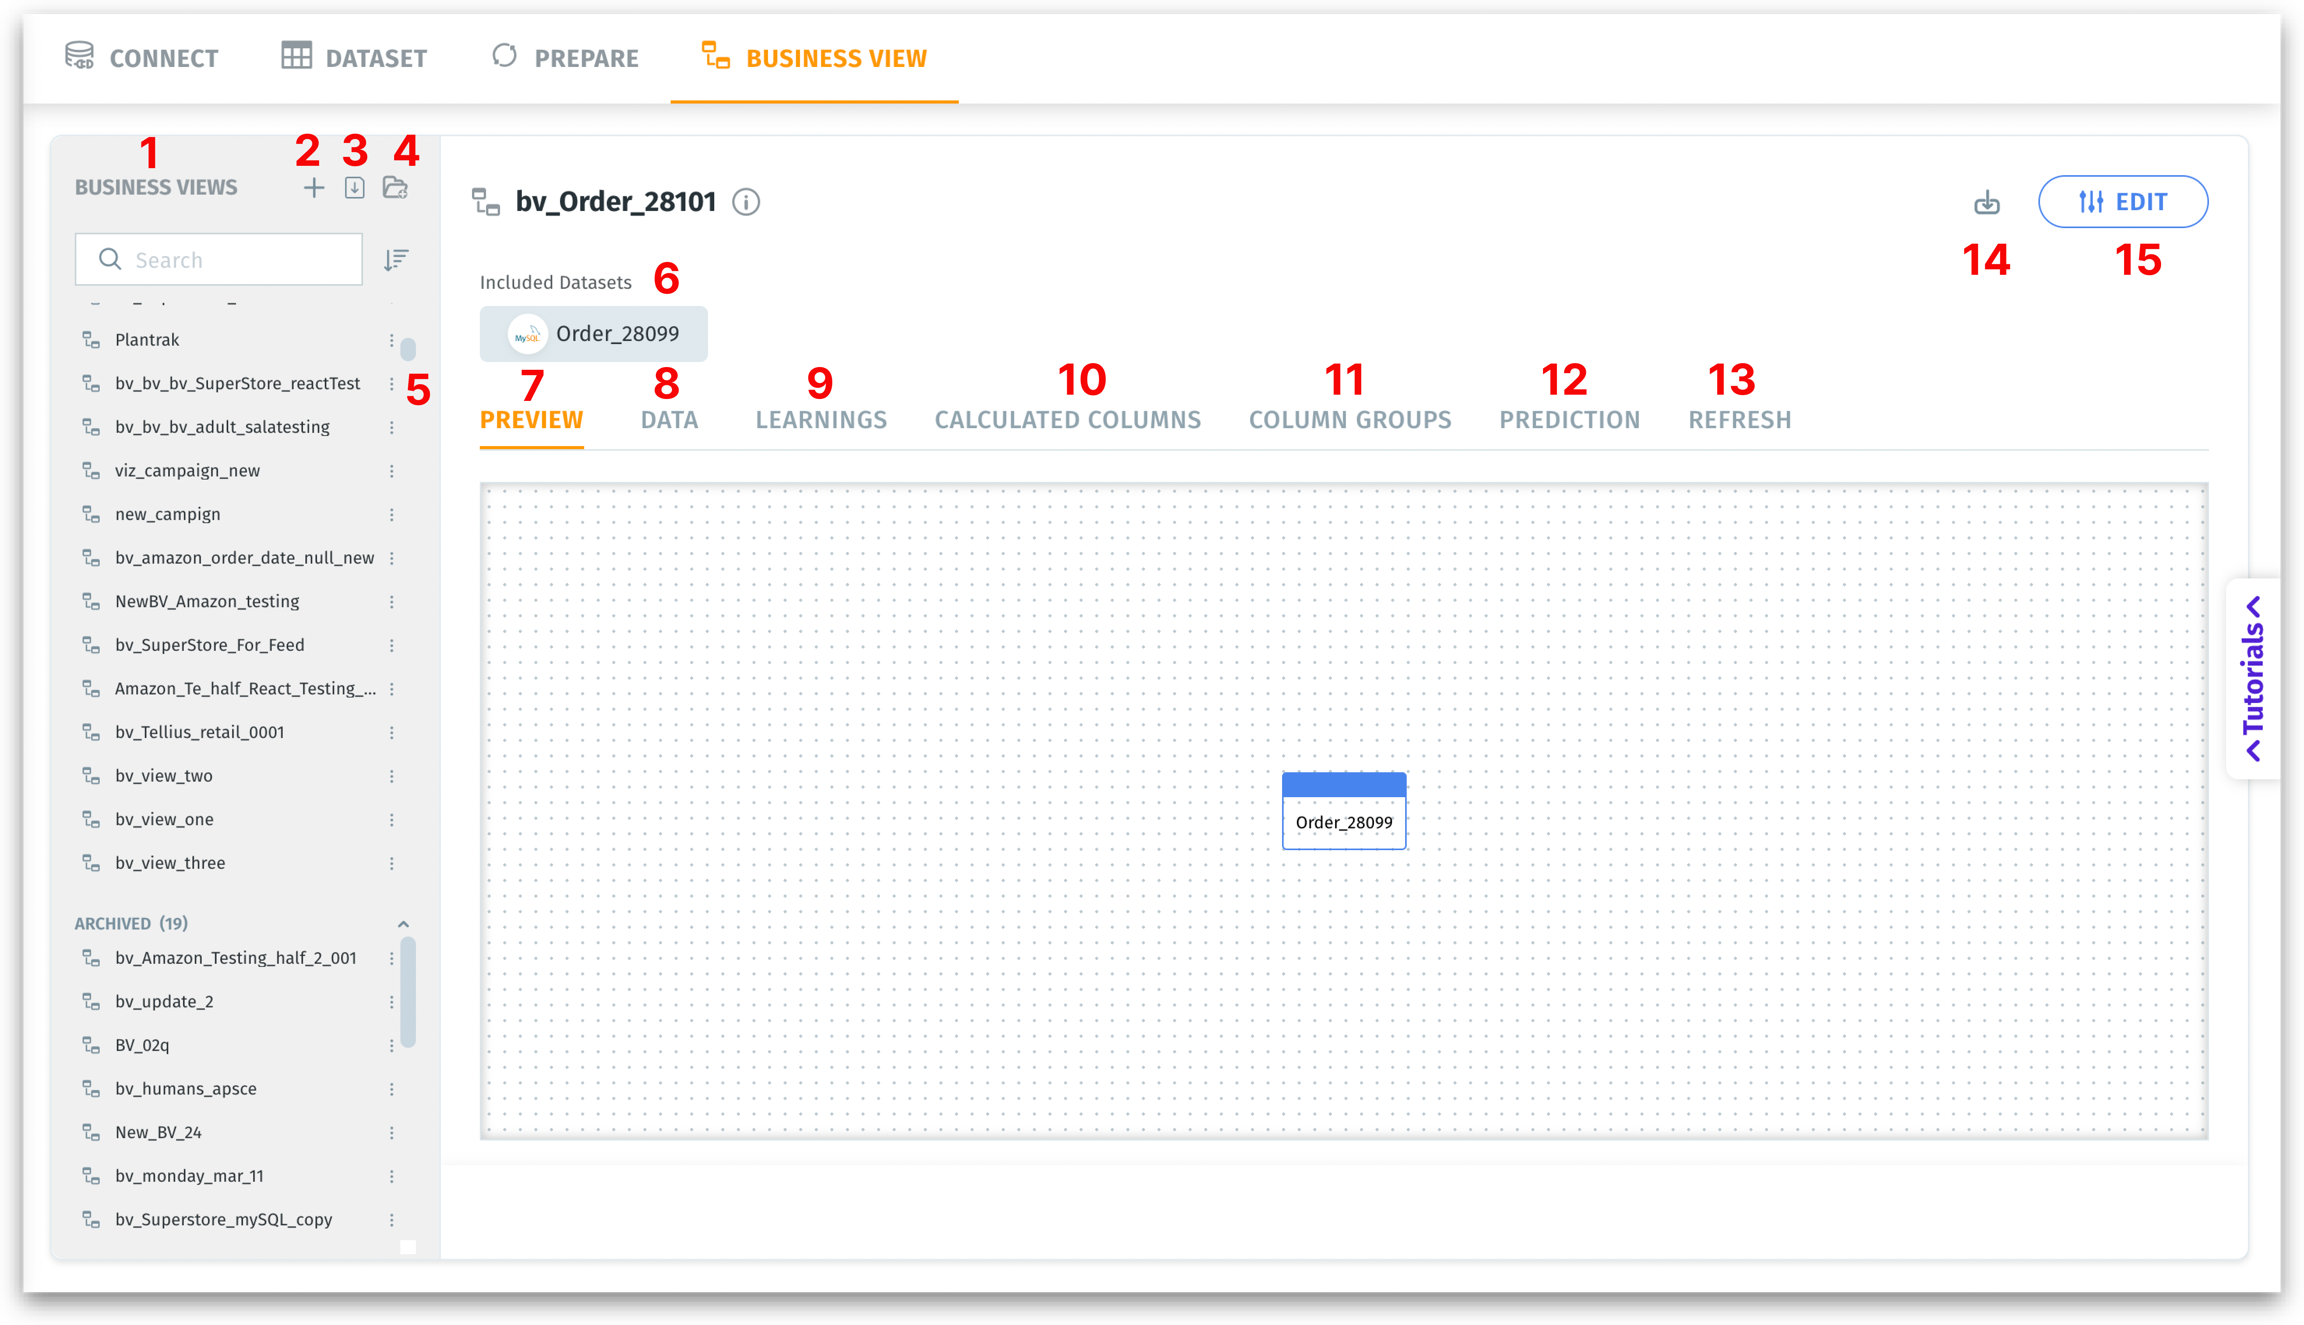
Under Data → Business View (View mode), you will find the following elements:
Business Views (BV) list: Displays the list of Business Views created. This left pane allows you to quickly search and sort Business Views or folders by name.
BVs can be organized into folders.
Live Business Views are indicated with a green dot.
The archived folder at the end contains older or deprecated BVs. You can still access them but they’re separated for clarity.
Click a folder to expand or collapse its contents.
Select a BV to open it in the central workspace.
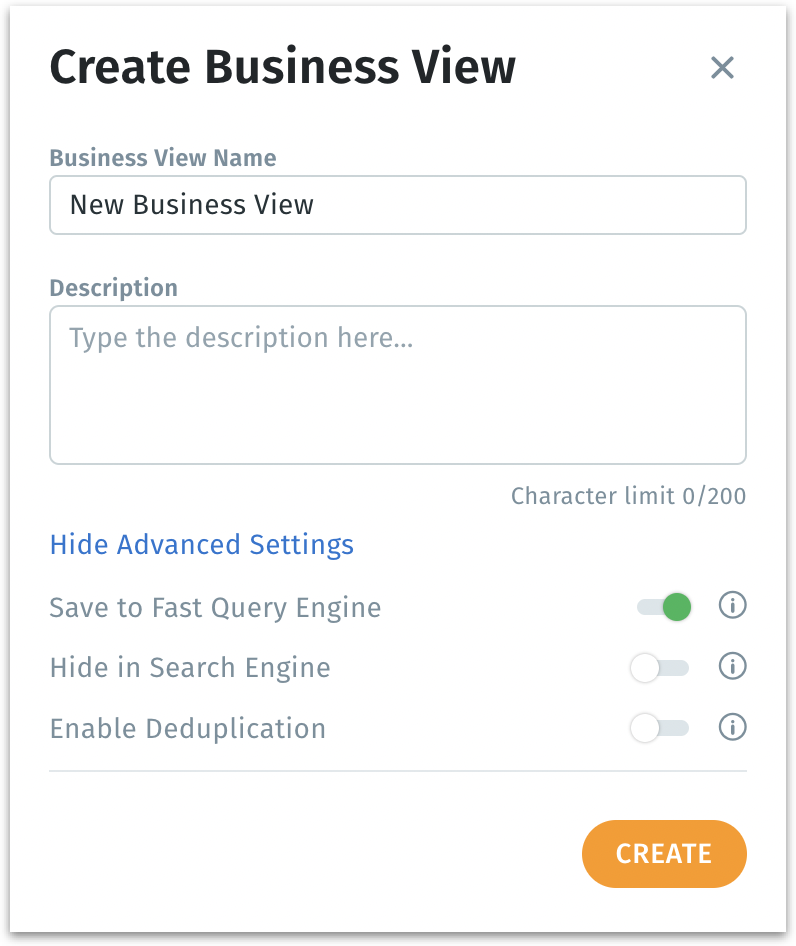
Create new BV: Allows you to create a Business View. The following window appears. For more details, check out this page.
Import Business View: Click on this button to import the required dataset. (Only .zip files are allowed to import)
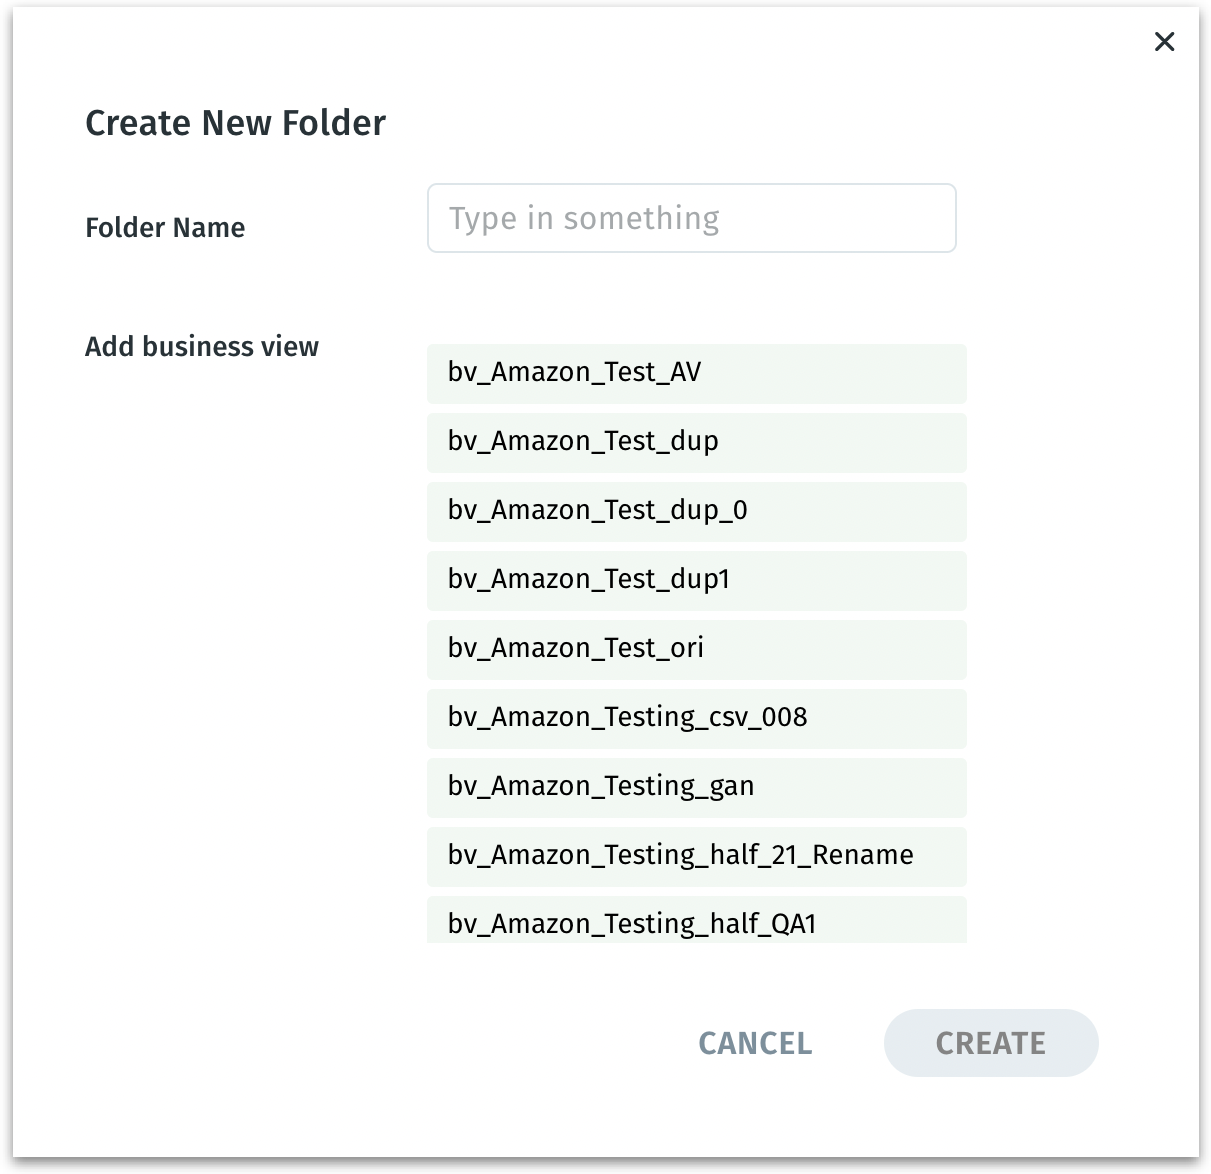
Create a new folder: Creates a new folder to categorize the Business Views. Provide a relevant name and add the required BVs from the available list.
Actions that can be done on a BV: Click on the three-dot kebab menu and the following options will be displayed.
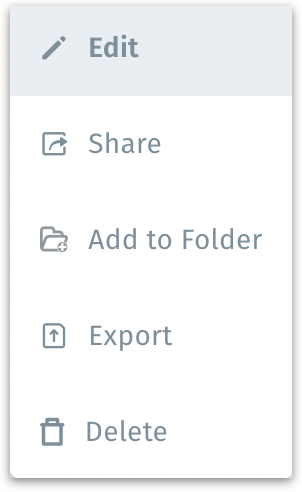
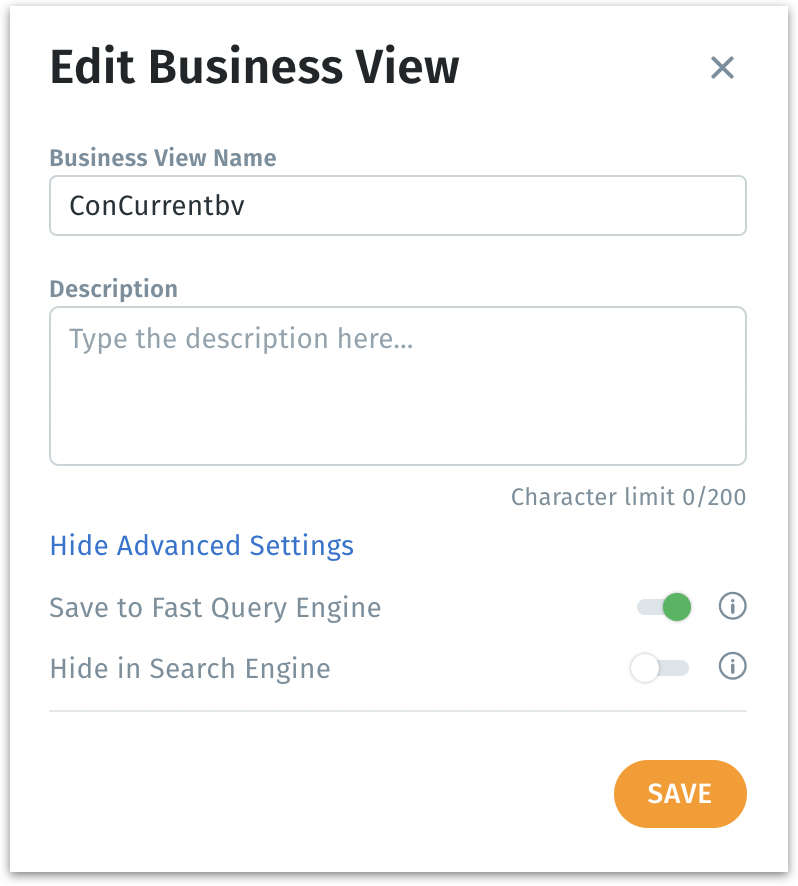
Edit: The following window will be displayed, where you can edit the name, description, and advanced settings of the selected Business View. For more details about the options displayed, check out this page.
Share: Allows you to share the selected Business View. Provide the relevant username or email ID in the following window and select the permissions.

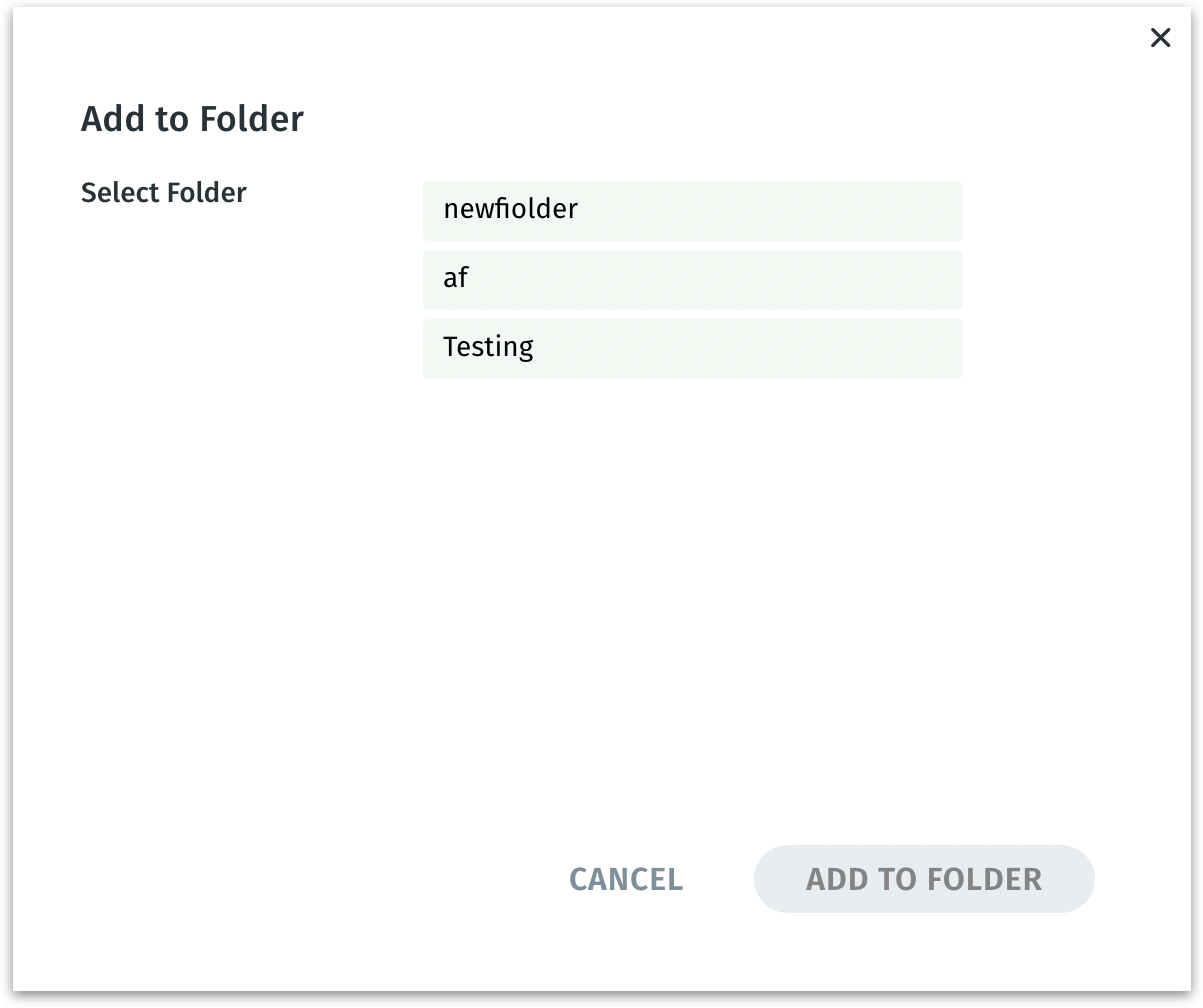
Add to folder: Move the Business View to the desired folder. The list of existing folders will be displayed where you can select the required folder and click on Add to folder.
Export: Downloads the selected Business View in .zip format.
Delete: The following window will be displayed:
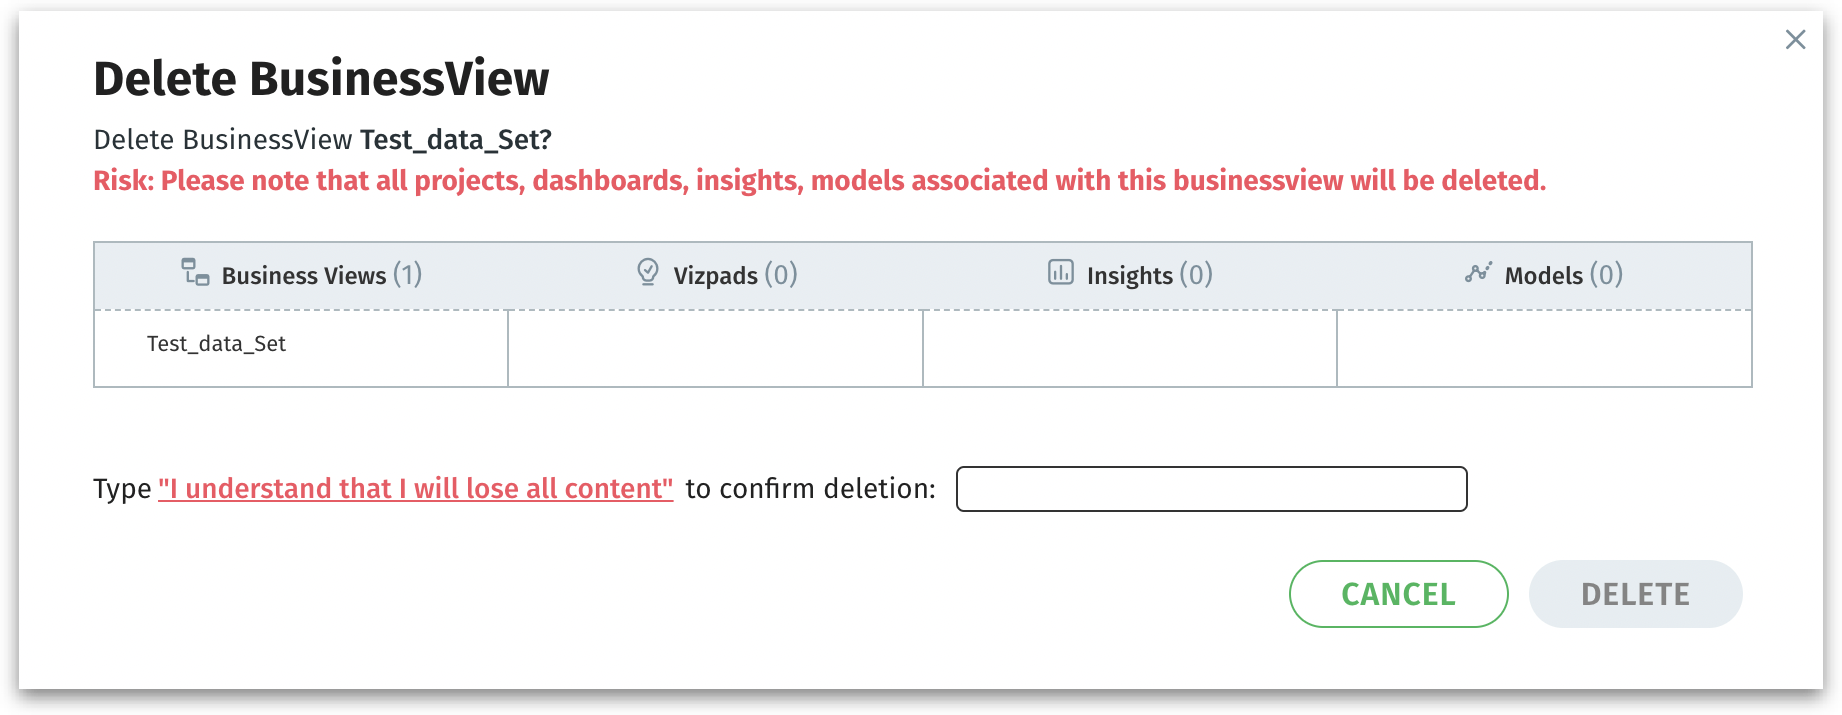
Delete a BV The window clarifies that all downstream content derived from it—datasets, Projects, Vizpads, Insights, Models, and Business Views—will also be removed, preventing accidental deletions.
Prompts you to type the confirmation sentence “I understand that I will lose all content” exactly, acting as a final safeguard. You must explicitly confirm that you’re okay with losing all connected content.
Click on Delete to permanently remove the Business View and all listed objects (Business Views, Insights, etc.) or click on Cancel to discard. Once deleted, this action is irreversible.
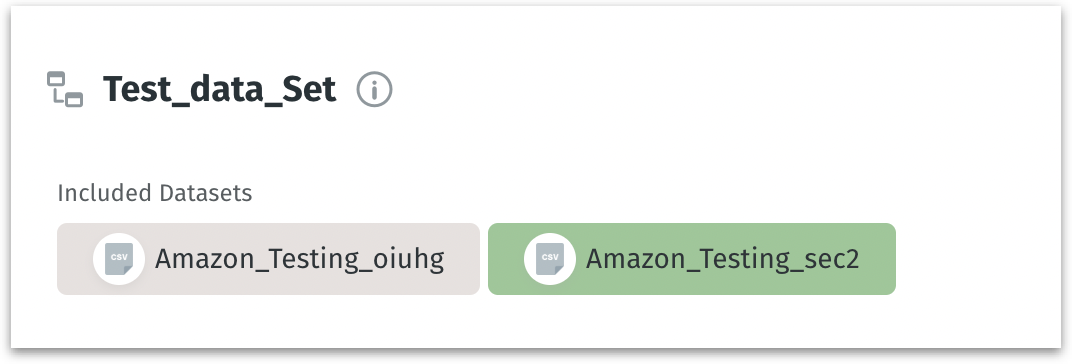
Included Datasets: Lists all the datasets included in creating the Business View.
Click on the info icon next to the Business View name, and the BV description, creator of the BV, created time will be displayed. You can also click on Share button to share the Business View with the required users and groups.

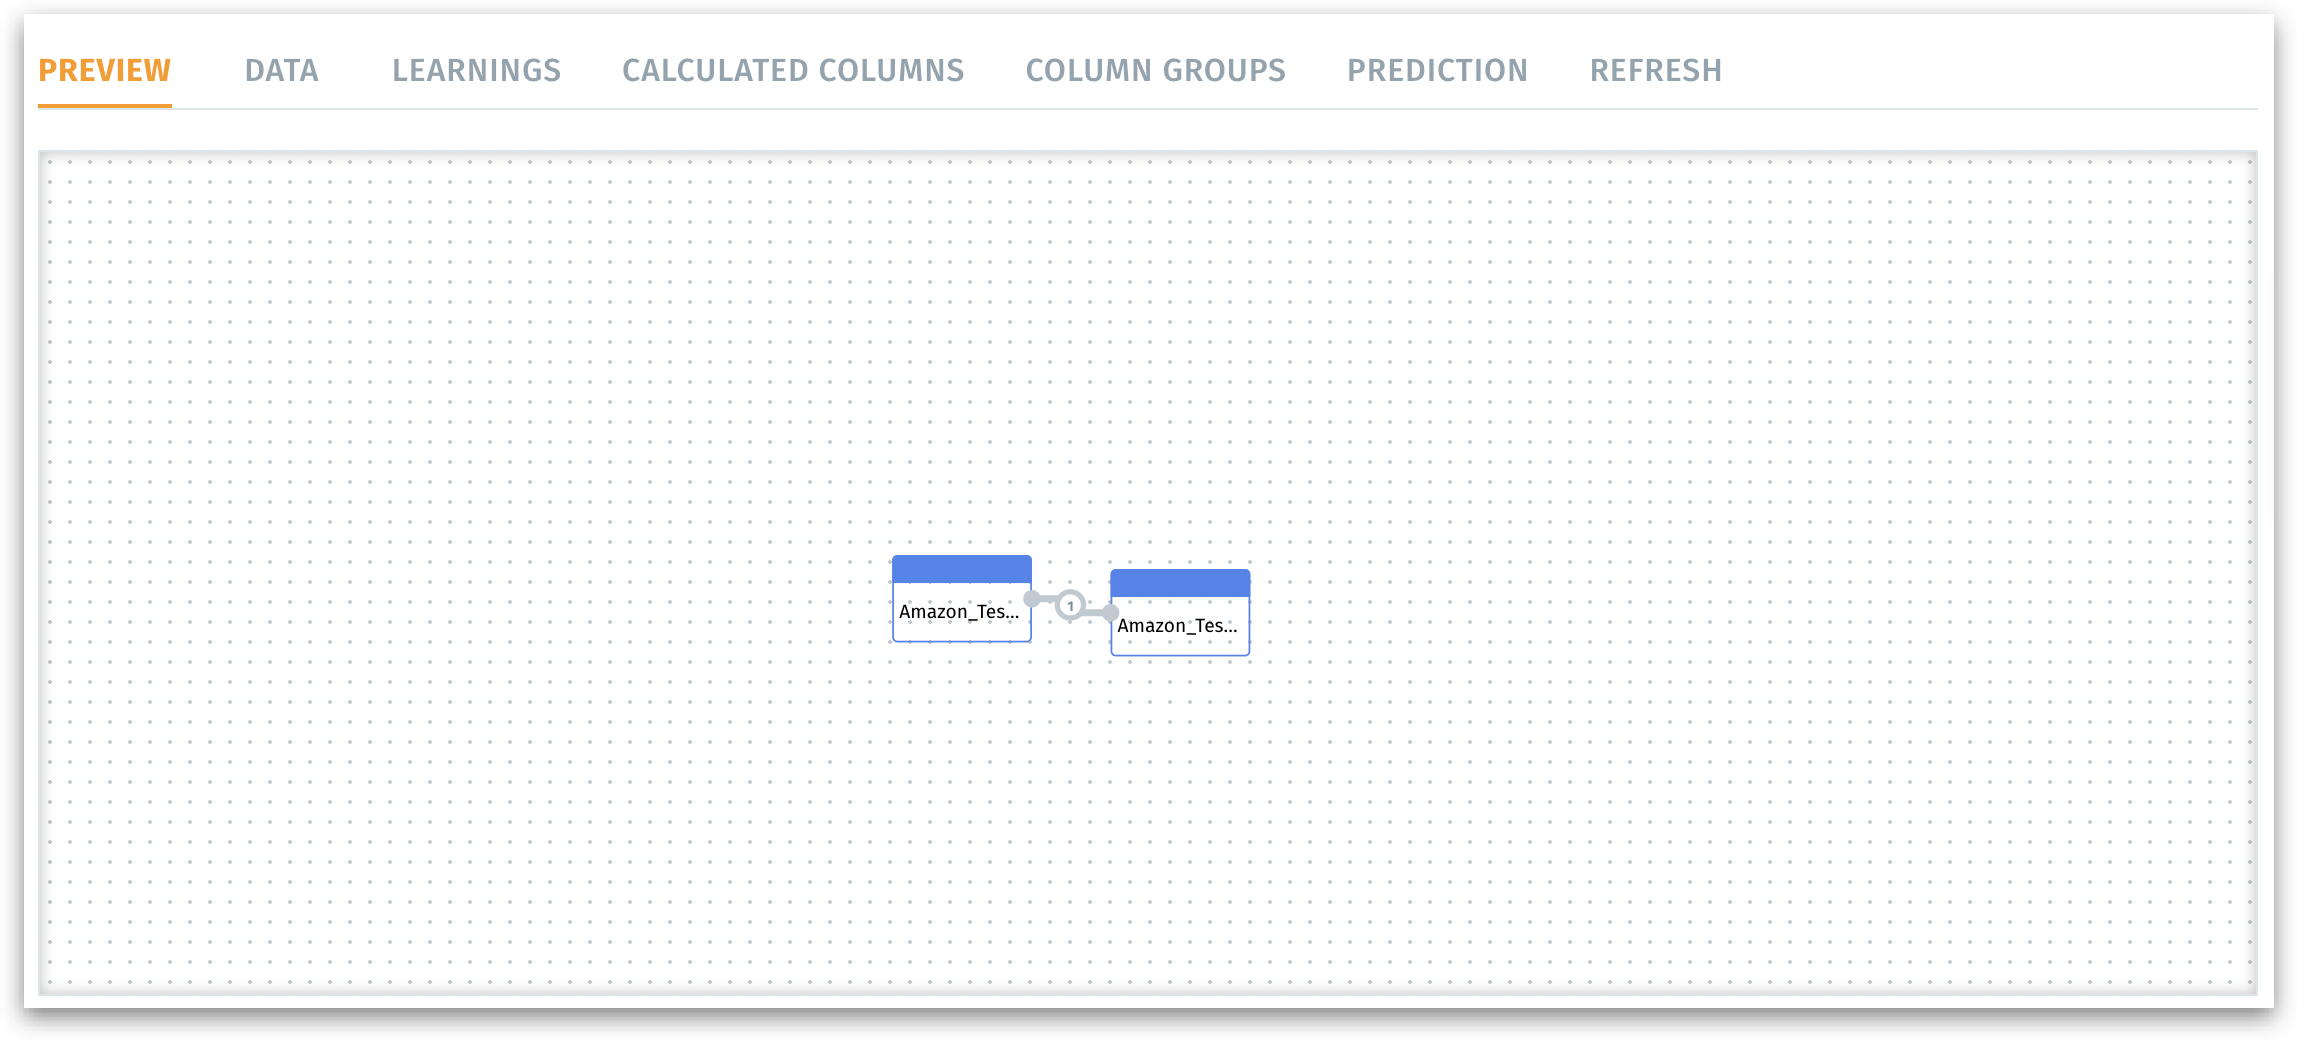
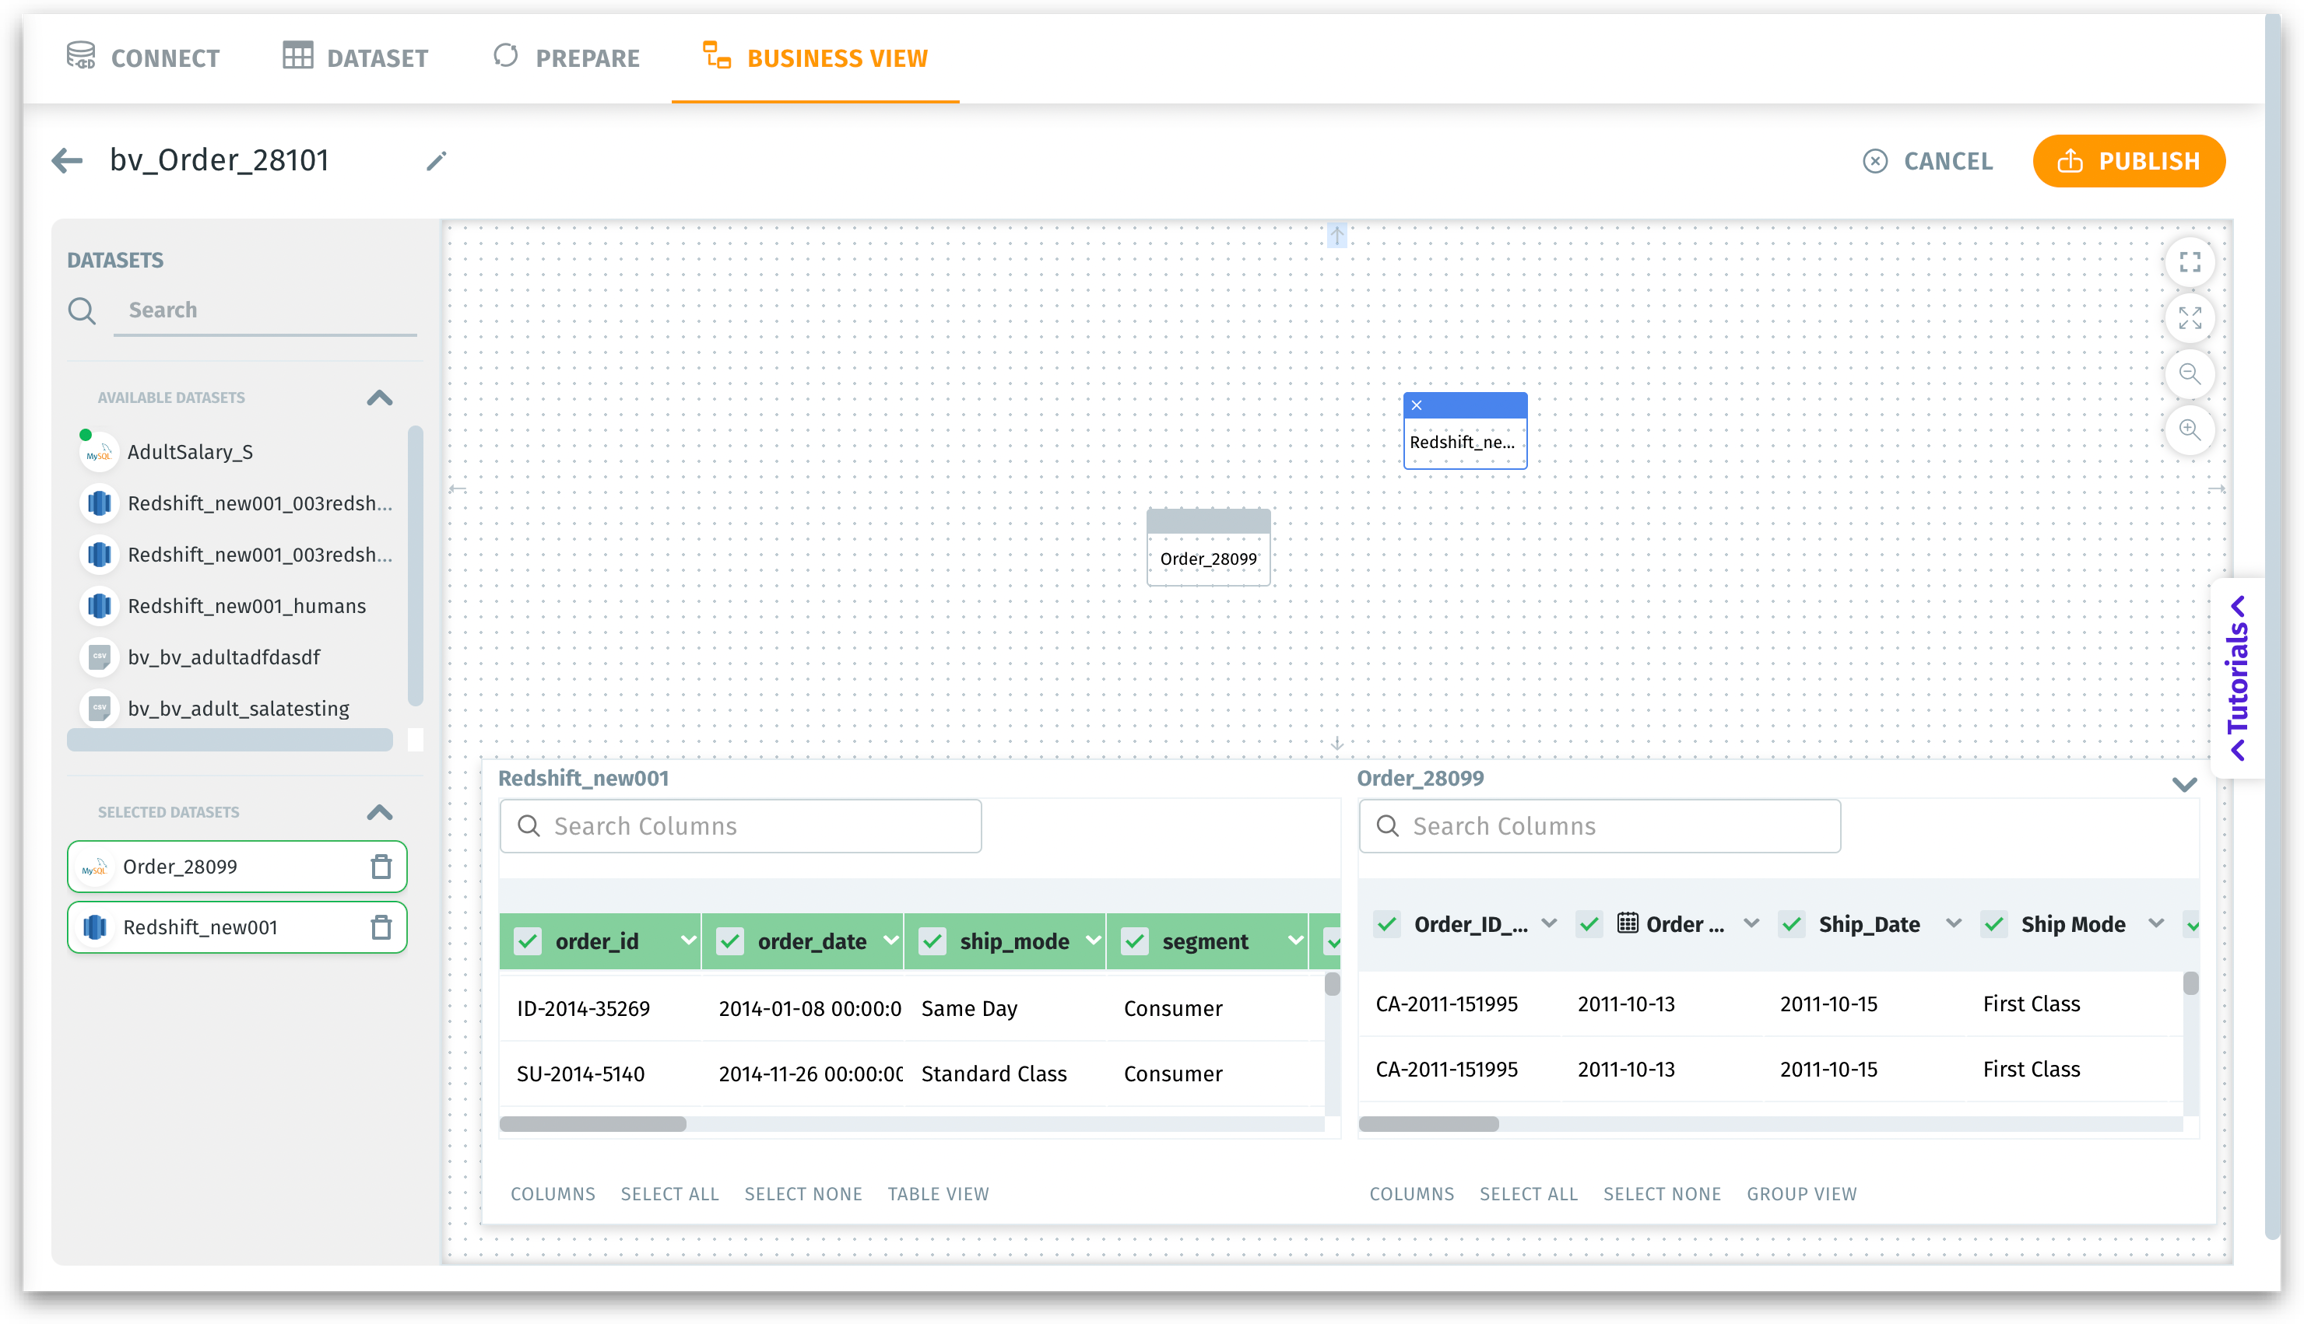
Preview: A visual overview of the datasets included in this Business View. Each dataset is typically shown as a node on a canvas, especially if you have more than one dataset. You can see how datasets are joined or related (if there are multiple datasets). This helps you confirm you’re working with the right underlying data source(s) before you configure additional settings.
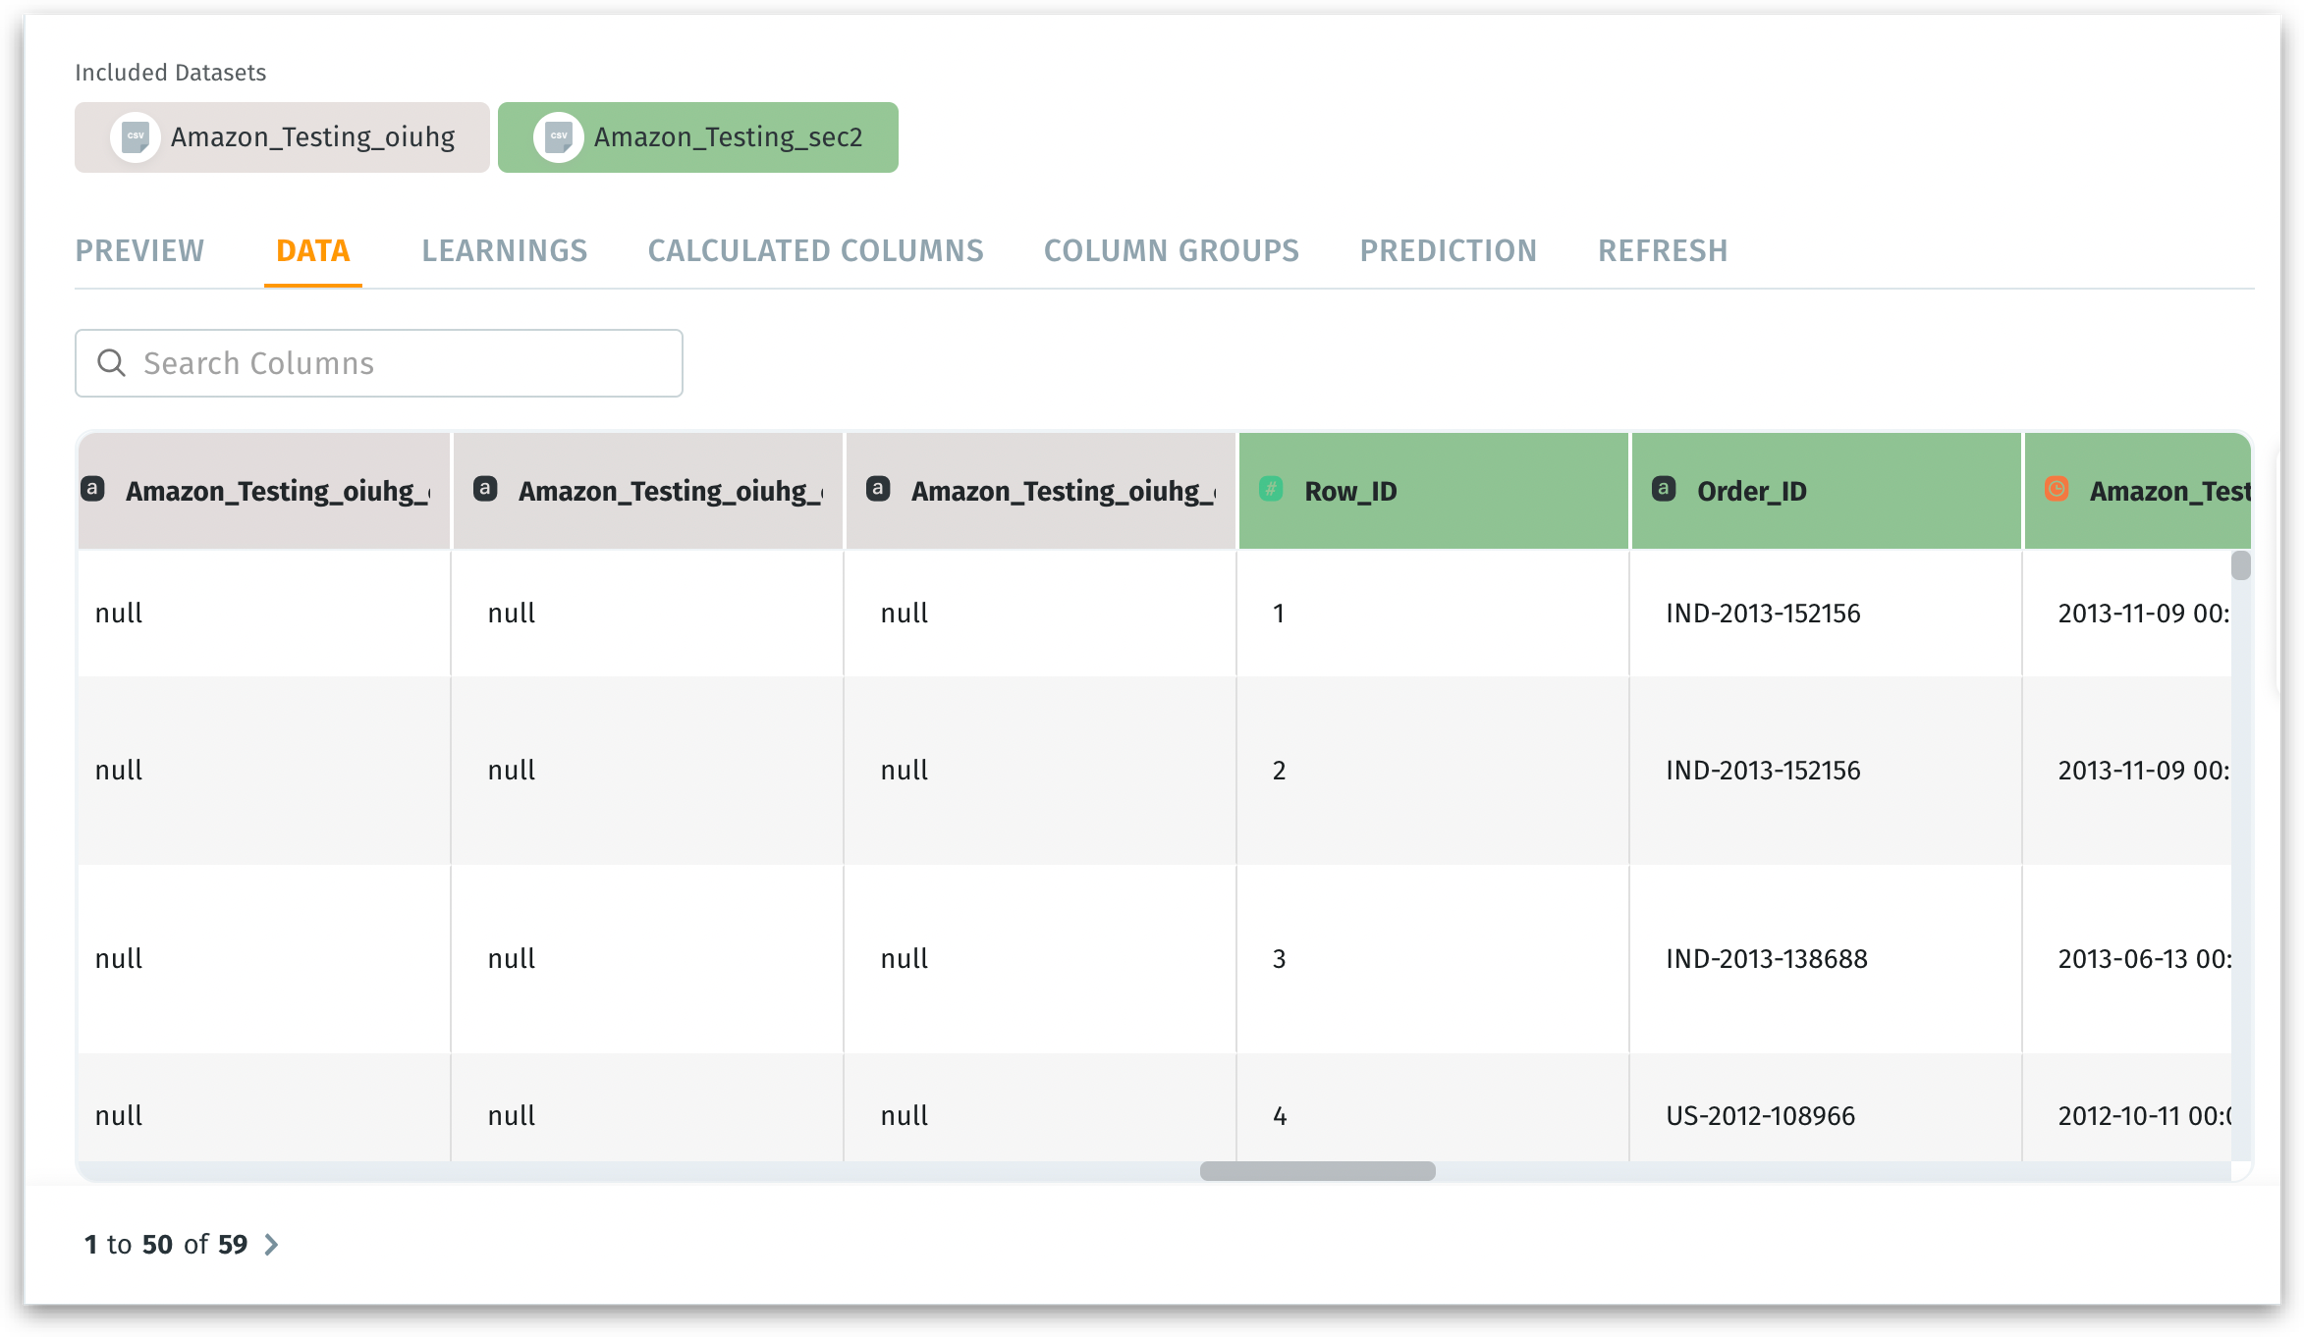
Data: A tabular view of all columns in the included dataset(s). Shows values for each column, along with the column name, display name, data type, etc. You can search columns by name to locate specific fields quickly.
This allows you to inspect the raw data behind your BV, confirm each column’s structure and values (e.g., date formats, categories, numeric ranges) and ensure data quality. Check for any formatting issues, trailing spaces, or inconsistent data entries, and rectify them (only possible in Edit mode).
The color of each column header in the data table corresponds to the color of its associated dataset listed in the "Included Datasets" section. In the image given below, you can see that the color of the column header "Row_ID" is the same as its associated dataset "Amazon_Testing_sec2".
Learnings: The Learnings tab is a centralized repository that contains all the learnings generated or created under the Search tab. Whenever you "teach" Tellius (Help Tellius Learn) or Kaiya by defining specific rules and providing feedback during your search activities, the resulting Learnings are automatically saved and organized in this tab.
Users can review, update, or delete Learnings to ensure they remain relevant and accurate.
Calculated Columns: A configuration interface where you can create custom columns using formulas (e.g., max(Discount), Revenue - Cost, etc.). This reduces the need for repeated manual calculations and lets you extend your raw dataset with business-specific metrics without altering the underlying source data (e.g., computing profit, margin, or custom flags).
For more details on calculated columns, check out this page.
Column Groups: Allows you to organize related columns under a single named group. For example, you might put City, State, Postal Code into a “Geography” group. Click on Create New Group and the following window will be displayed.
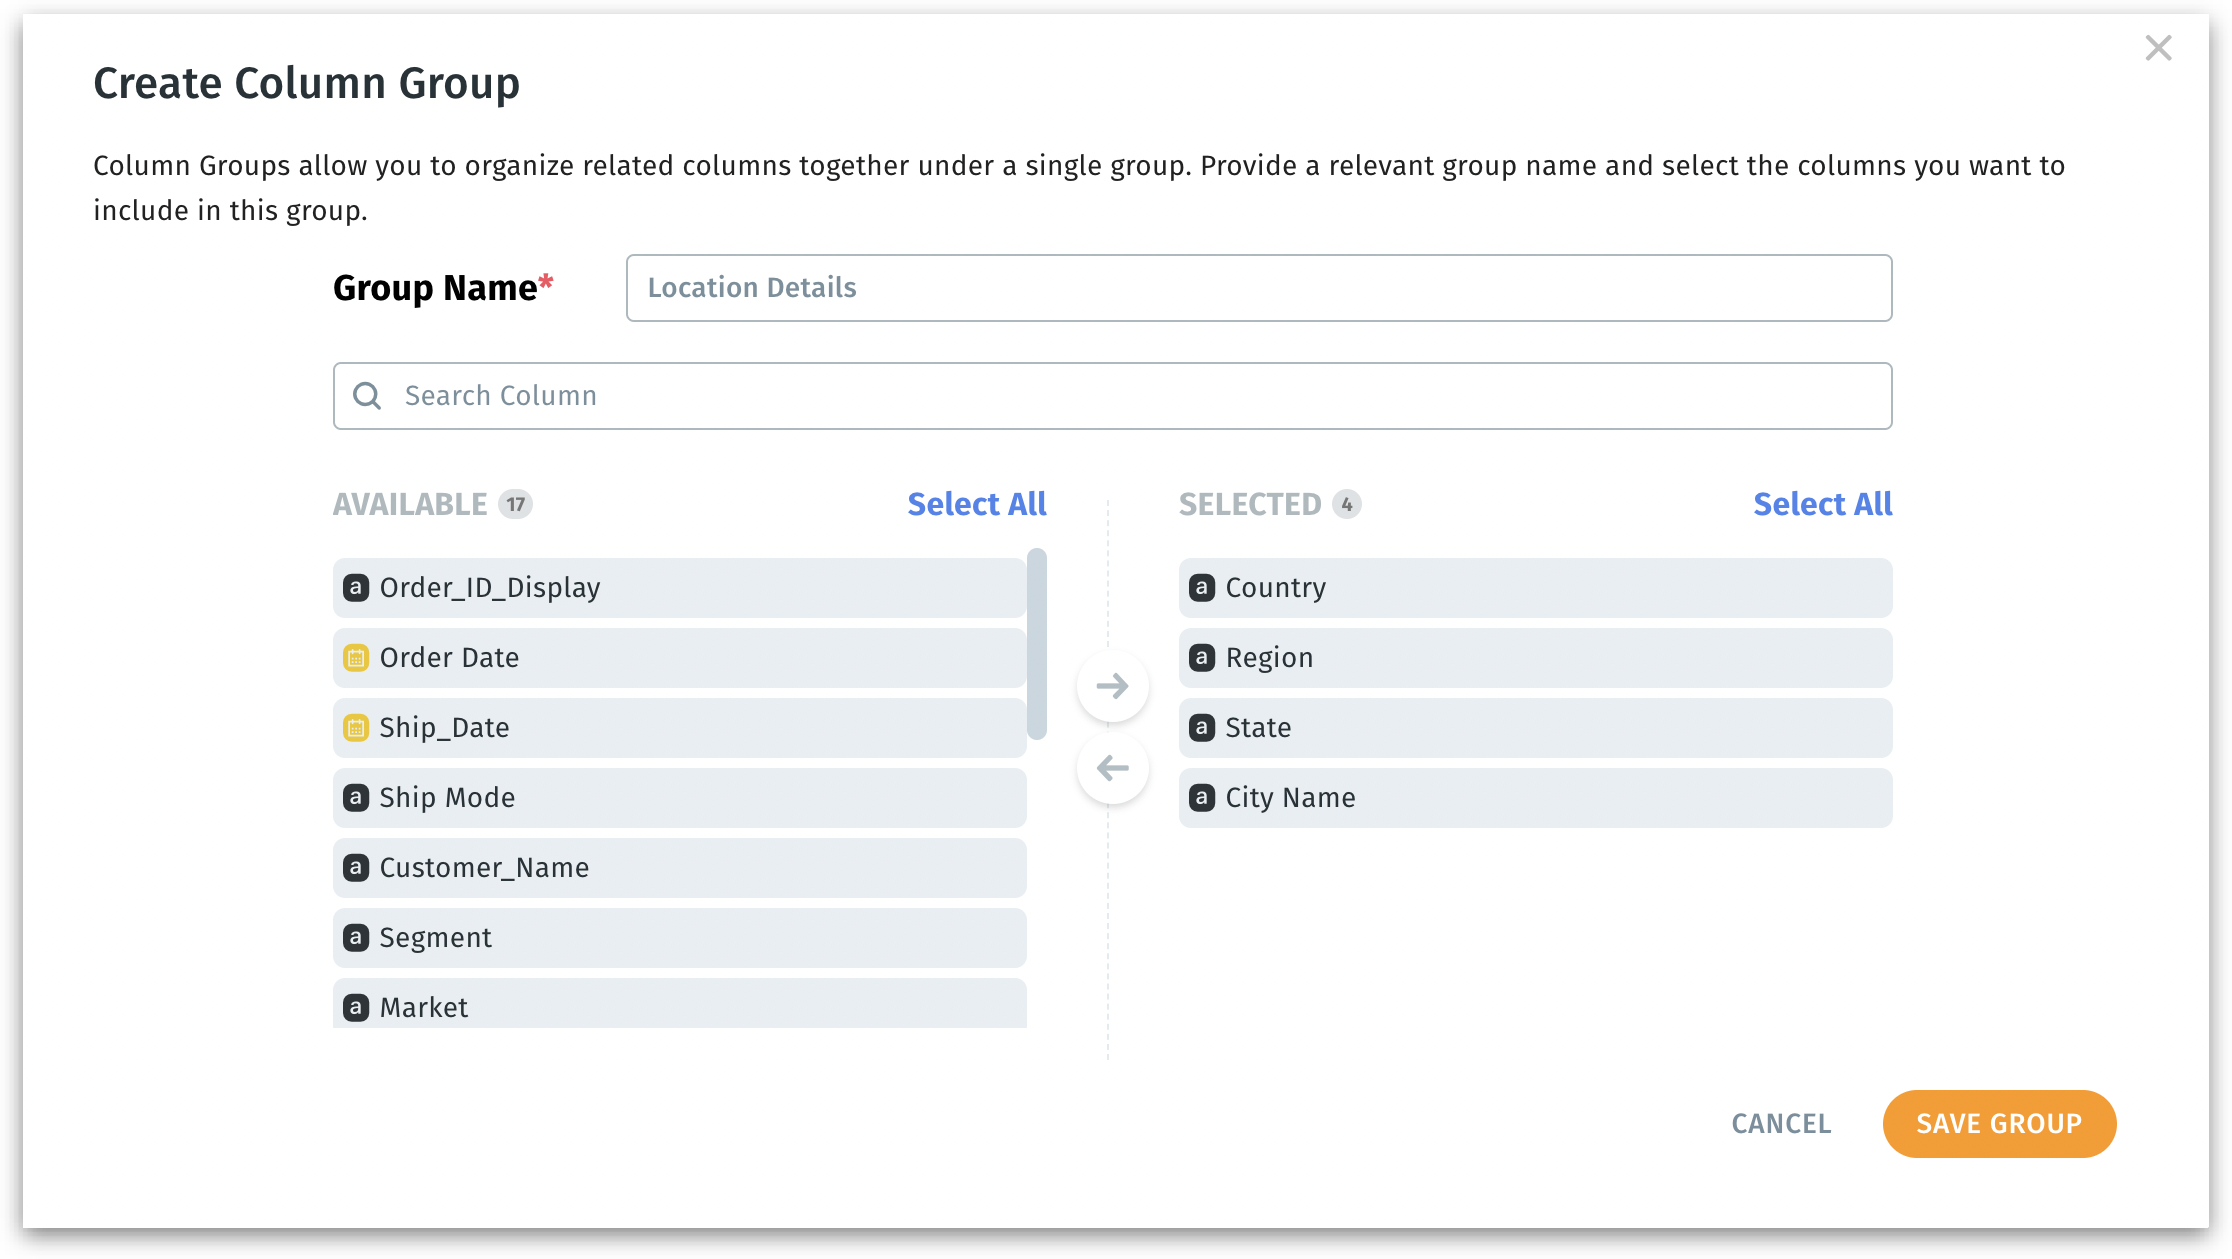
Provide a relevant name for the group.
Select columns from an “Available” list and move them to the “Selected” section to form the new group.
This improves discoverability and reduces clutter for large datasets. It assists with semantic layer design—especially beneficial for self-service analytics, where non-technical users want to browse logical groupings rather than raw column lists. Ideal if you group columns that are commonly used together (e.g., shipping details, location details).
Prediction:
When you have ML models applied to the dataset(s) within a BV, this tab displays the newly generated prediction columns, the target column used for modeling, and details about the prediction model itself.
Quickly see which model is active, what columns it generated, and whether you need to refresh or re-train. Business teams can interpret model results alongside other columns in the BV (like sales data or user demographics).
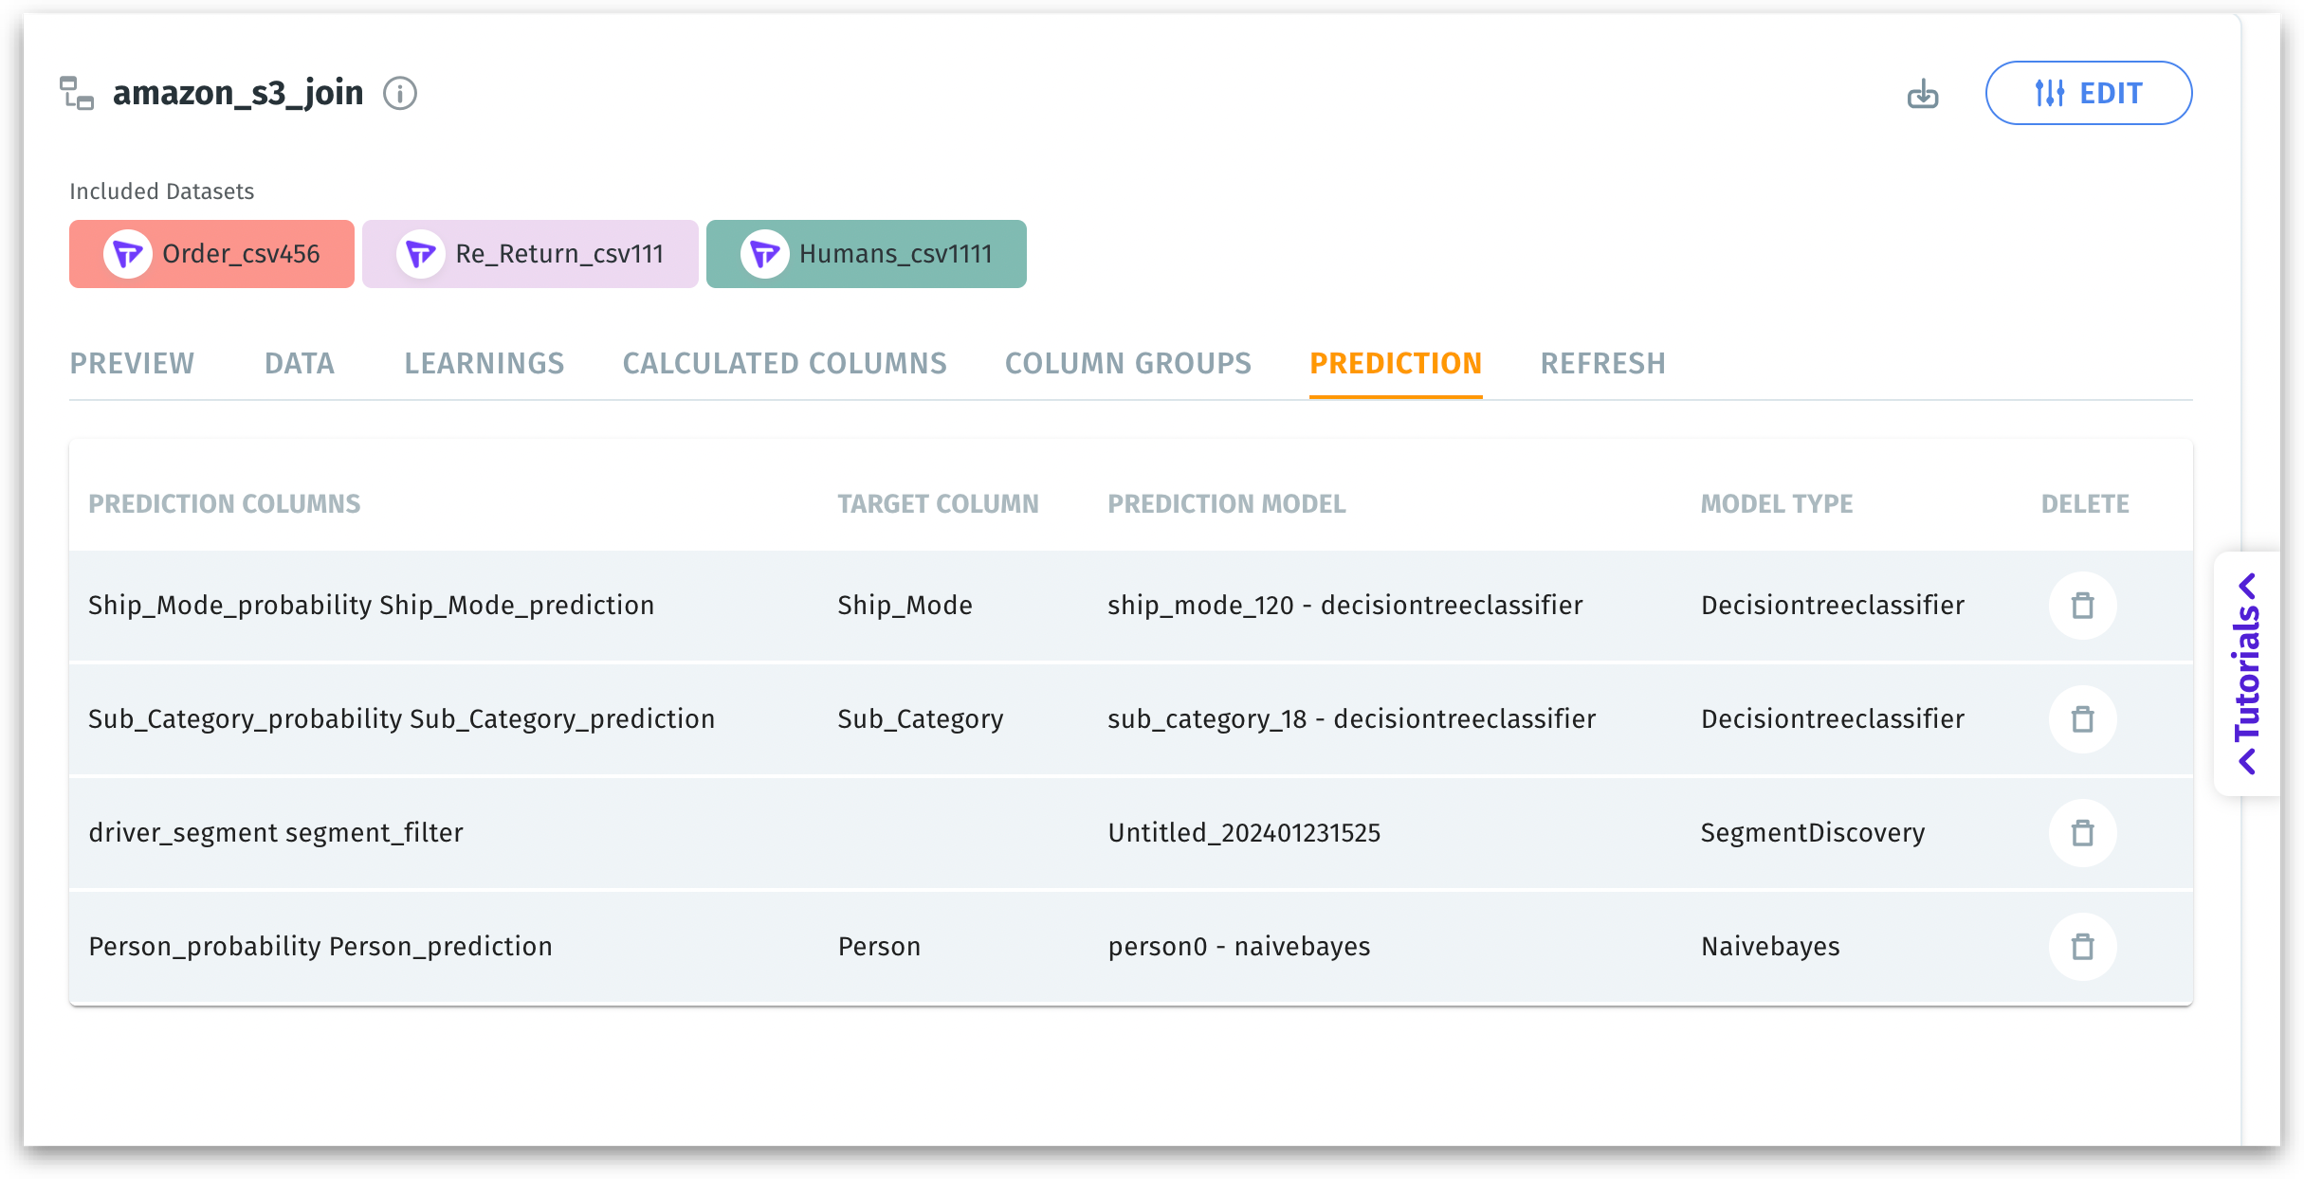
Prediction column: Prediction columns are new fields appended to your BV as a result of running an ML model in Tellius. These may represent predicted outcomes (regression or classification) or residuals (the difference between predicted and actual values).
They embed the model’s output directly in your BV, so you can visualize or further analyze these predictions without exporting to another tool.
Target column: The column in the dataset that the ML model was trained to predict (e.g., churn risk, sales amount, or adoption likelihood). This clarifies which variable the model was attempting to forecast or classify.
Prediction model & Model type: The identifier of the ML model and its type (e.g., RandomForestRegressor, LogisticRegression). Tells you how the predictions were generated (which algorithm, e.g., regression vs. classification).
Refresh: A refresh schedule or synchronization setting for the BV. You’ll see the included dataset(s), the next scheduled refresh time, and whether the BV should auto-refresh with its underlying dataset.
Download CSV: Click on this button to download the Business View in CSV format.
Edit: Clicking the Edit button in a Business View opens the editing interface, allowing you to modify and enhance your BV. You can update existing columns, add or remove datasets, and make other adjustments to align the BV with your analytical needs.
Was this helpful?