Release 5.4
Tellius 5.4 is here—packed with powerful new features where you can put AI agents to work, automate analysis, and get you from question to decision faster. From customizable agentic workflows and smarter "Why" analysis to dynamic parameters, fiscal calendars, and universal search—it's smarter, faster, and designed to turn action into impact. Here's what's new.
Build powerful, automated agentic flows that handle repetitive, multi-step analysis—like pinpointing underperforming products, identifying high-value customers, or breaking down territory performance—trigger it all with one question.
Go beyond what happened—ask “why” questions directly and get straight to the real drivers behind sales dips, churn spikes, or campaign impact. Get clear, contextual answers, not just charts.
Instantly find any chart, model, conversation, or KPI with lightning-fast Ctrl+K search. Pin business-critical metrics to your homepage and track them the moment you log in.
🚀 New features
Welcome to the age of AI agents!
Tellius 5.4 introduces a powerful new way to automate analytics through intelligent, task-driven AI Agents—customizable assistants that analyze data, generate insights, and drive decisions using natural language.We’re launching four key capabilities to help teams build, scale, and operationalize AI-driven analytics:
Agents: Our AI agents are native pre-built agents that execute specific analytical tasks—such as Validation, Planner, Data Prep, Visualization, Insights, and Summary—designed to handle the core steps of the analysis journey.
Composer: A no-code studio where you can create and configure AI Agents. Simply describe what the agent should do, connect to your data, and define the steps—all without writing a single line of code.
Agent Library: Your enterprise-wide repository of reusable agents for different use cases. The library makes it easy to share, manage, and deploy agents across teams and workflows.
Agentic Flows: Combine multiple agents to execute complex, multi-step analytical workflows. Agentic Flows streamline everything from data preparation to insight generation—automating your path from question to action.
Once published, agents can be triggered directly through the Kaiya conversational interface. Ask a goal-driven question, and Kaiya routes it to the right agent (or agentic flow), confirms key parameters, and delivers results—so you can stay focused while insights work in the background.This release transforms how analytics teams operate: reducing manual work, scaling insight generation, and turning everyday questions into intelligent, automated outcomes.
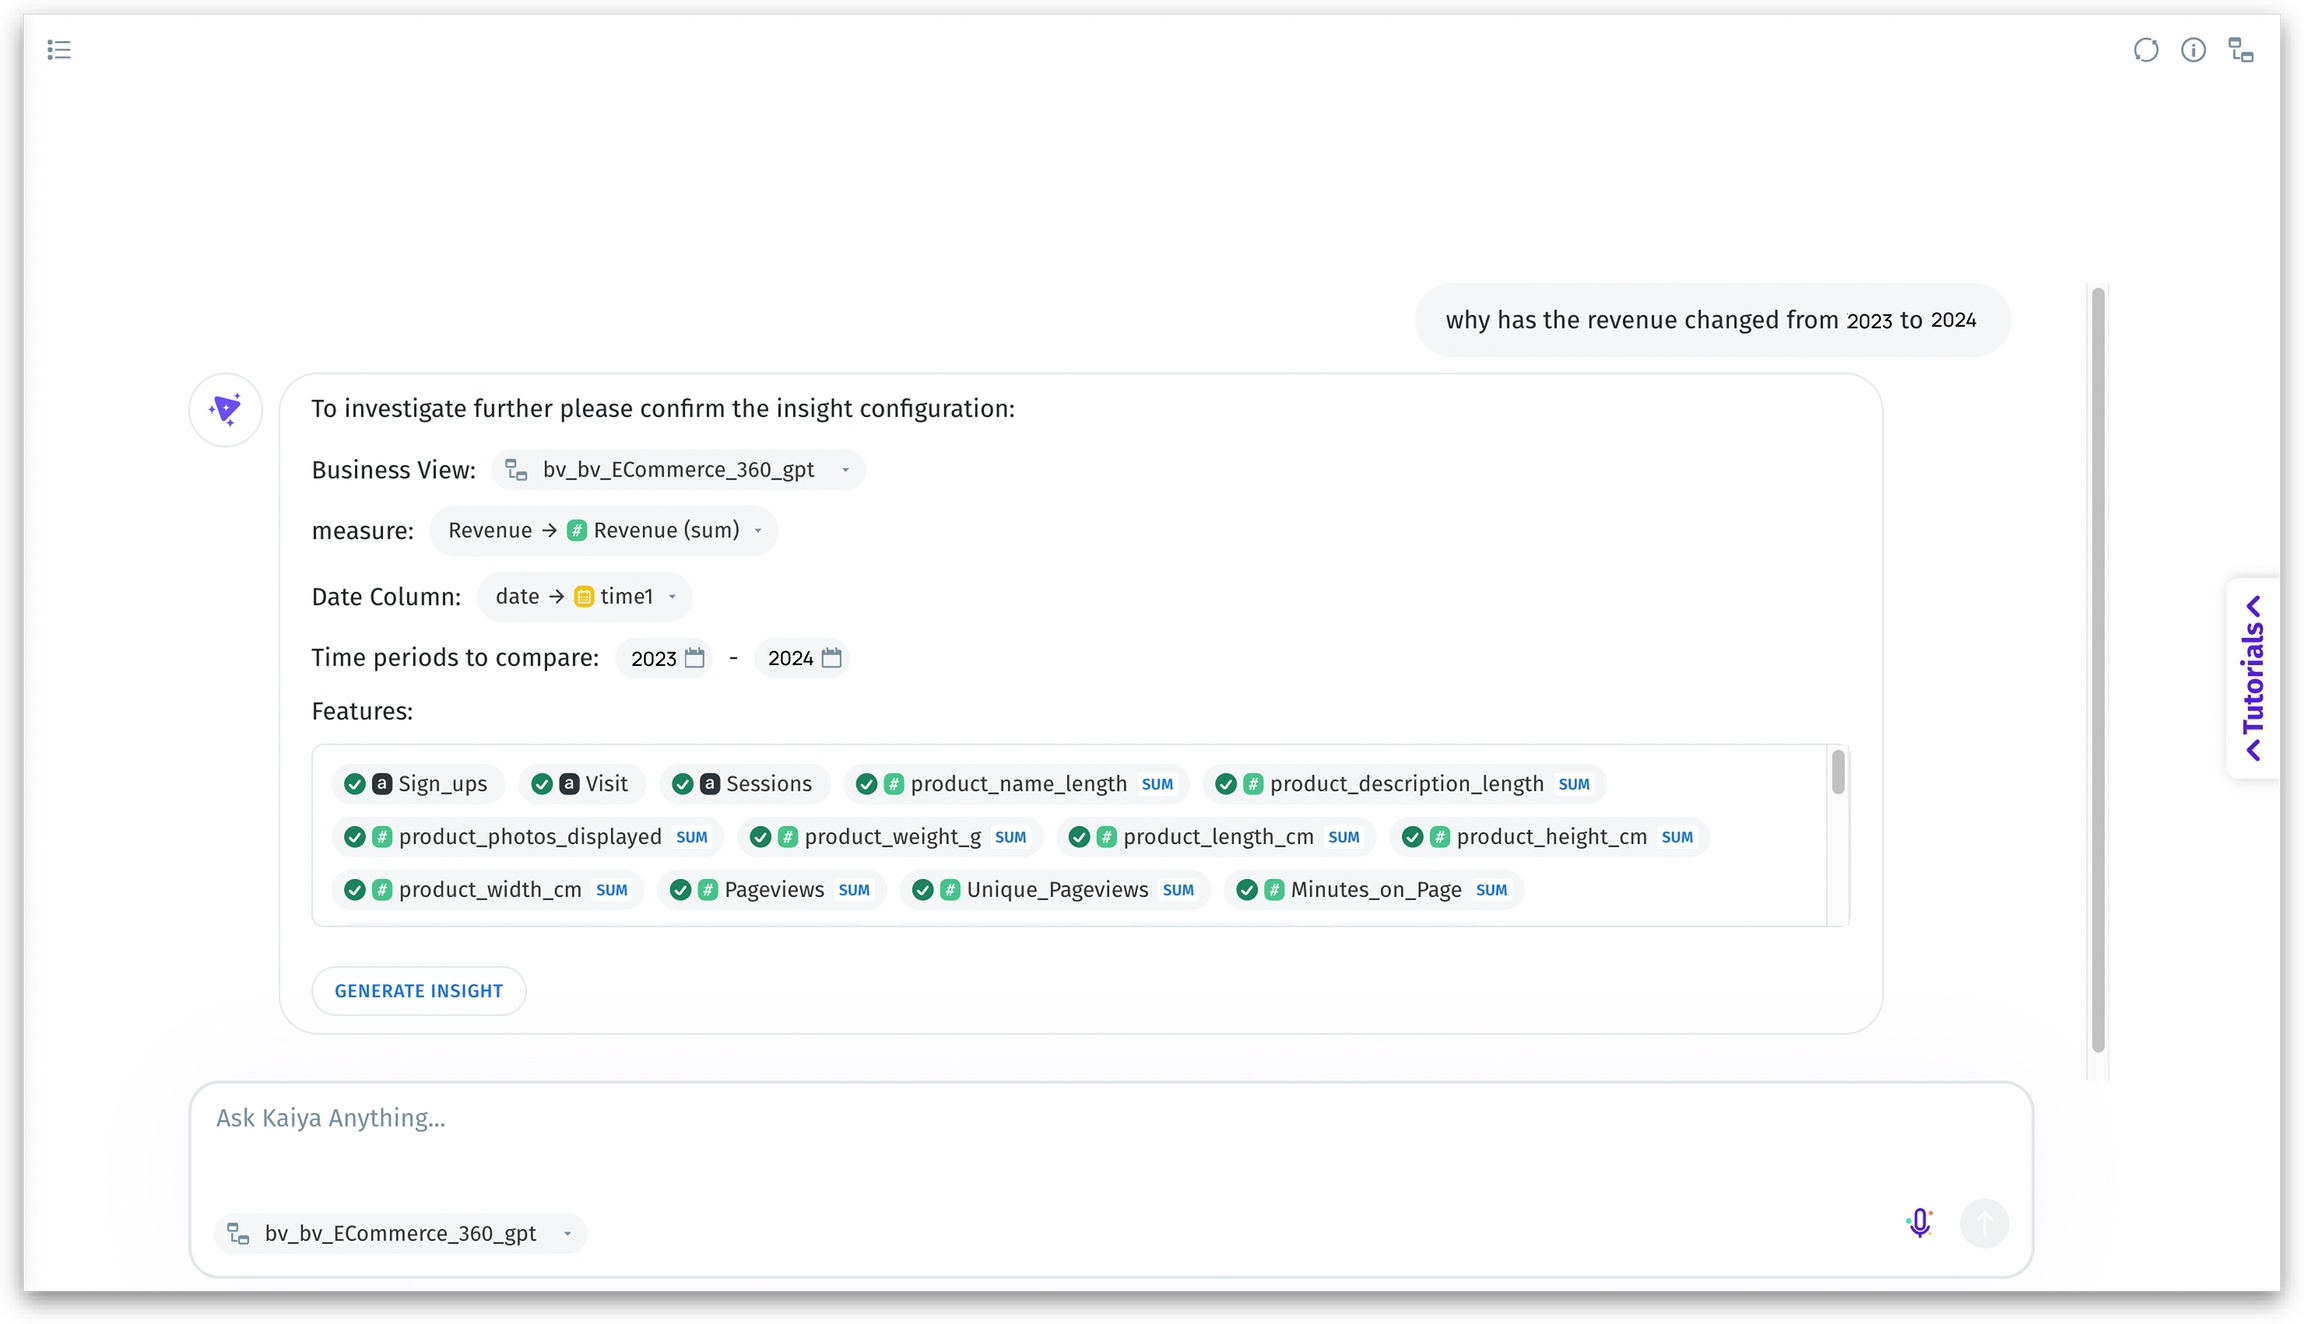
Ask Kaiya “Why” and it will be answered
Tellius 5.4 takes Kaiya's conversational analytics to the next level by enabling intent-driven insights generation. Users can now ask deeper, "why" questions—like "Why did sales drop last quarter?"—and Kaiya will intelligently detect the intent, identify whether the user seeks trends, segments, or comparisons, and proceed to generate detailed, actionable insights. Kaiya confirms the analysis path, remembers the context from previous queries, and ensures that insights align with user expectations. This makes the experience more conversational and dynamic, reducing the need for multiple back-and-forth clarifications.
While complex insights are being processed in the background, users can continue their conversations or explore other analyses. A dedicated queue panel shows real-time progress, while in-app notifications keep users informed when insights are ready. Users also have the flexibility to cancel or restart Insight generation directly from the queue, ensuring total control over the process.
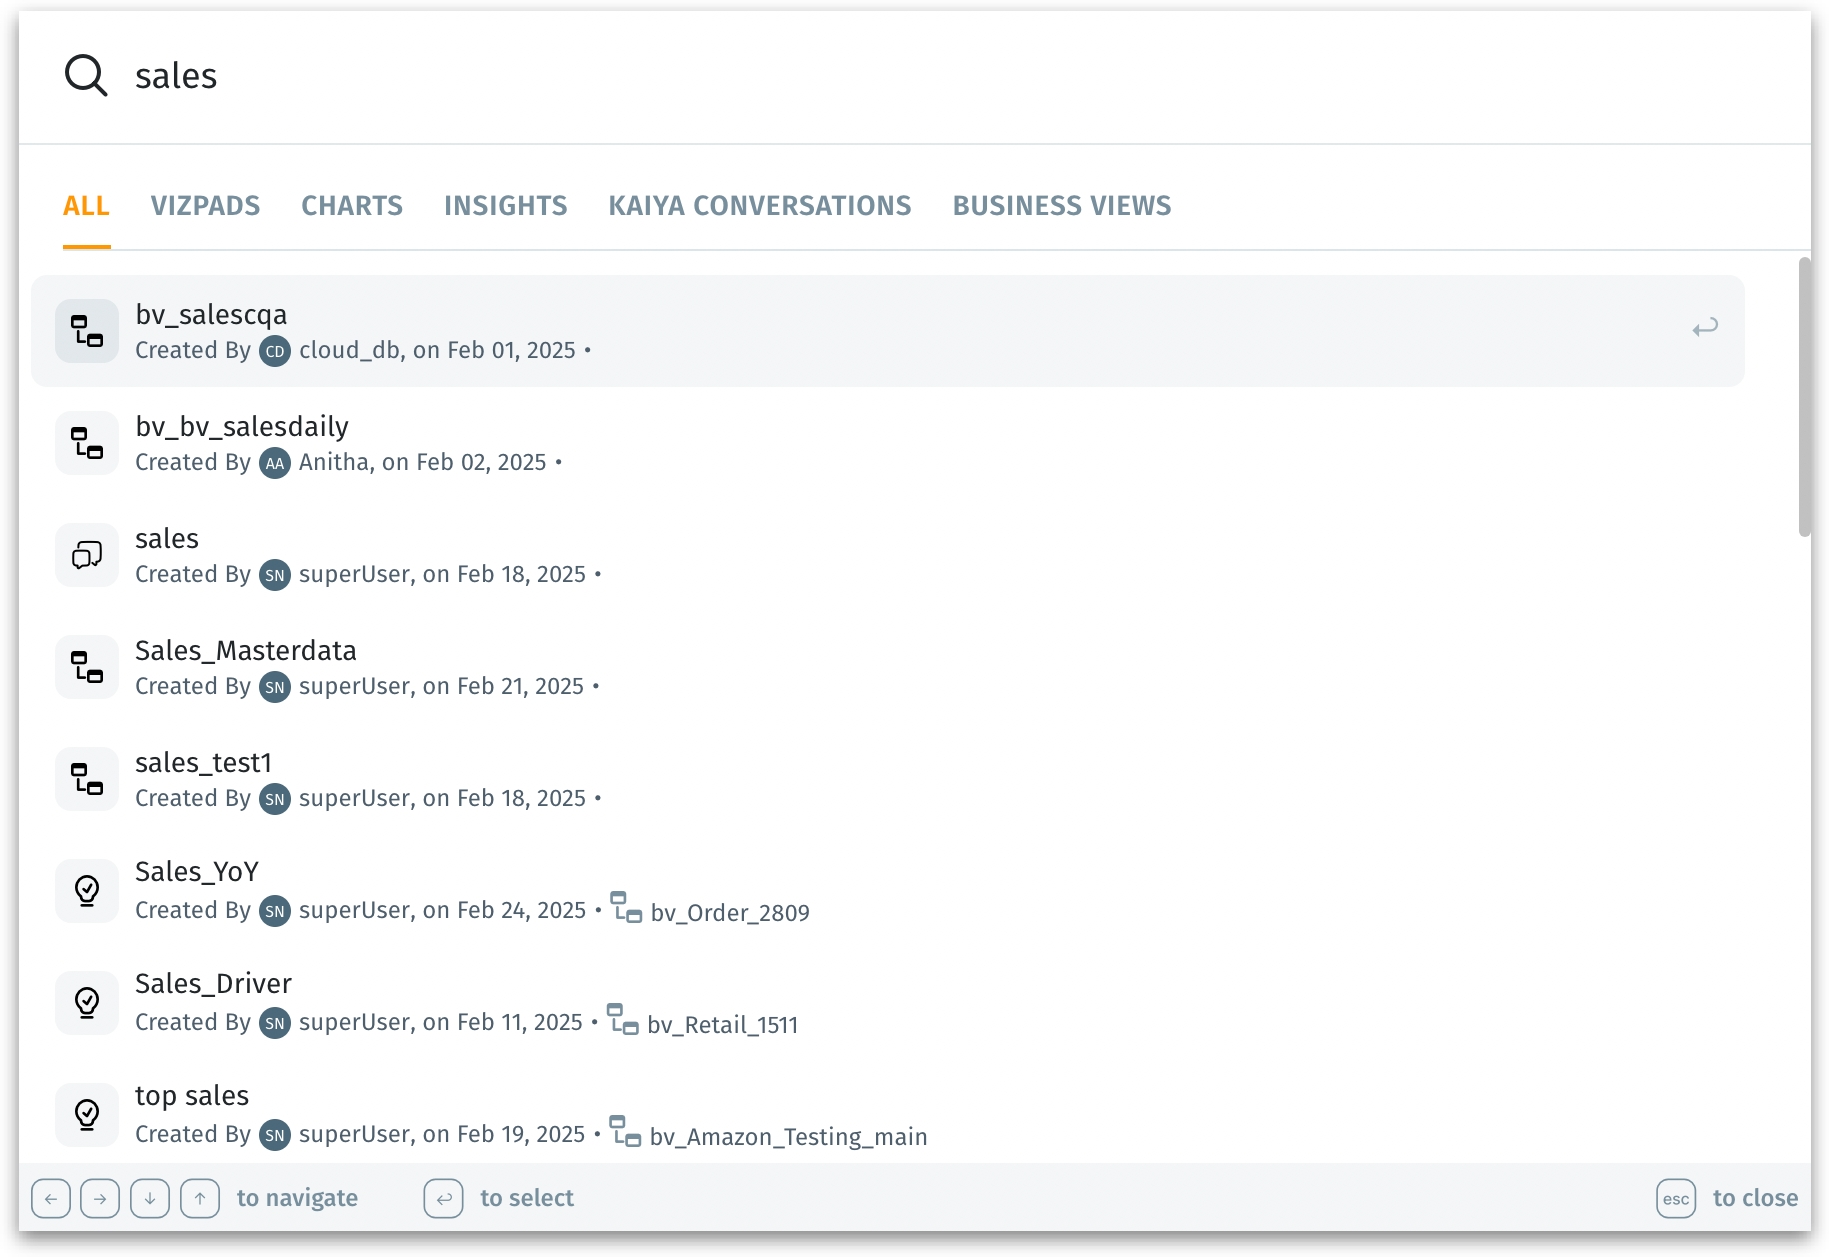
Ctrl+K: Lightning-fast universal search
Tellius 5.4 introduces Universal Search—a powerful, all-encompassing search capability that transforms how users navigate, find, and interact with data. With a single search bar—accessible via the shortcut Ctrl + K (or Command + K)—users can now search for any artifact, including conversations, Vizpads, Business Views, Insights, and Models, all from one place. This eliminates the need to navigate through multiple modules or menus, drastically reducing the time spent hunting for resources and improving overall productivity.
The search results are neatly categorized by artifact type, making it easy to differentiate between Vizpads, Models, or Insights.
Don’t know the exact name? No problem. Tellius handles typos, approximate matches and delivers closest results.
Security and access control are seamlessly integrated, ensuring users only see the artifacts they have permissions for, safeguarding sensitive data.
With Universal Search, Tellius 5.4 makes it easier to find data—at the speed of thought.
Equipping homepage with your mission-critical data
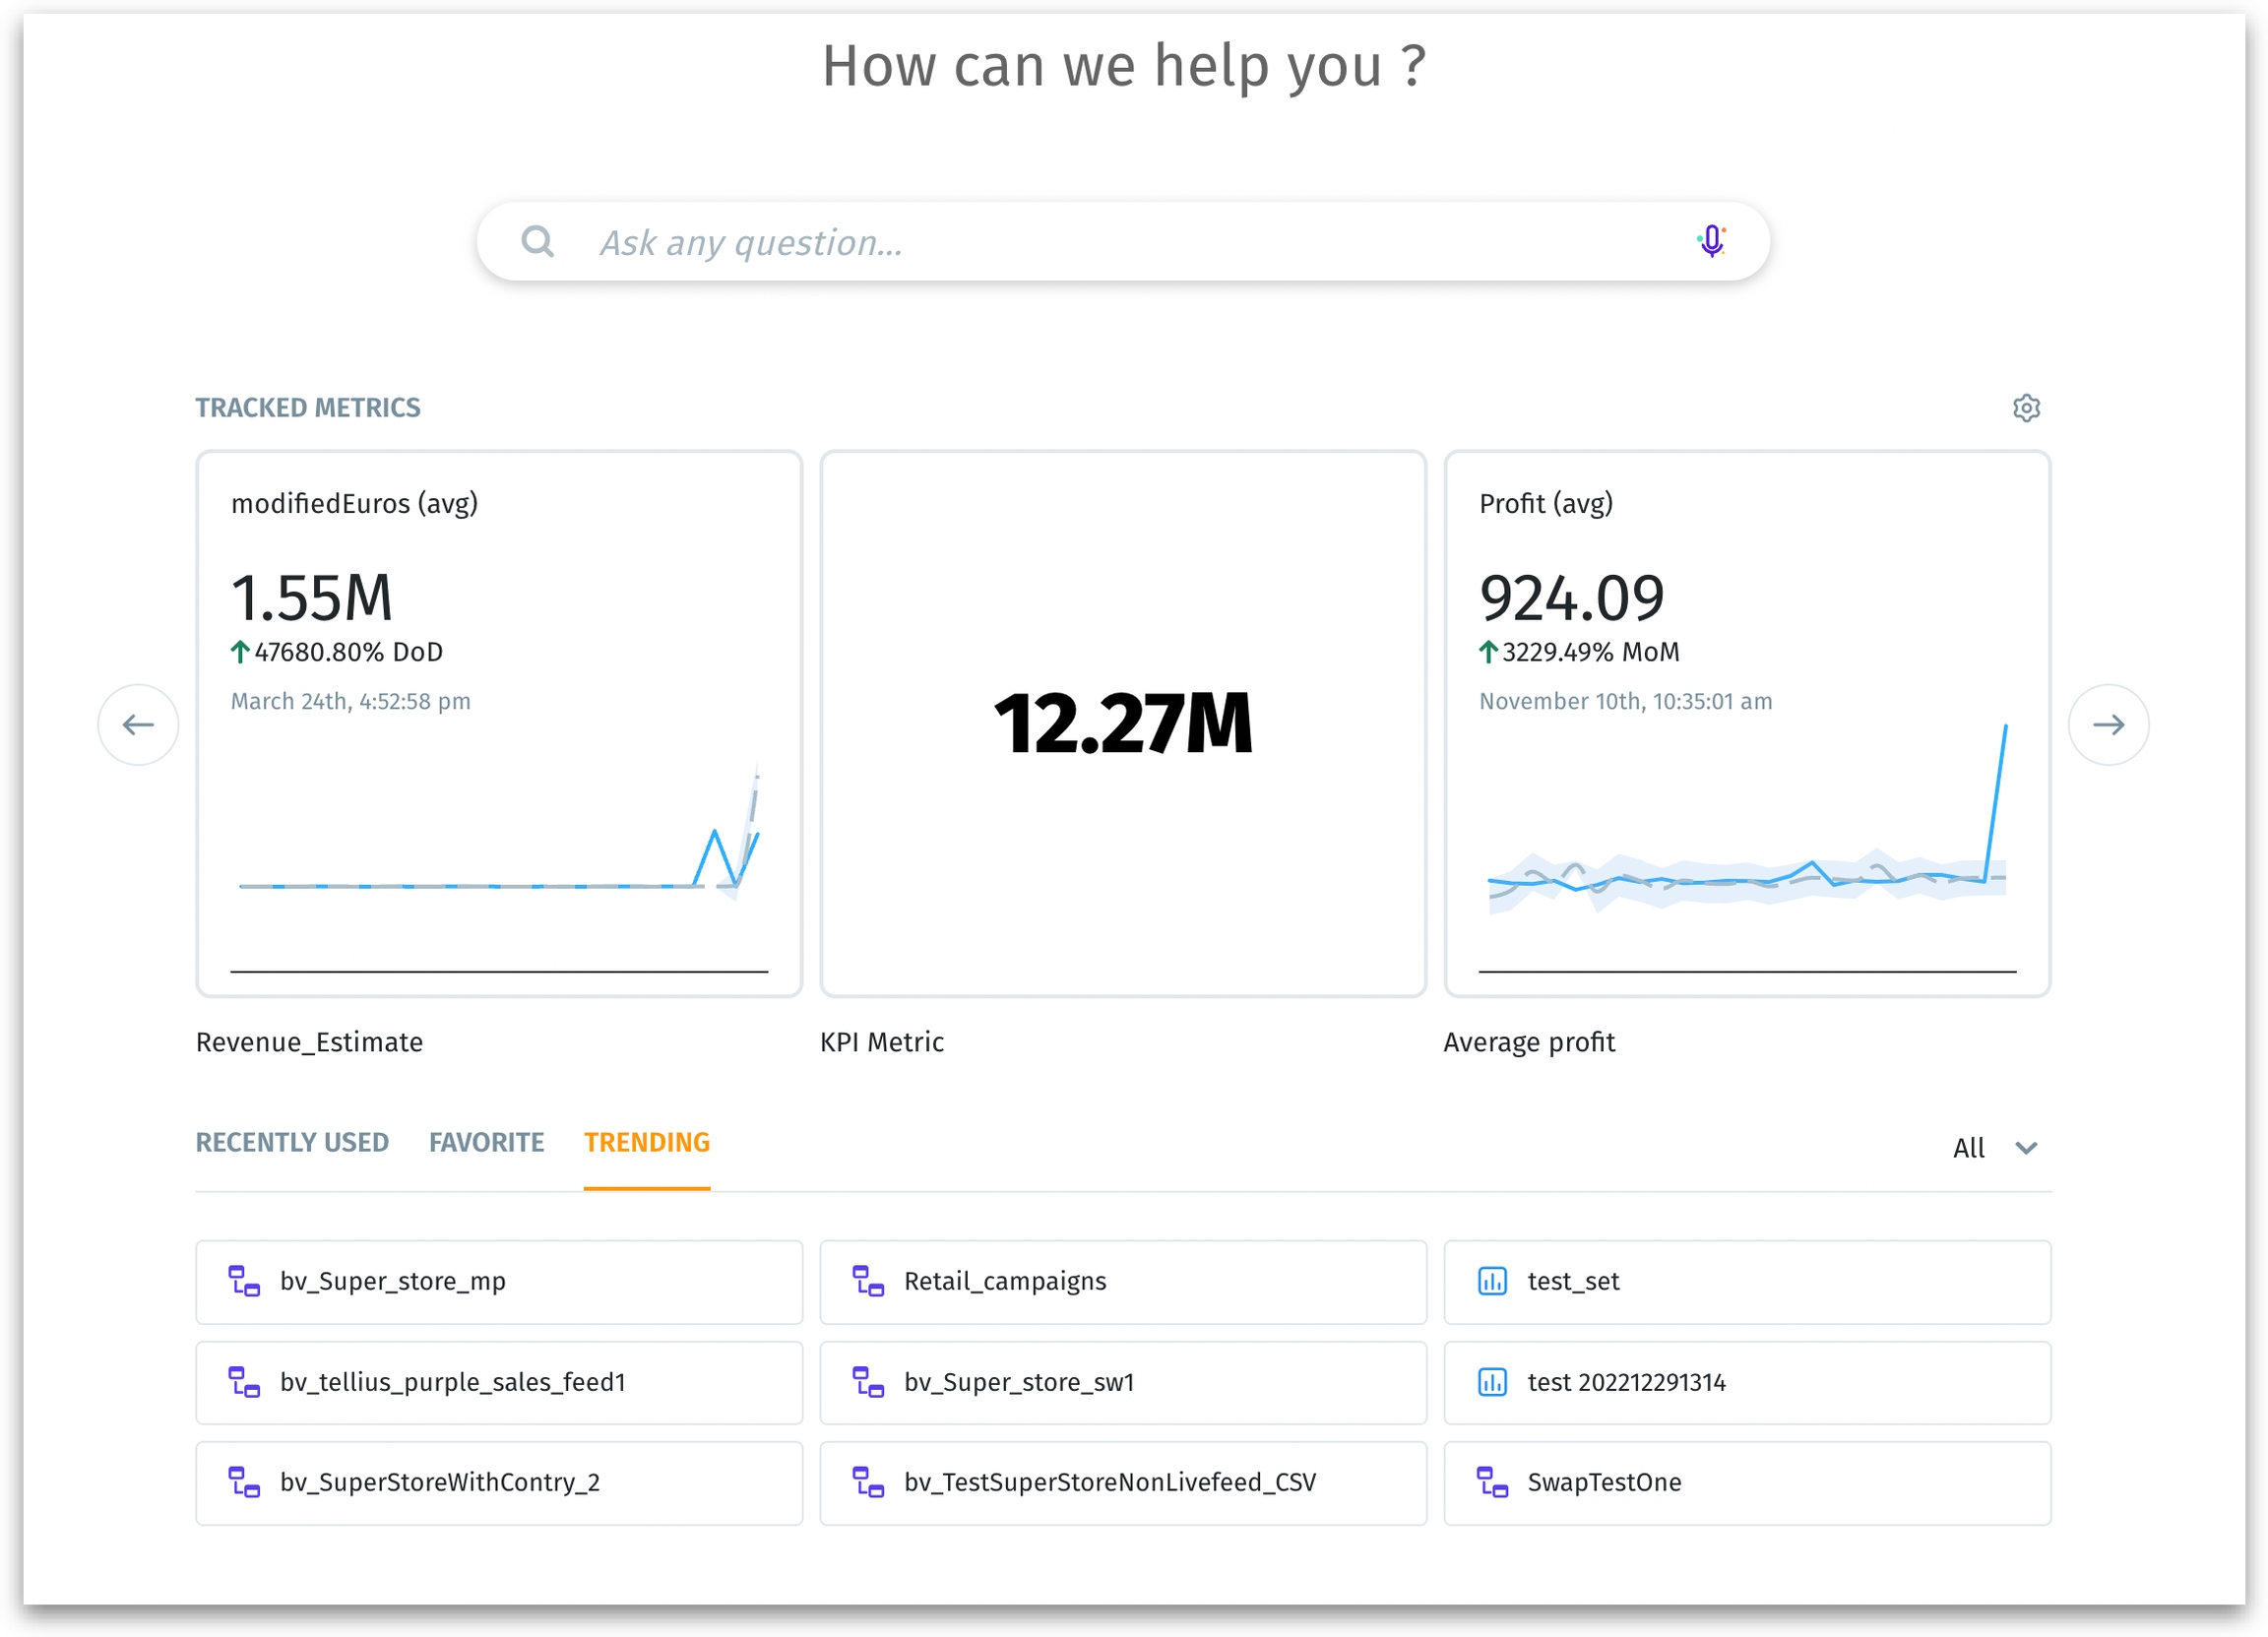
Tellius 5.4 introduces a redesigned home page—a centralized interface that enables users to quickly access their most critical resources and track essential KPIs.
You can now pin important KPI charts from Vizpads and metrics from Feeds directly to the home page for real-time tracking. This eliminates the need to search through multiple modules, providing instant visibility into business-critical data. You can also rename and reorder pinned metrics for a more personalized experience.
The page is designed to make navigation effortless. Jump between three key sections:
Favorites for quick access to pinned and prioritized resources.
Recently Used to pick up where you left off.
Trending to discover what’s popular across your organization.
The new home page reduces time spent searching, and ensures users stay focused on the insights that matter most.
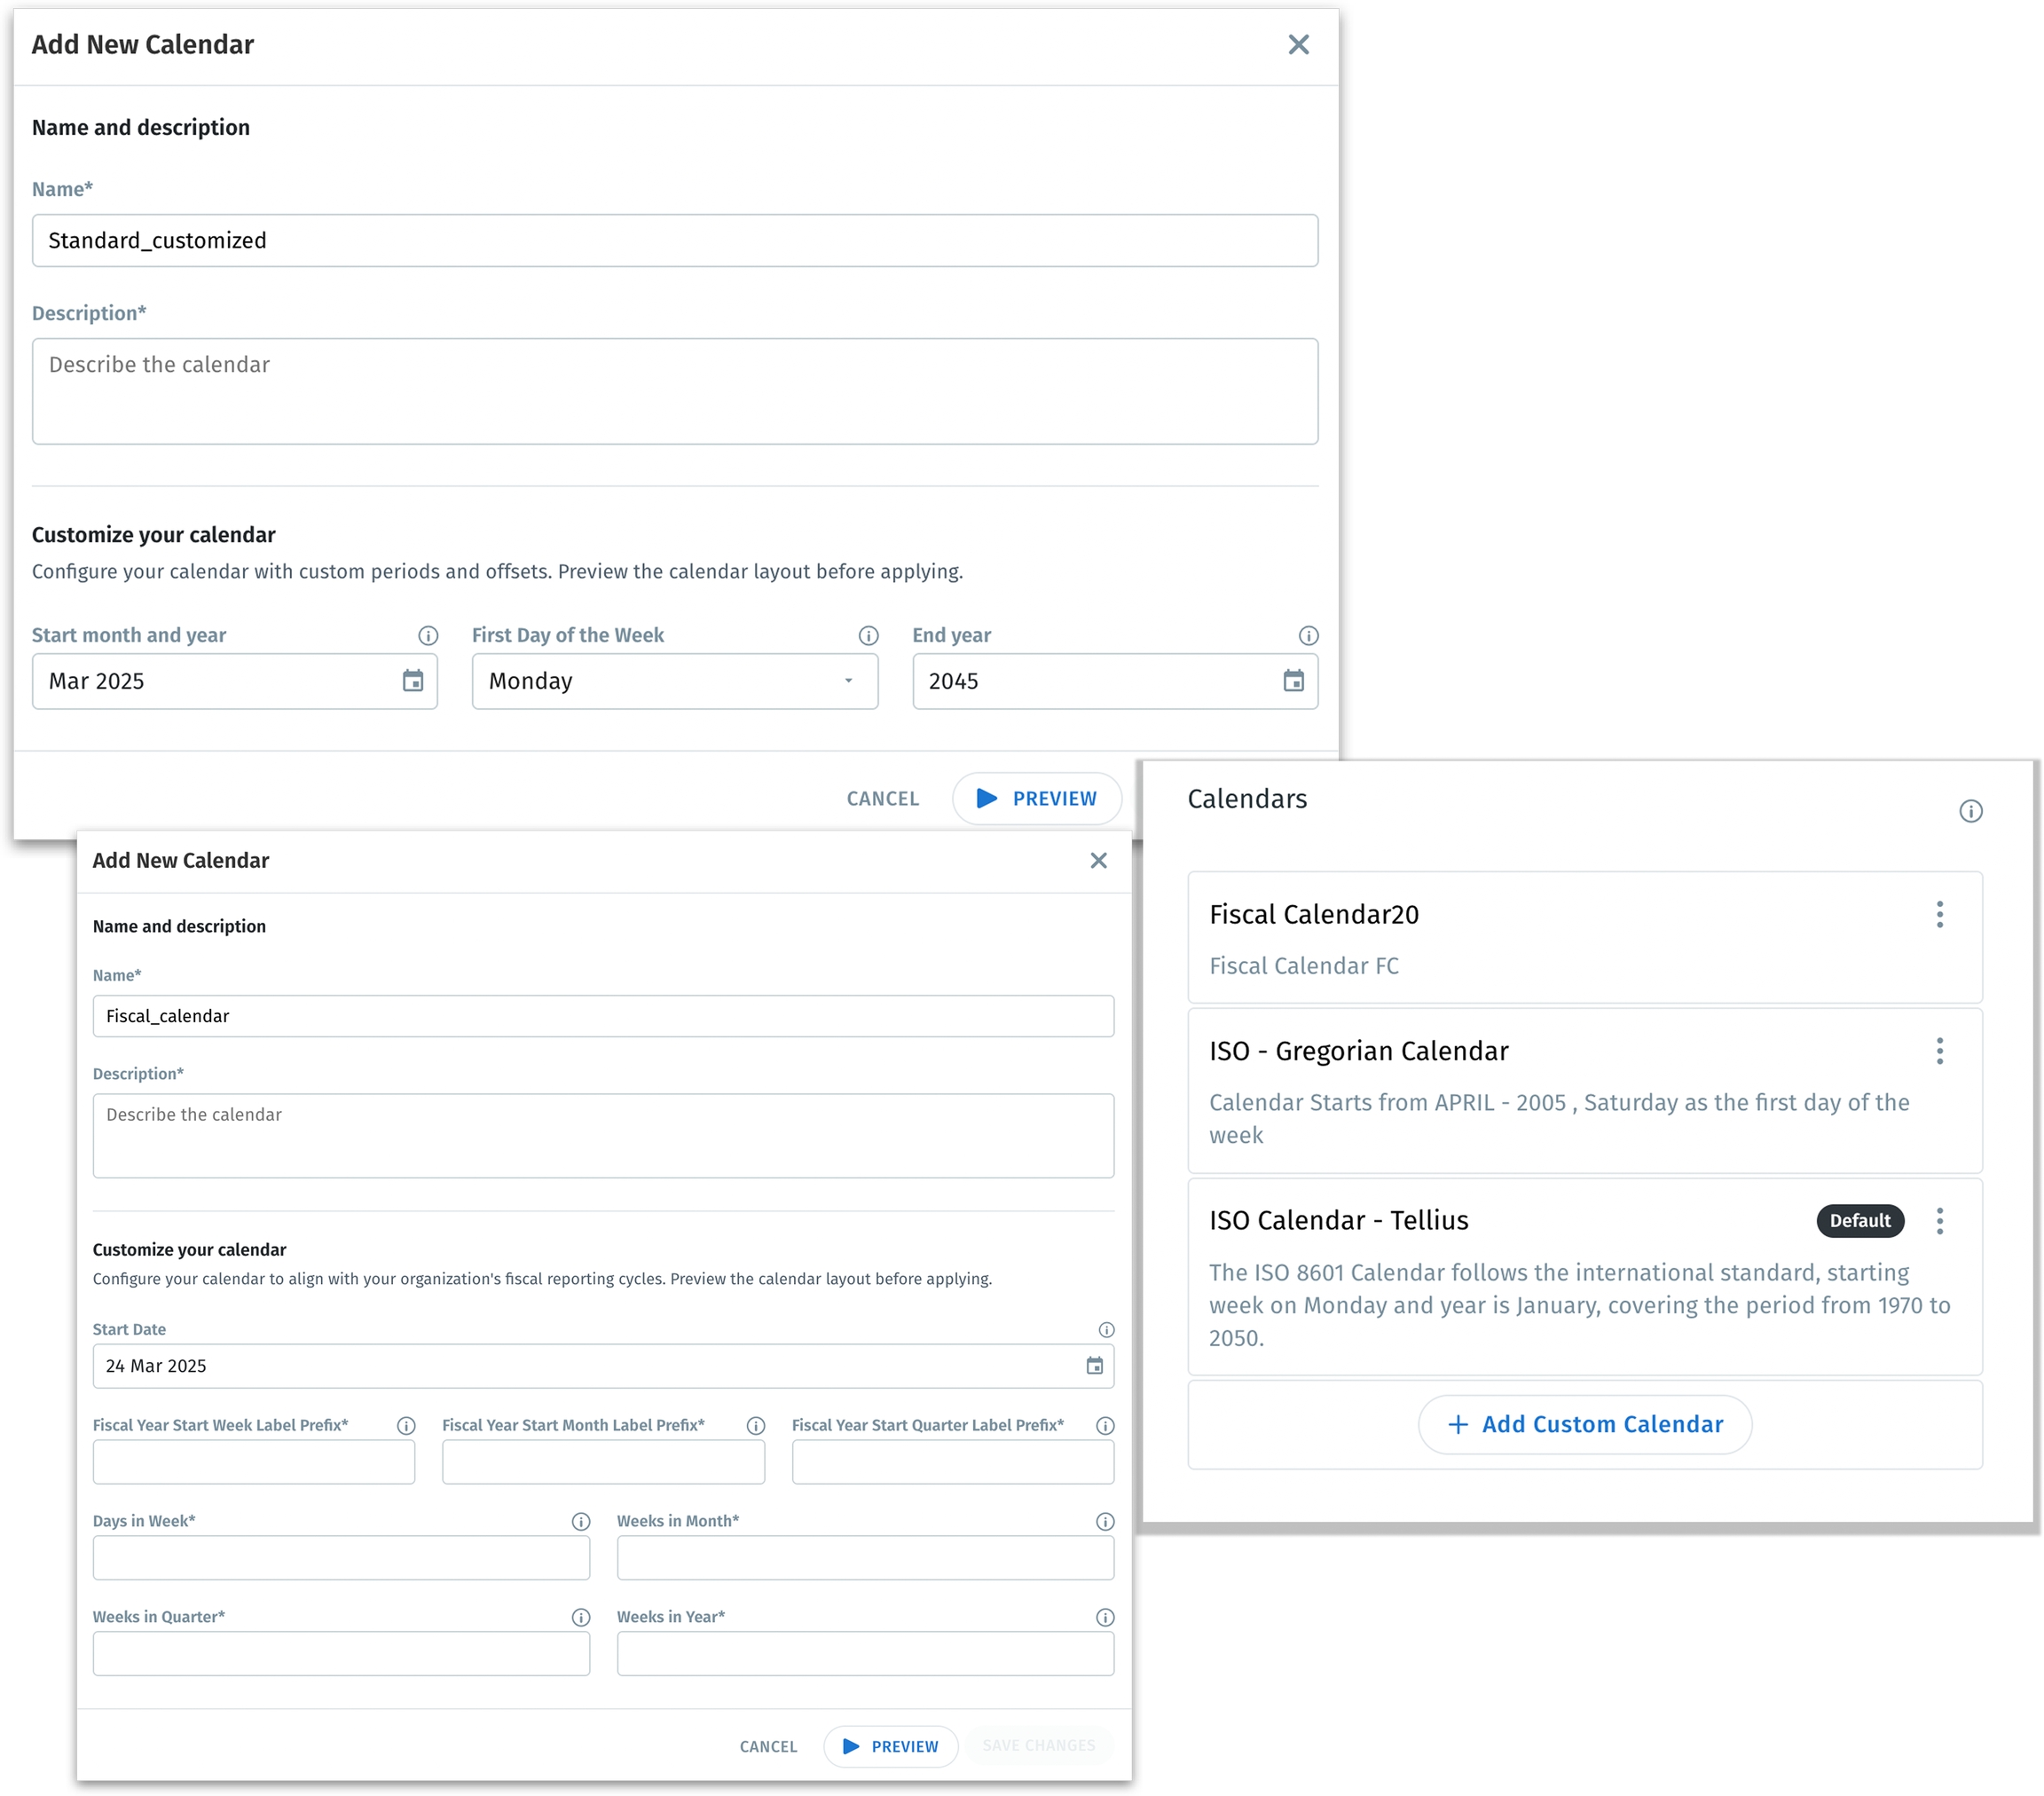
Build custom fiscal calendars
Tellius now lets you create custom calendars (standard and fiscal), so your reports and analyses align with how your business tracks time—whether that's by fiscal weeks, months, or quarters. Set custom start dates for your fiscal year, define week numbers (like 2024/50), and adjust periods to match your unique reporting structure.
You can also set default calendars at the instance or Business View (BV) level, ensuring every analysis follows the correct fiscal structure. This flexibility ensures that every report, chart, and analysis reflects the way you view your fiscal periods, eliminating the need for complex manual workarounds.
Please note that the custom calendar feature is currently available for in-memory Business Views and datasets. We will be extending the support to live datasets in the next release.
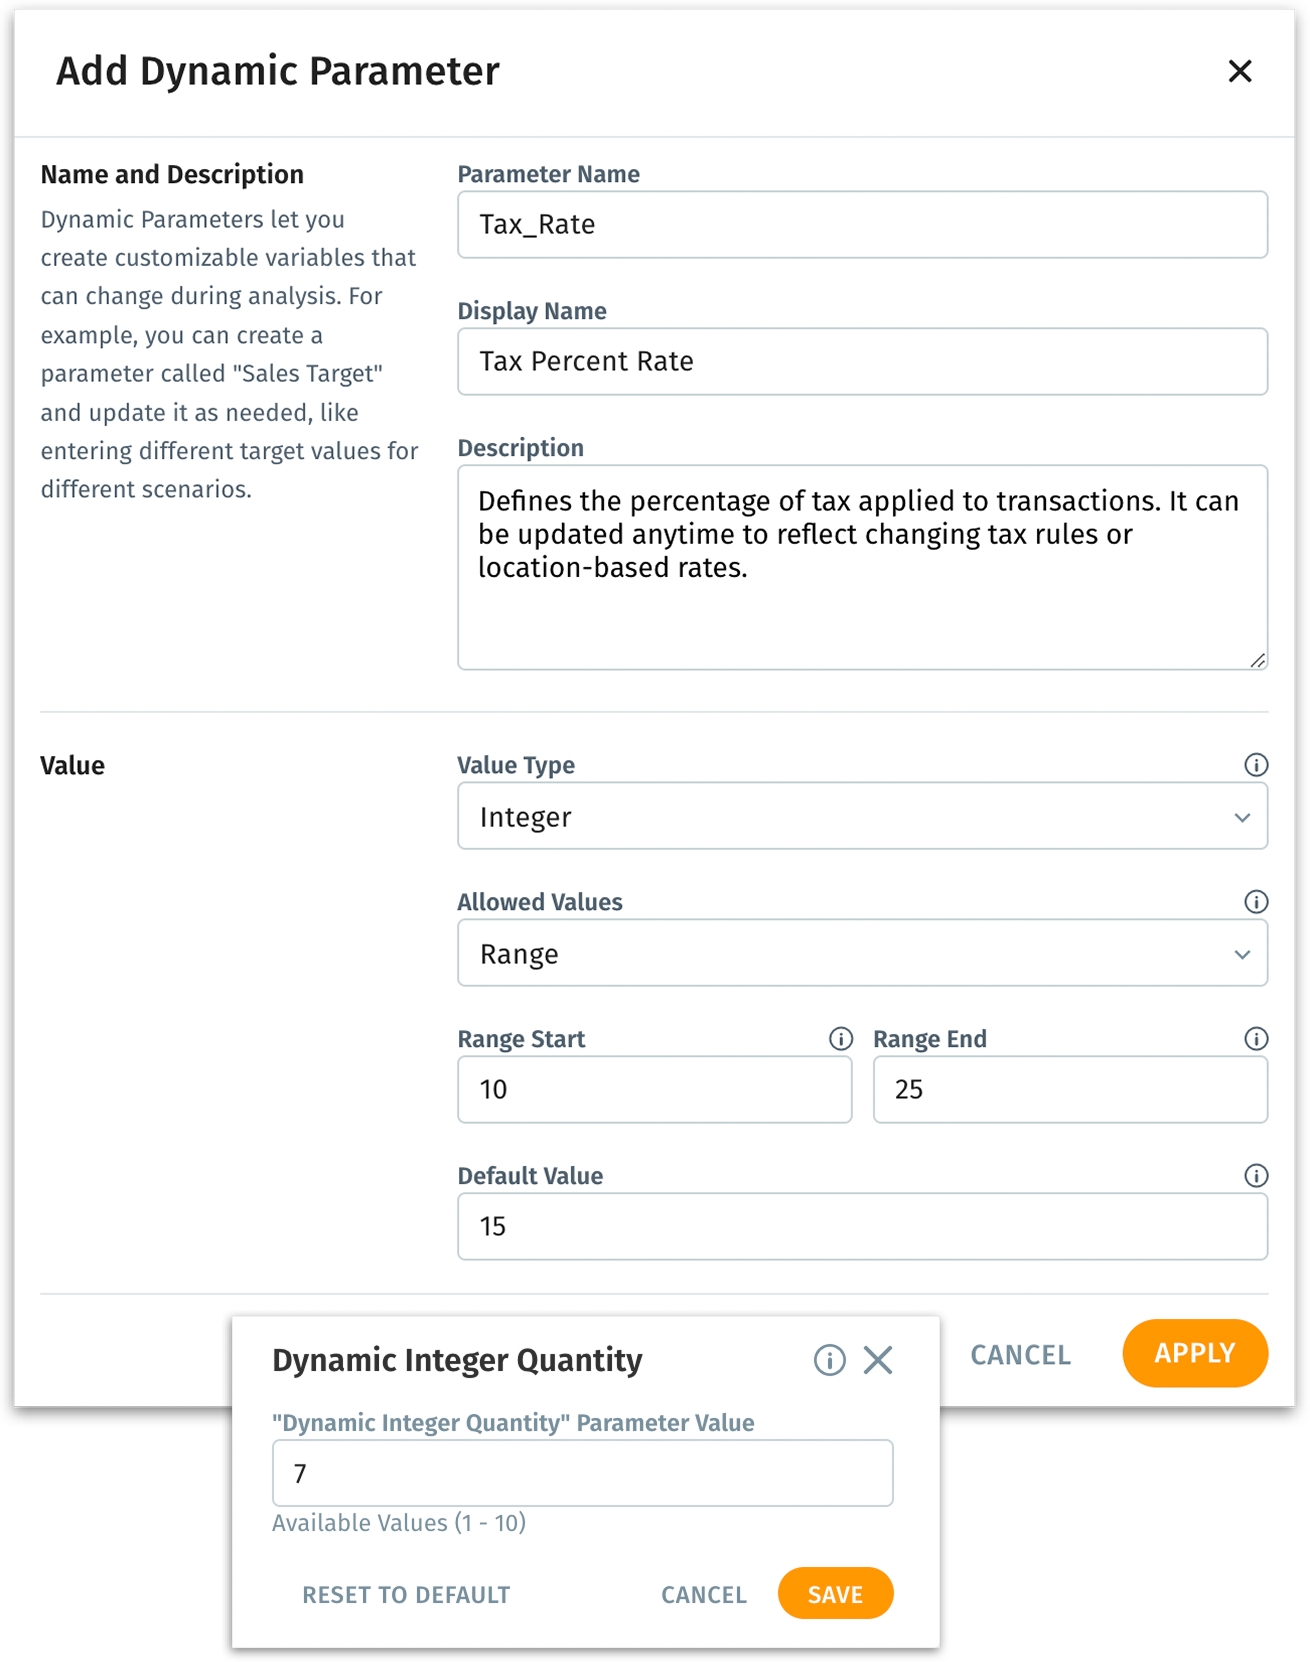
Data on your terms: Shape your dynamic parameters
Tellius 5.4 introduces dynamic parameters for calculated columns in live Business Views, giving users more flexibility and control in their data analysis. Now, users can define parameters—like "Tax Rate" or "Discount Percentage"—and use them in calculated column formulas. These parameters can be easily adjusted on-the-fly within Vizpads during analysis, instantly updating charts to see real-time changes without needing to rewrite formulas or republish datasets.
This feature makes it simple to test custom, scenario-based analysis and see immediate results. For example, if you want to understand how a change in tax rate affects total revenue, you can modify the parameter directly in the chart and watch the data update in real time. This makes analysis faster, more interactive, and accessible—even for non-technical users—while reducing manual recalculations and enabling smarter, quicker decisions.
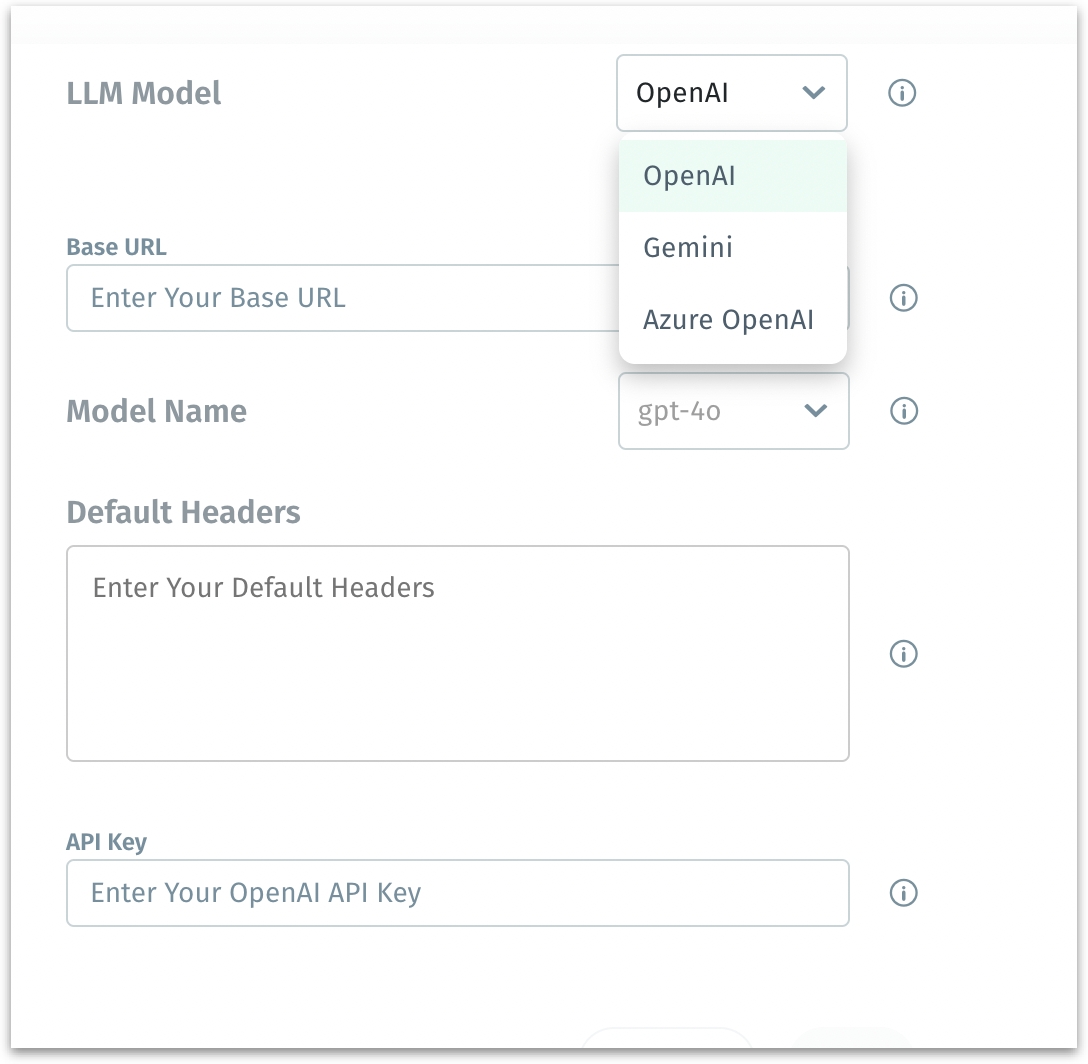
Kaiya expands beyond OpenAI
In response to evolving AI landscapes and customer demand, Tellius 5.4 introduces expanded multi-model LLM support for Kaiya, adding Gemini alongside OpenAI. This flexibility allows organizations to integrate models best suited to their AI strategies and industry needs
A new configuration interface allows admins to independently set up and manage LLMs—updating access keys, selecting models, and assigning defaults through a secure, role-based system. This simplifies LLM management, enhances operational control, and reduces reliance on external support.
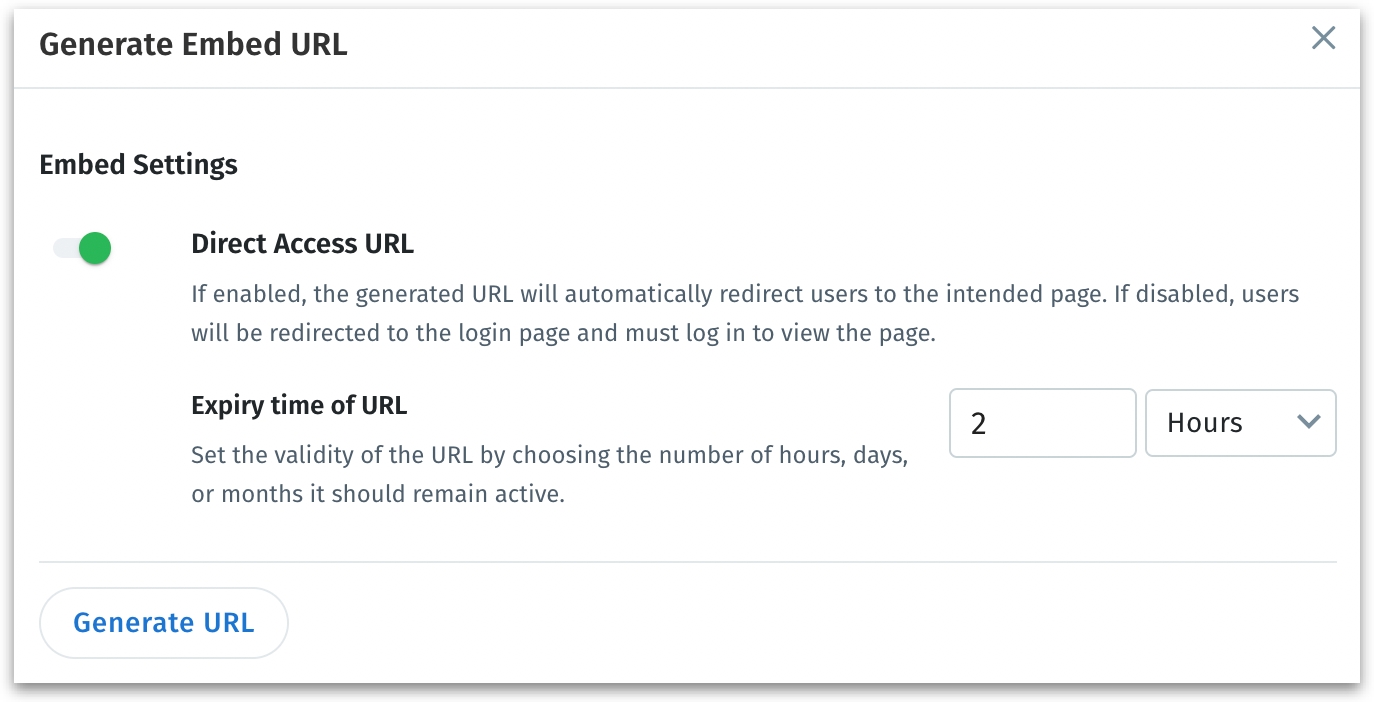
Bring Kaiya anywhere you need them: Embed Kaiya, instantly
With Tellius 5.4, Kaiya’s conversational interface can now be embedded directly into customer in-house applications. This allows organizations to integrate Kaiya’s powerful conversational analytics seamlessly within their own platforms, enabling users to ask data questions, explore insights, and access chat histories—all without switching between systems.
Under Settings → Embed → Kaiya, admins can generate embedding links through configuration settings, with the flexibility to enable access with or without direct login. Users will retain access to existing functionalities, including popular queries, query libraries, feedback, and Learnings, while permissions for accessing Business Views (BVs) will be governed by their Tellius roles. This enhancement simplifies integration, expands accessibility, and ensures consistent, secure interaction with Kaiya within external applications.
Deduplication for Insights: Clean data; clear Insights
Tellius 5.4 introduces smart deduplication to ensure more accurate insights across Vizpads, Search, and Insights. This feature is designed to automatically detect and manage potential data duplication issues, especially when analyzing datasets with complex joins or multiple fact tables—common scenarios that can lead to overcounting and skewed results.
For example, when analyzing TRx (Total Prescriptions), Tellius will focus on relevant dimensions like Payment Type, Brand, Channel, and Geography—and exclude unrelated ones like Call Type. This approach ensures that every insight is based on accurate, relevant data.
The same logic applies to calculated columns. For simple calculations involving one fact table, relevant dimensions are suggested automatically. For more complex calculations across multiple tables (like TRx to Call Ratio) Tellius focuses on shared, common dimensions to avoid duplication and data inconsistencies.
📈 Enhancements
Get more impactful Insights
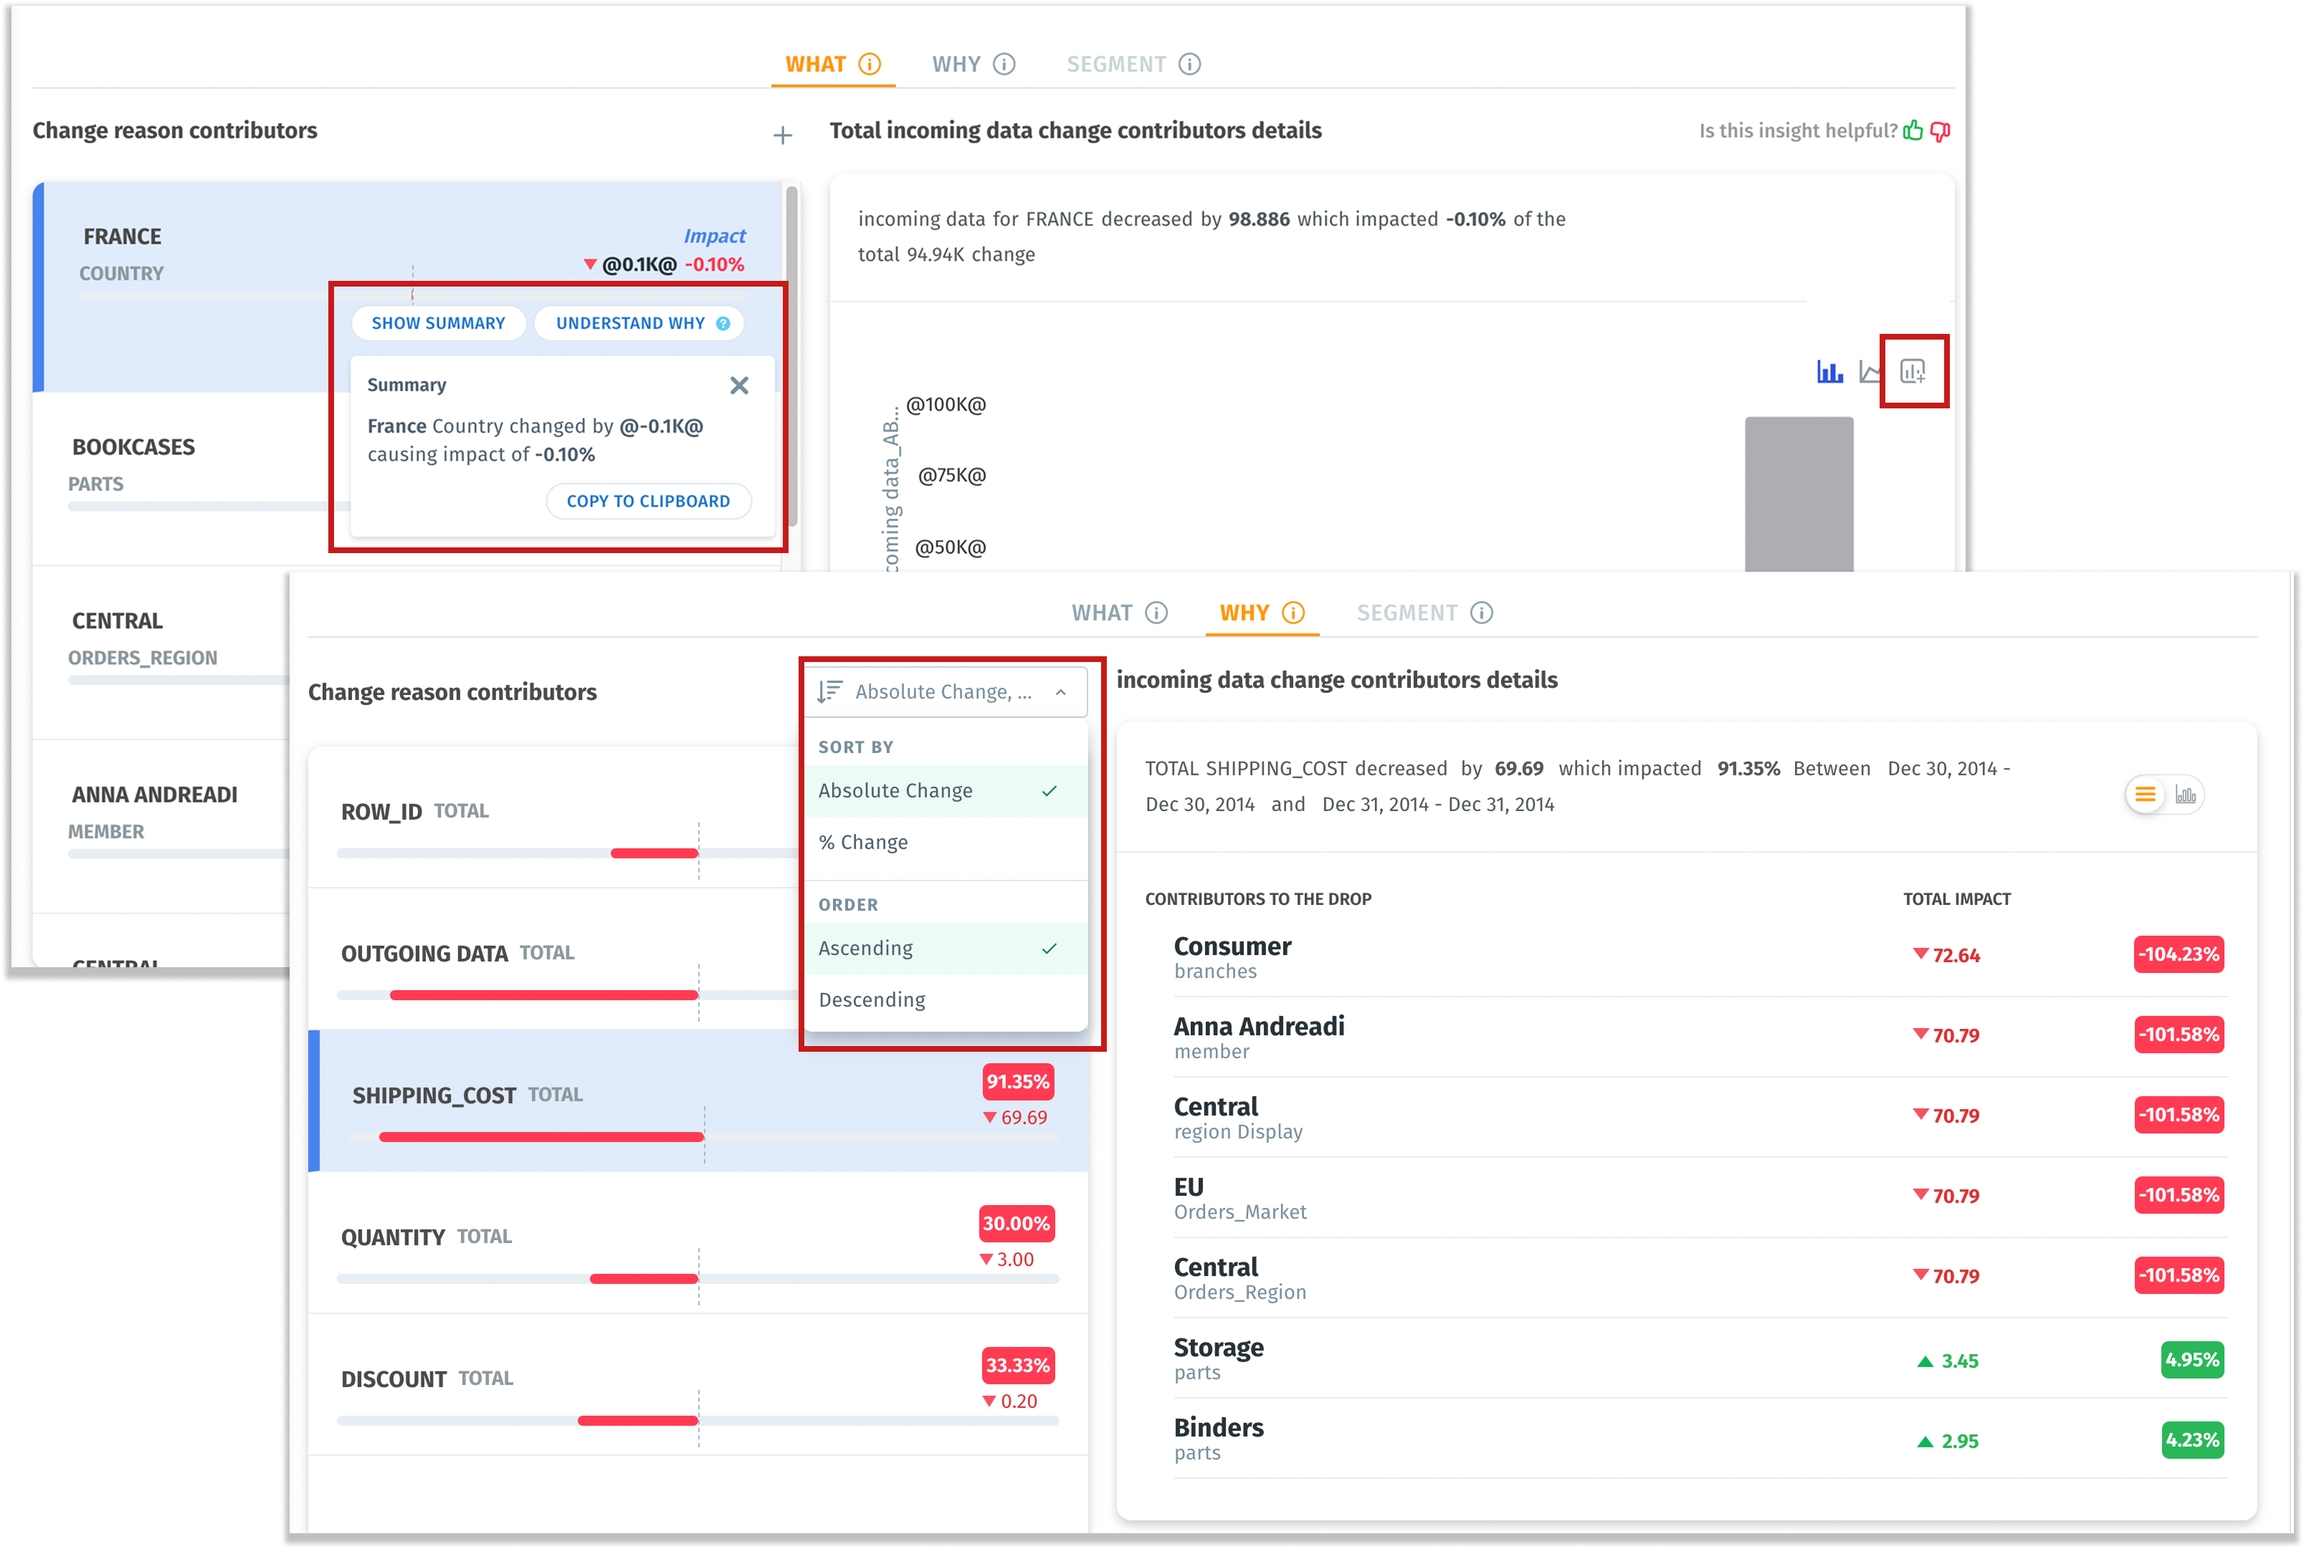
In Tellius 5.4, we have redesigned the Insights results page to focus on improving how you understand, interact with, and derive value. Quickly grasp the what and why behind metric changes, sort insights in ways that matter most to you, and effortlessly turn insights into action with flexible summaries and direct Vizpad integration.
Insights now clearly distinguish between direct contributors (What) and influencing factors (Why).
You can now sort KPIs by absolute or percentage change to quickly identify the biggest contributors impacting your results.
Generate and copy summaries for Insights at different drill-down levels.
Add the required Insights with applied filters directly to Vizpads for deeper visual analysis.
Easily adjust comparison periods, modify contributors, and explore drilldowns for more precise analysis. The "Top Reasons for Change" section has been removed to avoid confusion, streamlining your insights view.
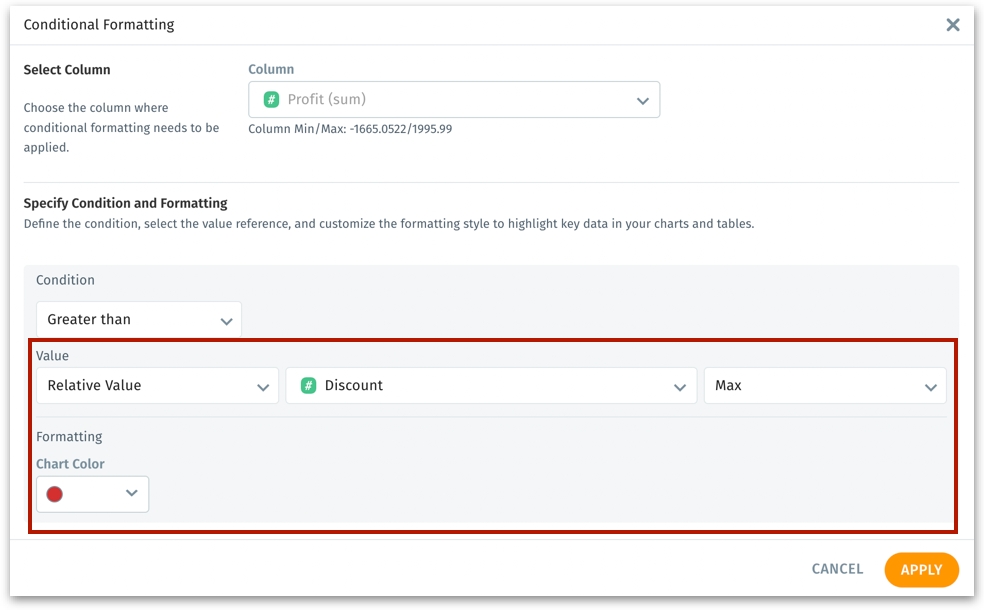
Relative values: Highlight data against live benchmark
Vizpads now enhances conditional formatting by allowing you to compare against aggregated values from other columns, helping teams quickly identify areas that need attention. Previously, formatting was limited to static, hard-coded values, but with this update, you can set conditions that dynamically compare one column’s values to another’s aggregated results—similar to the existing benchmark functionality in bar charts.
For instance, you can format rows where revenue is greater than the expected average by coloring it green, and if it’s less than, color it red. This approach is particularly useful when benchmarking individual or segment performance against broader metrics like regional or national averages.
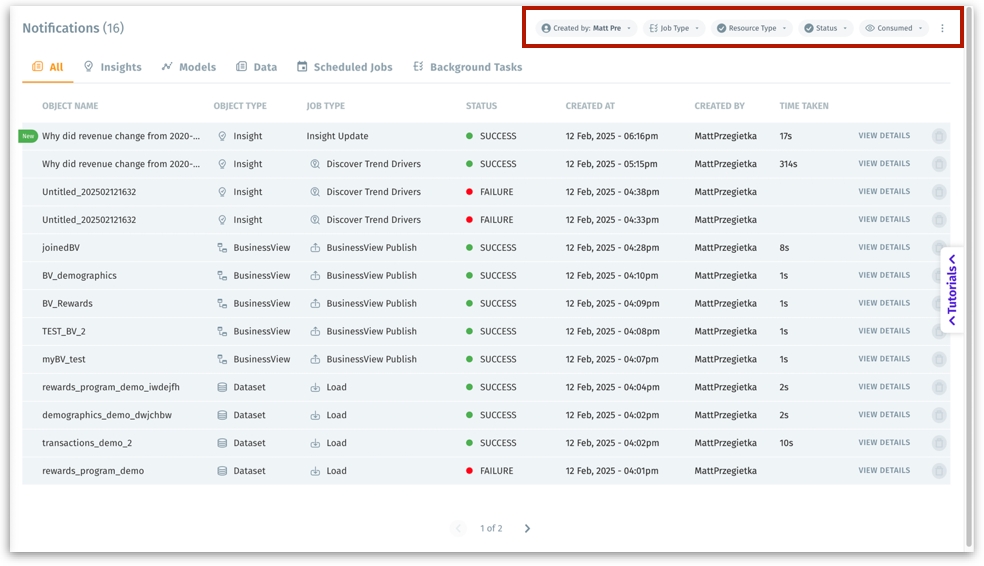
Get full visibility into all running jobs
Managing jobs just got easier. With this update, superusers and admins can now view and track job runs across all users in Tellius. No more guessing who’s running what or when. Get a clear picture of system activity to avoid scheduling conflicts and optimize performance.
Easily access a detailed view of jobs initiated by yourself and others within the organization.
Filter jobs by type, user, role, status, date, and time to gain clear insights into system activity.
This update helps in identifying peak system usage times, allowing for smarter job scheduling and improved performance management.
From loading to done: See every step of your data process
This update to Vizpads gives you better visibility and control over the loading of charts. This will help you understand the exact stage of data processing, reducing uncertainty during longer load times so that you can regenerate only the visuals that fail, avoiding unnecessary reloads of the entire dashboard.
For Vizpads, a step-by-step progress indicator will display statuses like Chart is in the queue, Chart is loading, Number of charts loaded <number>.
Whether you're refreshing the page or applying tab-level filters, Tellius will display how many visuals have loaded and how many are still processing.
If a visual fails to load due to a timeout, server issue, or connection error, you can now regenerate data for that specific visual without impacting the rest of the dashboard. Clear error messages will indicate the cause, such as Timeout, Data Source Connection Failure, or Server Error.
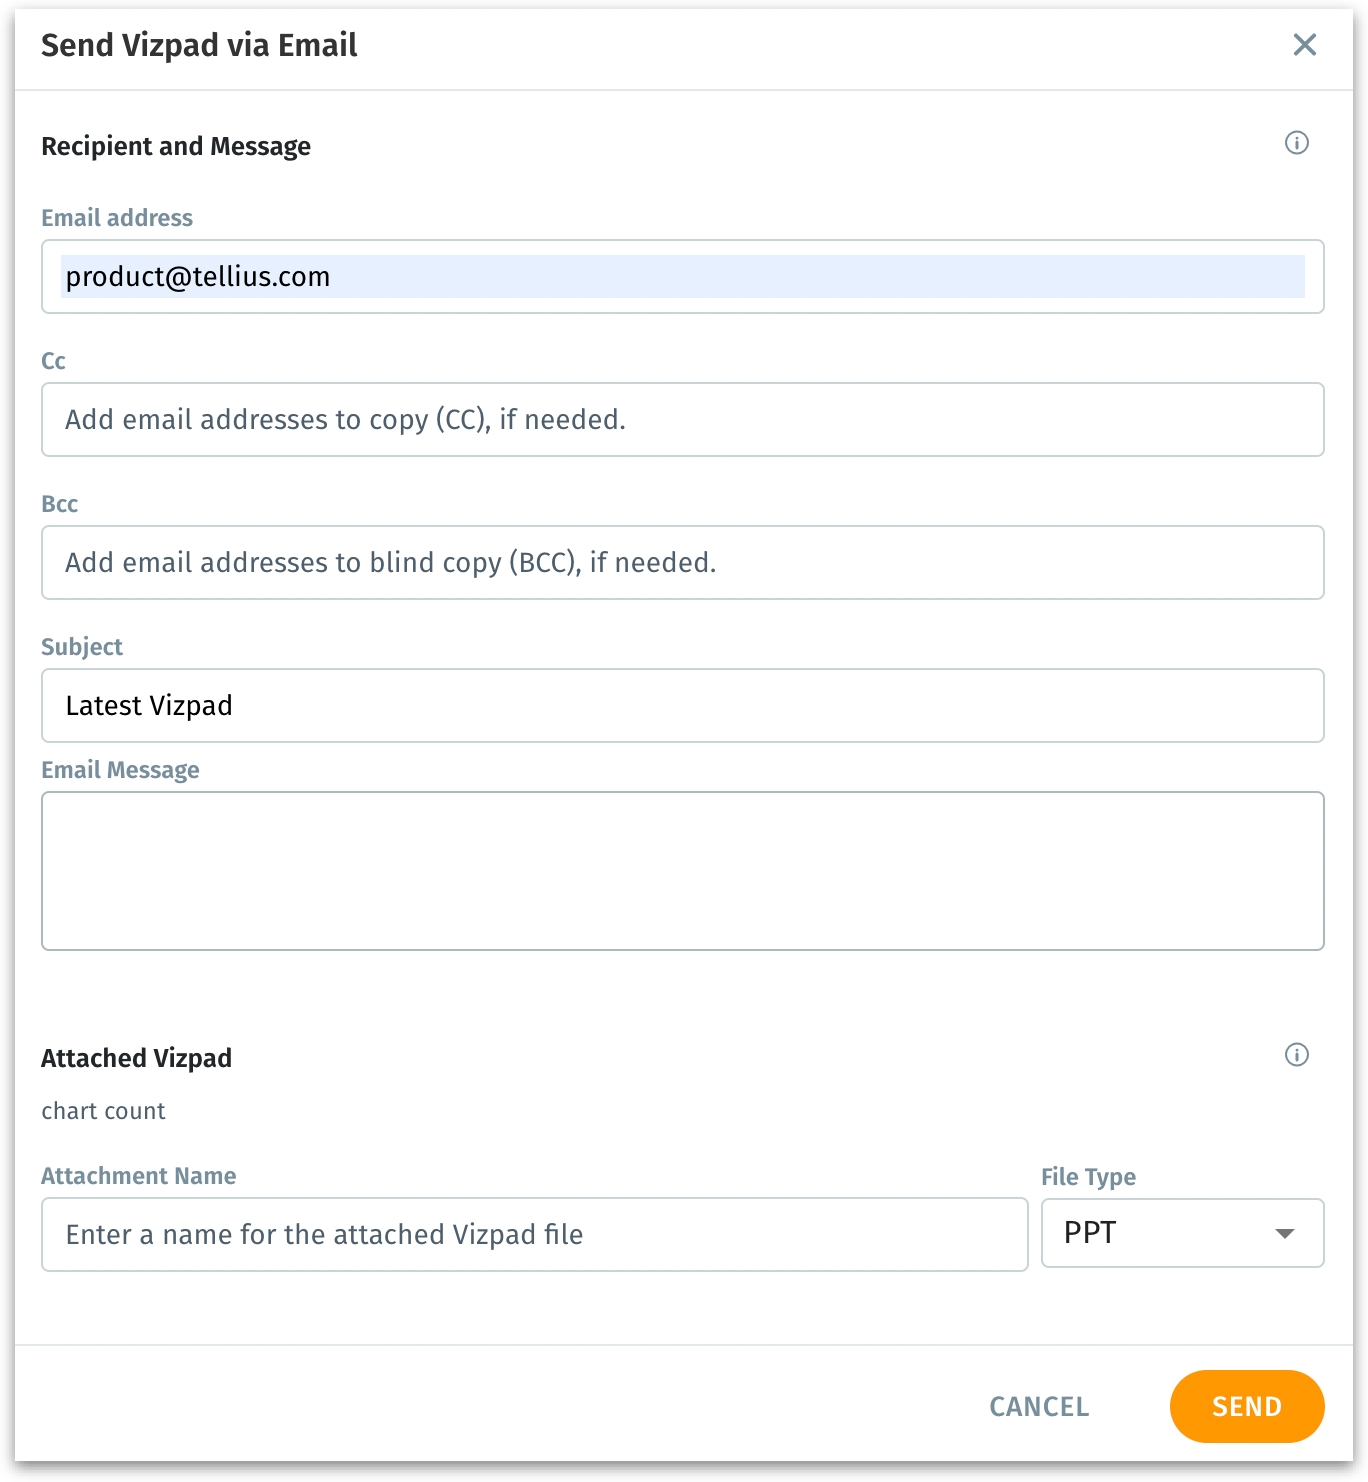
Export and share Vizpads via email
Tellius now simplifies how you share insights. You can directly export Vizpads and share them via email (in the form of PPT and PDF)—no need to save and manually attach files. Customize the name of your Vizpad during export, and the recipient will receive an email containing both the customized name and a direct link to open the Vizpad in Tellius.
This streamlines collaboration, making it faster to distribute insights while maintaining secure, platform-based access.
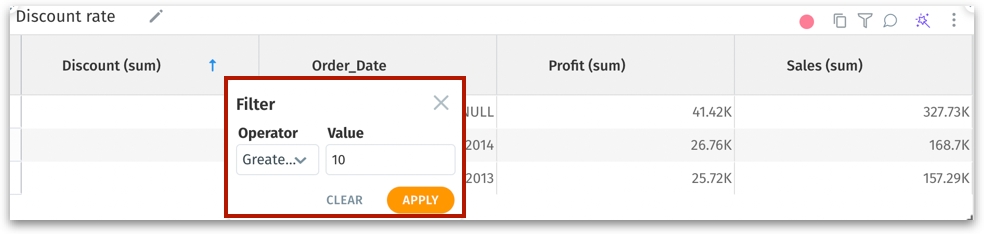
Fast filtering for your data
Filtering table columns in Vizpads is now quicker and more intuitive. With the introduction of column-level filtering, you can apply filters directly from any table column in tables and detailed tables.
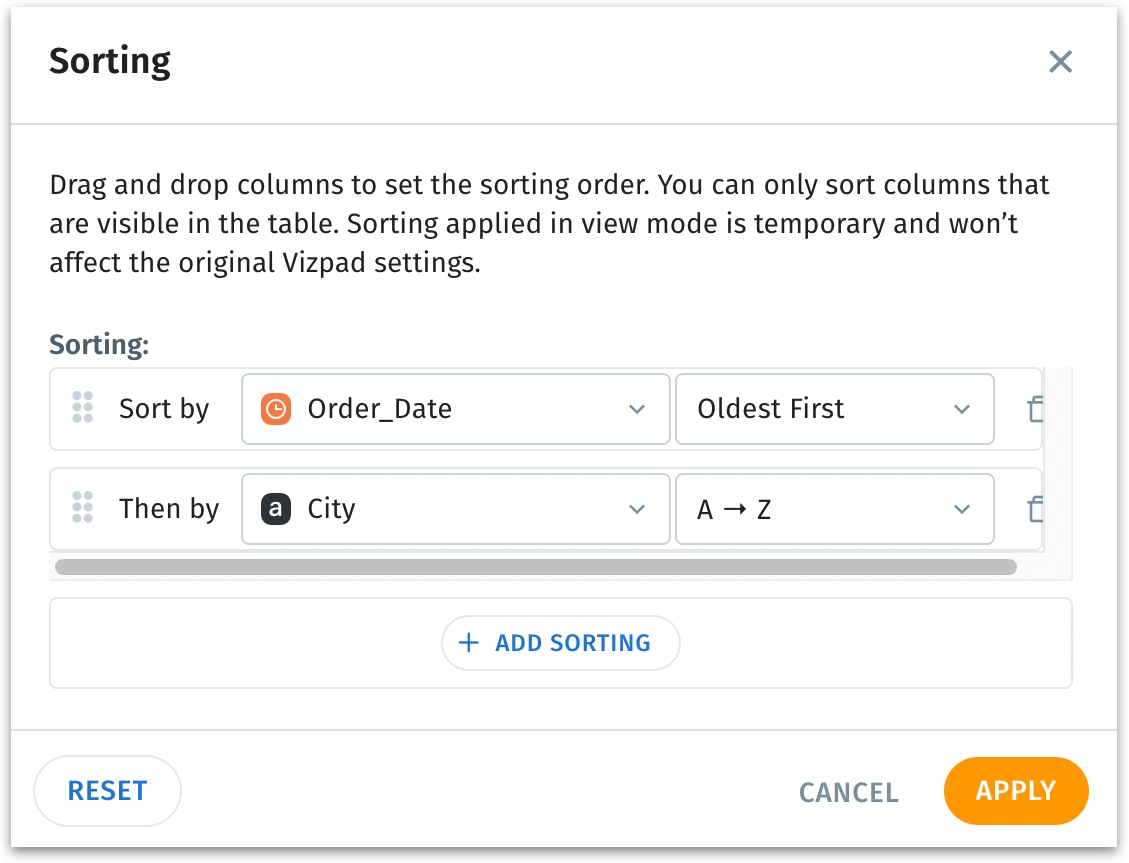
Multi-column sort in View mode
Vizpads now enable multi-column sorting in table (tables and detail tabled) visuals, even in View mode. This enhancement adds a dedicated multi-sort icon to tables and detailed tables, allowing you to select columns and define sorting orders effortlessly. The columns that are visible to you can only be sorted. The column header sort icon now toggles between ascending and descending with just one click, making the sorting process faster and more intuitive. The ascending and descending icons have been removed for every column and will be visible only for columns where the sorting is applied.
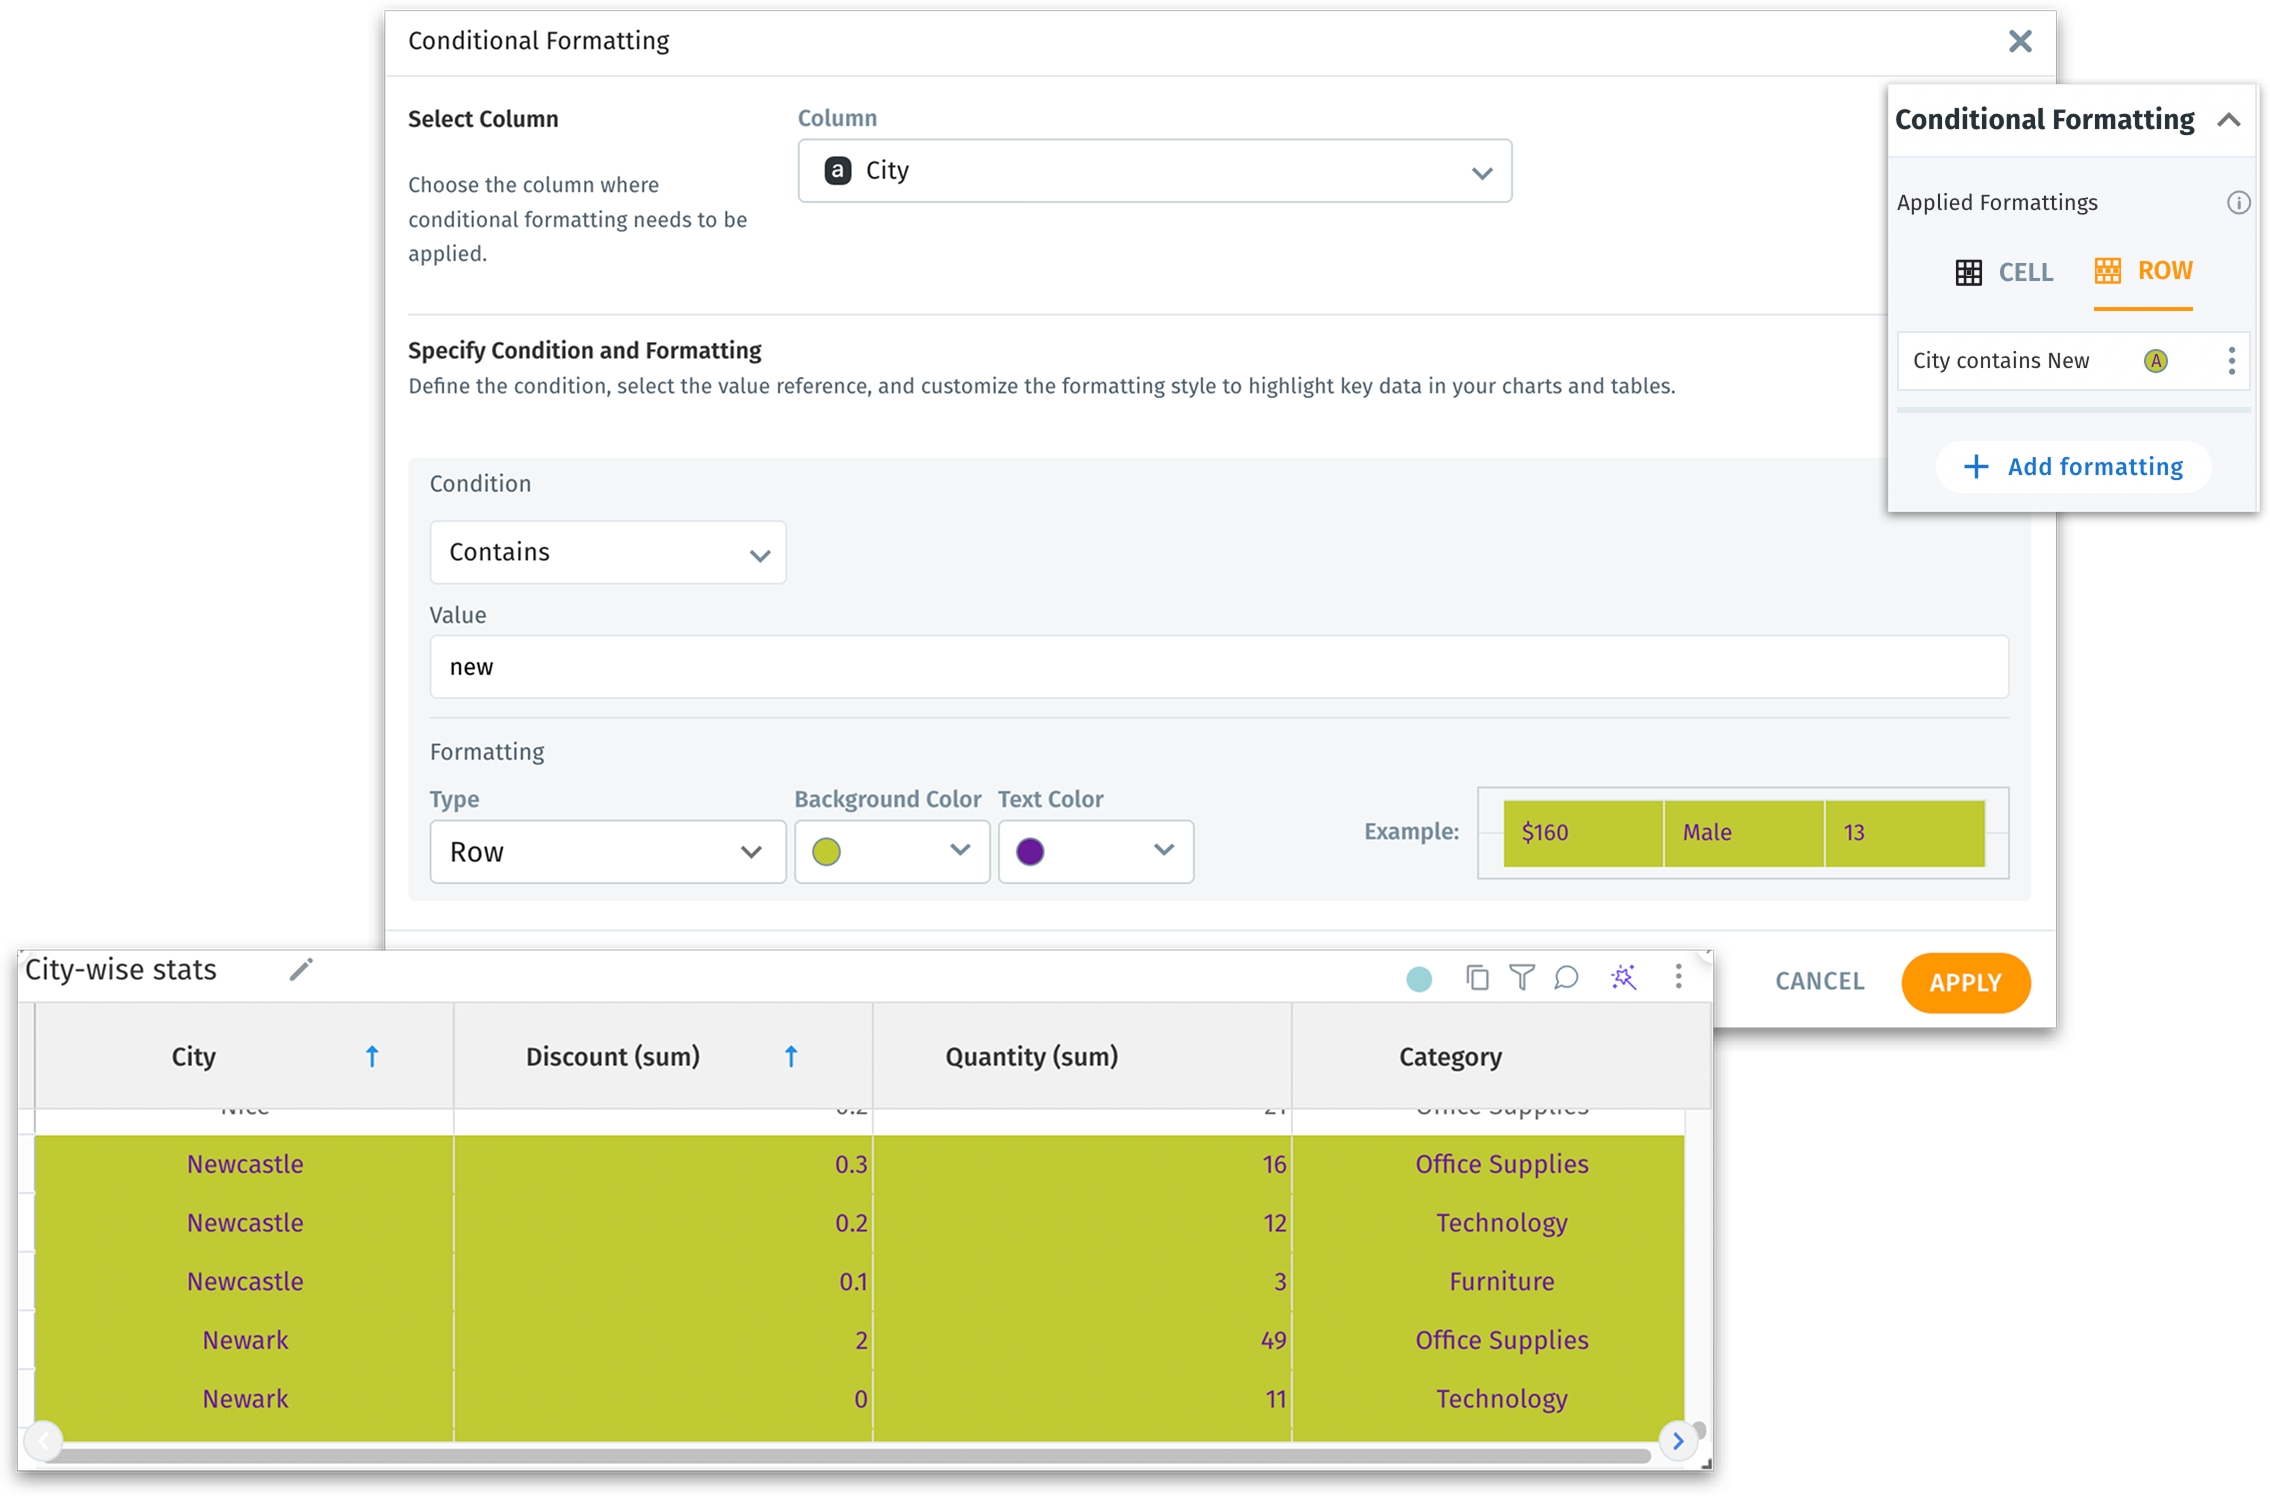
Row-level, cell-level conditional formatting
In Vizpads, we’re enhancing your data visualization experience with row-level conditional formatting for dimensions in tabular charts (Table and Detailed Table).
You can now apply color to entire rows based on specific conditions, making it easier to track project statuses or key metrics at a glance. While each row supports only one condition at a time, multiple independent conditions can be applied across different rows.
To avoid conflicts, if overlapping conditions are applied to the same row, Tellius prompts you to prioritize which condition should take effect. Similarly, if you attempt to delete a column with an active formatting rule, an alert ensures you confirm the action to avoid accidental loss of formatting. Cell level is prioritized.
🚧 Infrastructure Requirements
Starting with Tellius version 5.2, the following infrastructure changes are required for version 5.4 and future releases to ensure secure deployment and compliance with industry best practices. Please ensure your infrastructure meets these requirements before upgrading.
TLS/SSL Certificate
A valid TLS/SSL certificate must be provisioned for securing communication to the Tellius platform. SSL termination must be configured at the Ingress controller or Ingress object level to enable encrypted connections when accessing Tellius.
DNS Configuration
A DNS name (Fully Qualified Domain Name - FQDN) must be configured and resolvable to access the Tellius securely over HTTPS, ensuring seamless access and proper certificate validation.
Access restriction to port 443 (HTTPS only)
Tellius must be exposed exclusively on port 443 to enforce secure HTTPS connections. Access over any other port (including HTTP) must be disabled to maintain a secure deployment.
Ingress-only exposure
Tellius must be exposed via an Ingress controller. Direct exposure using a Kubernetes LoadBalancer service type is no longer supported, enabling better control over routing, TLS handling, and access policies.
Ingress controller deployment
An Ingress controller must be deployed and operational in the target Kubernetes environment. It is responsible for handling TLS termination, routing traffic to the Tellius application, and enforcing access policies. Tellius supports the Nginx Ingress controller or any other Ingress controller managed and maintained by your IT or DevOps team.
Last updated
Was this helpful?