Tellius
  • ๐ŸšฉGetting Started
    • ๐Ÿ‘‹Say Hello to Tellius
      • Glossary
      • Tellius 101
      • Navigating around Tellius
      • Guided tours for quick onboarding
    • โšกQuick Start Guides
      • Search
      • Vizpads (Explore)
      • Insights (Discover)
    • โœ…Best Practices
      • Search
      • Vizpads (Explore)
      • Insights (Discover)
      • Predict
      • Data
    • โฌ‡๏ธInitial Setup
      • Tellius architecture
      • System requirements
      • Installation steps for Tellius
      • Customizing Tellius
    • Universal Search
    • ๐Ÿ Tellius Home Page
  • Kaiya
    • โ™Ÿ๏ธUnderstanding AI Agents & Agentic Flows
      • Glossary
      • Composer
      • ๐Ÿ—๏ธTriggering an agentic workflow
      • The art of possible
      • Setting up LLM for Kaiya
    • ๐ŸคนKaiya conversational AI
      • โ“FAQs on Kaiya Conversations
      • Triggering Insights with "Why" questions
      • Mastering Kaiya conversational AI
  • ๐Ÿ”Search
    • ๐Ÿ‘‹Get familiar with our Search interface
    • ๐Ÿค”Understanding Tellius Search
    • ๐Ÿ“Search Guide
    • ๐Ÿš€Executing a search query
      • Selecting a Business View
      • Typing a search query
      • Constructing effective search queries
      • Marketshare queries
    • ๐Ÿ”‘Analyzing search results
      • Understanding search results
      • Search Inspector
      • Time taken to execute a query
      • Interacting with the resulting chart
    • ๐Ÿ“ŠKnow your charts in Tellius
      • Understanding Tellius charts
      • Variations of a chart type
      • Building charts from Configuration pane
      • List of chart-specific fields
      • Adding columns to fields in Configuration pane
      • Absolute and percentage change aggregations
      • Requirements of charts
      • Switching to another chart
      • Formatting charts
      • Advanced Analytics
      • Cumulative line chart
    • ๐Ÿง‘โ€๐ŸซHelp Tellius learn
    • ๐Ÿ•ต๏ธโ€โ™‚๏ธSearch history
    • ๐ŸŽ™๏ธVoice-driven search
    • ๐Ÿ”ดLive Query mode
  • ๐Ÿ“ˆVizpads (Explore)
    • ๐Ÿ™‹Meet Vizpads!
    • ๐Ÿ‘‹Get familiar with our Vizpads
    • #๏ธโƒฃMeasures, dimensions, date columns
    • โœจCreating Vizpads
    • ๐ŸŒApplying global filters
      • Filters in multi-BV Vizpads
      • Filters using common columns
    • ๐Ÿ“ŒApplying local filters
    • ๐Ÿ“…Date picker in filters
      • Customizing the calendar view
    • โœ…Control filters
      • Multi-select list
      • Single-select list
      • Range slider
      • Dropdown list
    • ๐Ÿ‘๏ธActions in View mode
      • Interacting with the charts
    • ๐Ÿ“Actions in Edit mode
      • ๐Ÿ—จ๏ธViz-level actions
    • ๐Ÿ”งAnomaly management for line charts
      • Instance level
      • Vizpad level
      • Chart level
    • โณTime taken to load a chart
      • Instance level
      • Vizpad level
      • Chart level
    • โ™Ÿ๏ธWorking with sample datasets
    • ๐Ÿ”Swapping Business View of charts
      • Swapping only the current Vizpad
      • Swapping multiple objects
      • Configuring the time of swap
    • ๐Ÿค–Explainable AI charts
  • ๐Ÿ’กInsights (Discover)
    • ๐Ÿ‘‹Get familiar with our Insights
    • โ“Understanding the types of Insights
    • ๐Ÿ•ต๏ธโ€โ™‚๏ธDiscovery Insights
    • โž•How to create new Insights
      • ๐Ÿ”›Creating Discovery Insight
      • ๐Ÿ”‘Creating Key Driver Insights
      • ใ€ฐ๏ธCreating Trend Insights
      • ๐Ÿ‘ฏCreating Comparison Insights
    • ๐ŸงฎThe art of selecting columns for Insights
      • โžก๏ธHow to include/exclude columns?
  • ๐Ÿ”ขData
    • ๐Ÿ‘‹Get familiar with our Data module
    • ๐Ÿฅ‚Connect
    • ๐ŸชนCreate new datasource
      • Connecting to Oracle database
      • Connecting to MySQL database
      • Connecting to MS SQL database
      • Connecting to Postgres SQL database
      • Connecting to Teradata
      • Connecting to Redshift
      • Connecting to Hive
      • Connecting to Azure Blob Storage
      • Connecting to Spark SQL
      • Connecting to generic JDBC
      • Connecting to Salesforce
      • Connecting to Google cloud SQL
        • Connecting to a PostgreSQL cloud SQL instance
        • Connecting to an MSSQL cloud SQL instance
        • Connecting to a MySQL Cloud SQL Instance
      • Connecting to Amazon S3
      • Connecting to Google BigQuery
        • Steps to connect to a Google BigQuery database
      • Connecting to Snowflake
        • OAuth support for Snowflake
        • Integrating Snowflake with Azure AD via OAuth
        • Integrating Snowflake with Okta via OAuth
        • Azure PrivateLink
        • AWS PrivateLink
        • Best practices
      • Connecting to Databricks
      • Connecting to Databricks Delta Lake
      • Connecting to an AlloyDB Cluster
      • Connecting to HDFS
      • Connecting to Looker SQL Interface
      • Loading Excel sheets
      • ๐ŸšงUnderstanding partitioning your data
    • โณTime-to-Live (TTL) and Caching
    • ๐ŸŒทRefreshing a datasource
    • ๐ŸชบManaging your datasets
      • Swapping datasources
    • ๐ŸฃPreparing your datasets
      • ๐ŸคพActions that can be done on a dataset
      • Data Pipeline
      • SQL code snippets
      • โœ๏ธWriteback window
      • ๐ŸงฉEditing Prepare โ†’ Data
      • Handling null or mismatched values
      • Metadata view
      • List of icons and their actions
        • Functions
        • SQL Transform
        • Python Transform
        • Standard Aggregation
        • Creating Hierarchies
      • Dataset Scripting
      • Fusioning your datasets
      • Scheduling refresh for datasets
    • ๐ŸฅPreparing your Business Views
      • ๐ŸŒŸCreate a new Business View
      • Creating calculated columns
      • Creating dynamic parameters
      • Scheduling refresh for Business Views
      • Setting up custom calendars
    • Tellius Engine: Comparison of In-Memory vs. Live Mode
  • Feed
    • ๐Ÿ“ฉWhat is a Feed in Tellius?
    • โ—Alerts on the detection of anomalies
    • ๐Ÿ“ฅViewing and deleting metrics
    • ๐Ÿ–ฒ๏ธTrack a new metric
  • Assistant
    • ๐Ÿ’Introducing Tellius Assistant
    • ๐ŸŽคVoice-based Assistant
    • ๐Ÿ’ฌInteracting with Assistant
    • โ†–๏ธSelecting Business View
  • Embedding Tellius
    • What you should know before embedding
    • Embedding URL
      • ๐Ÿ“ŠEmbedding Vizpads
        • Apply and delete filters
        • Vizpad-related actionTypes
        • Edit, save, and share a Vizpad
        • Keep, remove, drill sections
        • Adding a Viz to a Vizpad
        • Row-level policy filters
      • ๐Ÿ’กEmbedding Insights
        • Creating and Viewing Insights
      • ๐Ÿ”ŽEmbedding Search
        • Search query execution
      • Embedding Assistant
      • ๐Ÿช„Embedding Kaiya
      • Embedding Feed
  • API
    • Insights APIs
    • Search APIs
    • Authentication API (Login API)
  • โœจWhat's New
    • Release 5.4
      • Patch 5.4.0.x
    • Release 5.3
      • Patch 5.3.1
      • Patch 5.3.2
      • Patch 5.3.3
    • Release 5.2
      • Patch 5.2.1
      • Patch 5.2.2
    • Release 5.1
      • Patch 5.1.1
      • Patch 5.1.2
      • Patch 5.1.3
    • Release 5.0
      • Patch 5.0.1
      • Patch 5.0.2
      • Patch 5.0.3
      • Patch 5.0.4
      • Patch 5.0.5
    • Release 4.3 (Fall 2023)
      • Patch 4.3.1
      • Patch 4.3.2
      • Patch 4.3.3
      • Patch 4.3.4
    • Release 4.2
      • Patch 4.2.1
      • Patch 4.2.2
      • Patch 4.2.3
      • Patch 4.2.4
      • Patch 4.2.5
      • Patch 4.2.6
      • Patch 4.2.7
    • Release 4.1
      • Patch 4.1.1
      • Patch 4.1.2
      • Patch 4.1.3
      • Patch 4.1.4
      • Patch 4.1.5
    • Release 4.0
Powered by GitBook

ยฉ 2025 Tellius

On this page
  • Operators based on column type
  • Displaying applied filters

Was this helpful?

Export as PDF
  1. Vizpads (Explore)
  2. Applying global filters

Filters in multi-BV Vizpads

Guide for applying global filters for multi-Business View Vizpads

PreviousApplying global filtersNextFilters using common columns

Last updated 1 year ago

Was this helpful?

Here's a complete guide for applying global filters:

  1. Click on the Add filter button.

  2. Start typing a specific column or click on the dropdown button to view the columns of each Business View used in the Vizpad.
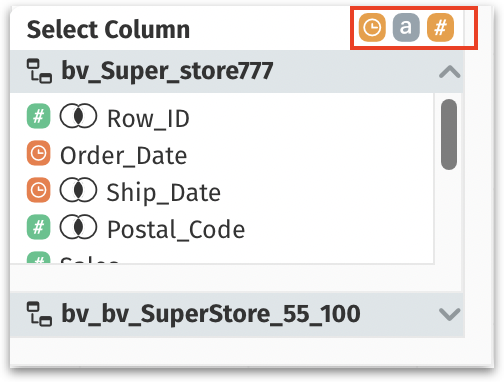
  3. Next to the Select Column, you can find three buttons that act as filters - Date/time dimensions, dimensions, and measures. Click on the required button(s) to filter the columns displayed.

For more details about measures, dimensions, and date columns, check out .

Three types of columns
  1. If any column type is selected, then that indicator will be displayed in orange color, whereas the disabled column type will be displayed in grey color. Here, only measures and date/time dimensions are selected, and dimensions are disabled.

  1. Select the required column, operator, and values.

Operators based on column type

When you apply filters, the available operators vary depending on the type of column selected.

  1. If a dimension is selected, the following operators will be displayed:

    • In: Includes values that match a specified list.

    • Not in: Excludes values that match a specified list.

    • Equals: Matches a specific value.

    • Does not equal: Excludes a specific value.

    • Contains: Includes values containing a specific substring.

    • Does not contain: Excludes values containing a specific substring.

    • Matches regex: Includes values that match a specific regular expression.

    • Starts with: Includes values beginning with a specific substring.

    • Not starts with: Excludes values beginning with a specific substring.

    • Ends with: Includes values ending with a specific substring.

    • Not ends with: Excludes values ending with a specific substring.

    • Blank: Includes values that are blank or null.

    • Not blank: Excludes values that are blank or null.

  2. If a measure is selected, the following operators will be displayed:

    • Equals: Matches a specified numeric value.

    • Does not equal: Excludes a specified numeric value.

    • Greater than: Includes values greater than a specified number.

    • Greater than or equal to: Includes values equal to or greater than a specified number.

    • Less than: Includes values less than a specified number.

    • Less than or equal to: Includes values equal to or less than a specified number.

    • Inbetween: Includes values within a specified numeric range.

Displaying applied filters

  1. Click on Apply to apply the filter, or click on Cancel to discard.

  2. If you filter using the columns exclusive to one Business View, then the filter will be applied to the charts created using that particular Business View.

  3. The applied filter will be mentioned at the top, near Add filter, represented in the color of the Business View itโ€™s applied for.

  1. If you hover over the filter, then the charts for which the filter is applied will be highlighted (over their border). Click on the applied filter to edit it further, or click on the โ€˜Xโ€™ on it to remove the filter.

  2. If you add a filter to a specific Business View, then it will be aligned along with the existing filters of the same Business View as shown below.

Selecting/deselecting column types

The columns found in more than one Business View (common to multiple Business Views) will be represented with a Venn diagram icon. For more details, check out .

If a date dimension is selected, the following date picker will be displayed for selecting specific dates or date ranges. For more details about the date picker window, check out .

Displaying the applied filter
Aligning filters from the same Business View
๐Ÿ“ˆ
๐ŸŒ
this page
this page
this page
The color of the filter matches the associated business view
Filtering different types of columns in a business view
Grouping filters of same business view
Date picker
Indicating the applied filter