🗨️Viz-level actions
Explore and modify individual charts in Edit mode with actions like cloning, filtering, copying across tabs, hover controls, summaries, and custom color themes.
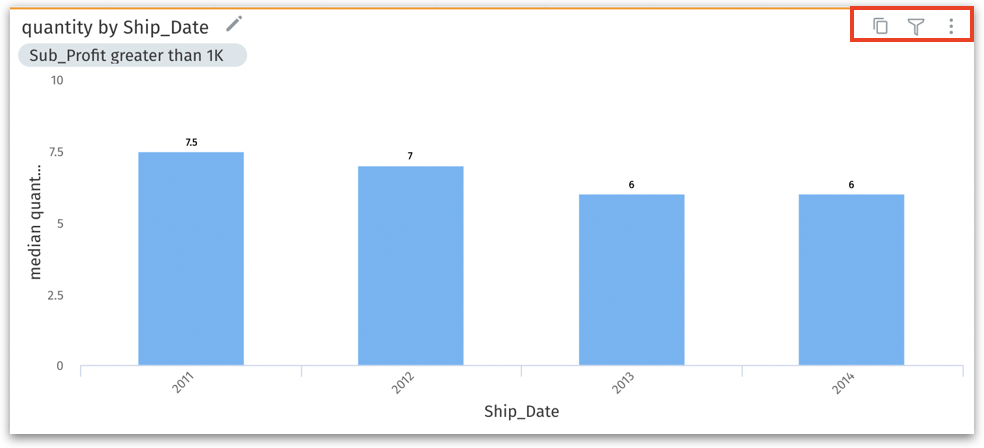
Each individual chart comes with the following options that could be used to make any changes to that specific chart.

Clone: Click on Clone to duplicate the chart. This creates an exact replica within the same Vizpad tab, preserving all filters and settings.
Filter: This is a local filter that applies filters to the individual chart. For more details, check out this page.
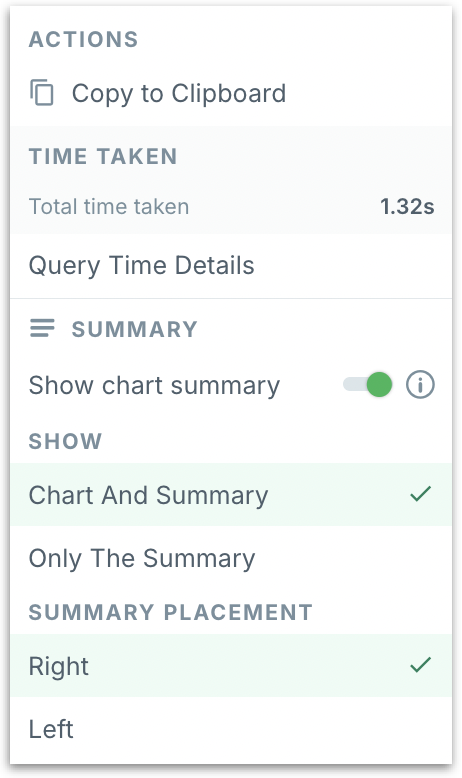
Three-dot menu: Click on the three-dot menu and the following menu will be displayed.

Copy to Clipboard: This option lets you duplicate a chart or table across tabs or Vizpads. Check out this page.
Clone vs Copy to Clipboard
Clone: Instantly duplicates the chart or table within the same tab. The copy appears directly below the original and includes all formatting, filters, and settings.
Copy to Clipboard: Saves the chart or table to your clipboard, including all associated settings. You can then navigate to any other tab or Vizpad (in Edit mode) and paste it there. This is ideal for reusing charts across different views or projects. The copied item remains in the clipboard until your session ends or you copy something else.
Total time taken: It displays the time taken by Tellius and other external engines to load the individual chart. Click on Query time details to view the complete breakdown.
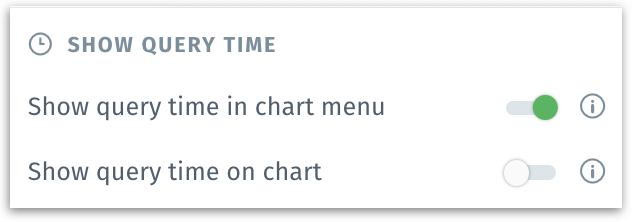
The visibility of this menu is based on the selection made in the Show query time menu in the Vizpad. For more details, check out this page.

Show chart summary: Enables or disables the chart summary (powered by Kaiya). When turned on, Tellius provides natural language explanation of key patterns, comparisons, or outliers observed in the chart. Summaries help non-technical users interpret trends quickly.
Show options
Chart and Summary: Displays the chart alongside Kaiya summary.
Only the Summary: Hides the chart and shows only the summary insight.
Summary placement
Right: Positions the summary panel on the right side of the chart.
Left: Positions the summary panel on the left side of the chart.
Hover actions
When you hover over any chart in the Vizpad, the following options will be displayed.
Relocation: A four sided arrow will be displayed in the top left corner of the chart, which can be used to move the chart around in the canvas. Drag and drop in the required location.
Delete: A close button will be displayed in the top-right corner of the chart. Clicking on this will delete the chart.
Resizing: An outward arrow will be displayed, which can be used to resize the chart as required.
Renaming: Click on the pen icon next to the chart name to rename it.
Changing the color theme
You can customize the color of the series in charts to match your preferences.
Click on the required chart to change its color theme.
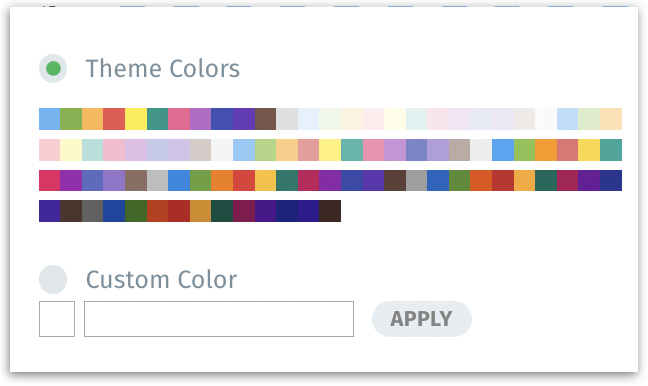
Under Theme Colors, you'll be presented with a default palette of theme colors, curated to complement your visualizations.
For specific color scheme, choose Custom Color and input the hex color code. Click on Apply for the color to be reflected in the chart.

Was this helpful?