Time taken to execute a query
Understand the time taken to execute a query with detailed breakdowns of Tellius and external engine processing to spot bottlenecks and improve performance.
It's common for users to encounter query execution time that is slower than expected. This lag can often be attributed to external resources rather than being a problem with Tellius. However, it's crucial to identify and understand the sources of such delays in order to effectively address them.
As a step to enhance transparency, we track and display the time spent by Tellius and other external data engines (such as Snowflake) to execute every query. With this, we provide a clear picture of performance metrics, which in turn assists users in identifying bottlenecks and aids in streamlining the troubleshooting process.

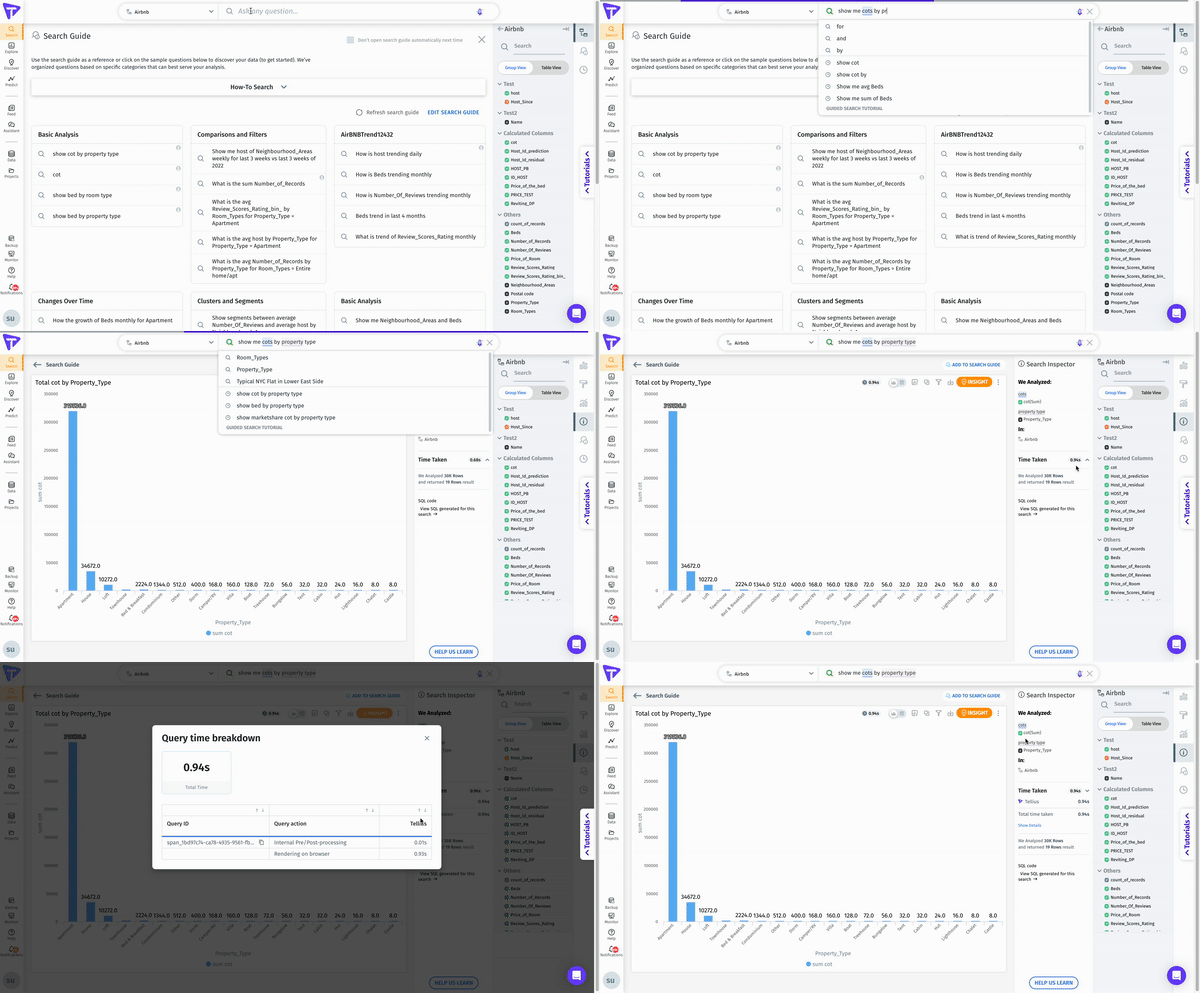
Following the execution of a query in Search and Vizpads, we provide a breakdown of the time taken by Tellius and any external resources to execute the query and load the corresponding chart. This detailed breakdown includes all stages of the process, including caching and execution.
For live resources, we display both the total time taken to execute a query and the breakdown of time spent by individual resources.
For non-live resources, we display the total time taken by Tellius to execute a query.
Exploring the components of Time Taken tab
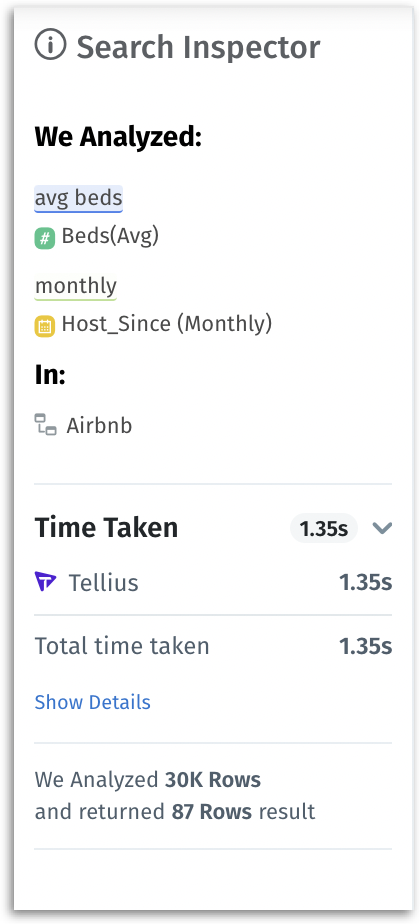
Upon executing a search query and visualizing the results, the time taken to execute the query will be displayed in the Search Inspector pane under Time Taken.
Click on the expand icon next to Time Taken to view the breakdown of the time taken.

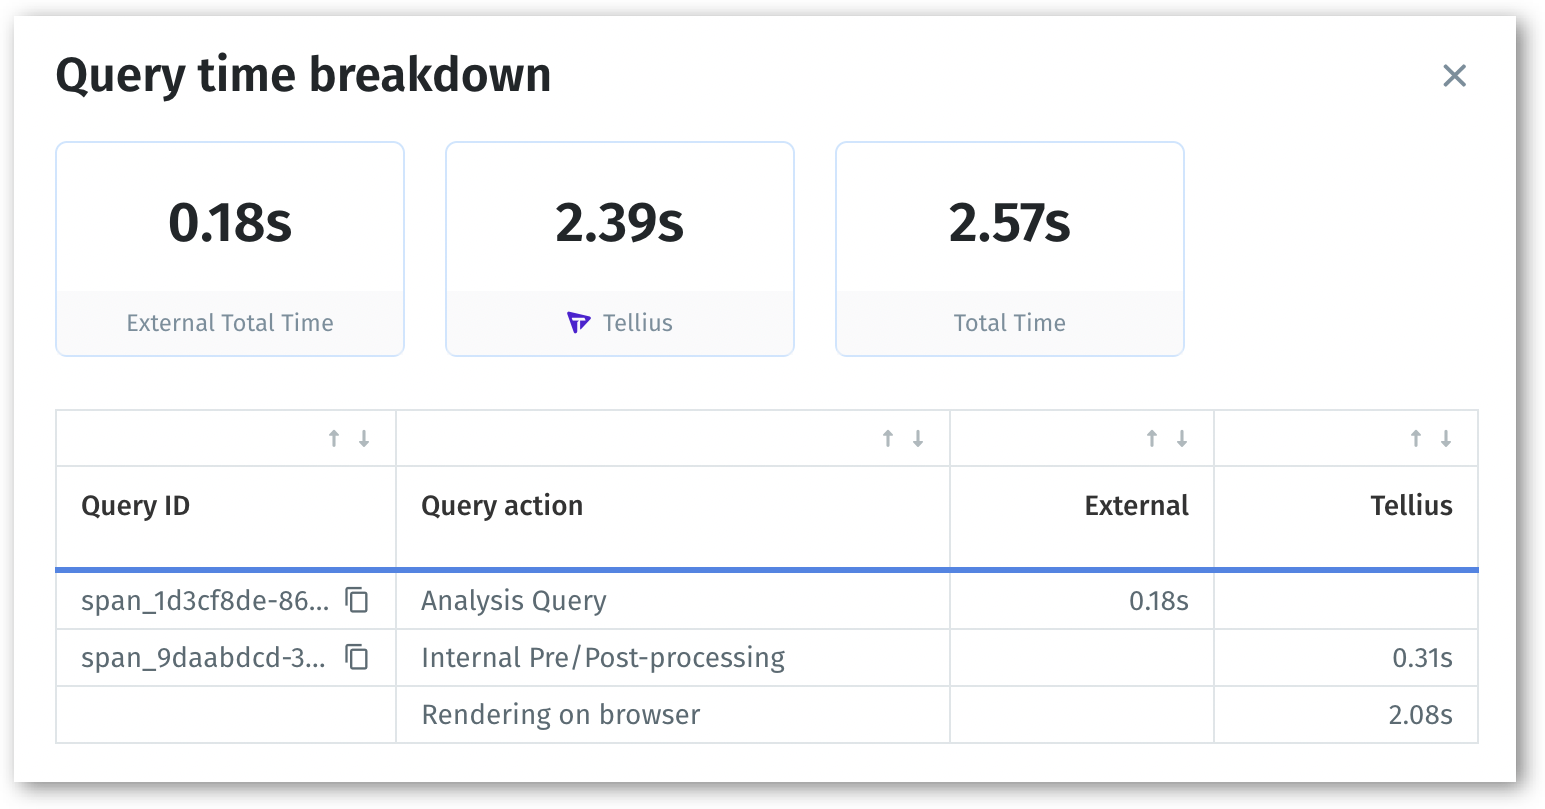
Click on Show Details to view the time taken by individual query (such as request, rendering, pre-processing etc.) in the Query time breakdown window. Each query's comprehensive details, including the ID, description, and the resource in which it was executed, will be displayed.

Understanding the breakdown details
In Tellius, multiple types of queries are utilized to extract, manipulate, and visualize your data. Each query has a specific purpose and contributes to a different aspect of the data analysis process.
In the Query time breakdown window, a table will be displayed with three columns: Query ID, Query action and the time taken to execute the query in Tellius or other external resources. For a detailed understanding, the description of every Query action is listed below:
Total count query
This query is executed to determine the total row count, which is essential in generating statistical insights. It helps you understand the overall volume of data within your dataset.
Max date query
This query is used to retrieve the most recent date within your dataset. It's critical for calculating relative time filters, allowing you to observe and analyze trends over specific periods.
Percentage calculation
This query calculates the denominator value for percentage or market share calculations. It's useful when you need to understand proportions or market dynamics in your data.
Top/bottom query
This query is used to identify the top or bottom 'N' values of a dimension in your dataset, typically in situations involving filters or sorting.
Cohort query
This query is used to calculate Cohort Totals or SubTotals, aiding in cohort analysis—which is a powerful tool for understanding customer behavior over time.
Internal pre/post-processing
This process involves preprocessing user inputs, generating queries for the data source, and post-processing query results—thereby ensuring accurate data analysis.
Rendering on browser
This process involves rendering the charts on the browser and managing the network bandwidth between the browser and the server, ensuring prompt display of your visualizations.
Was this helpful?