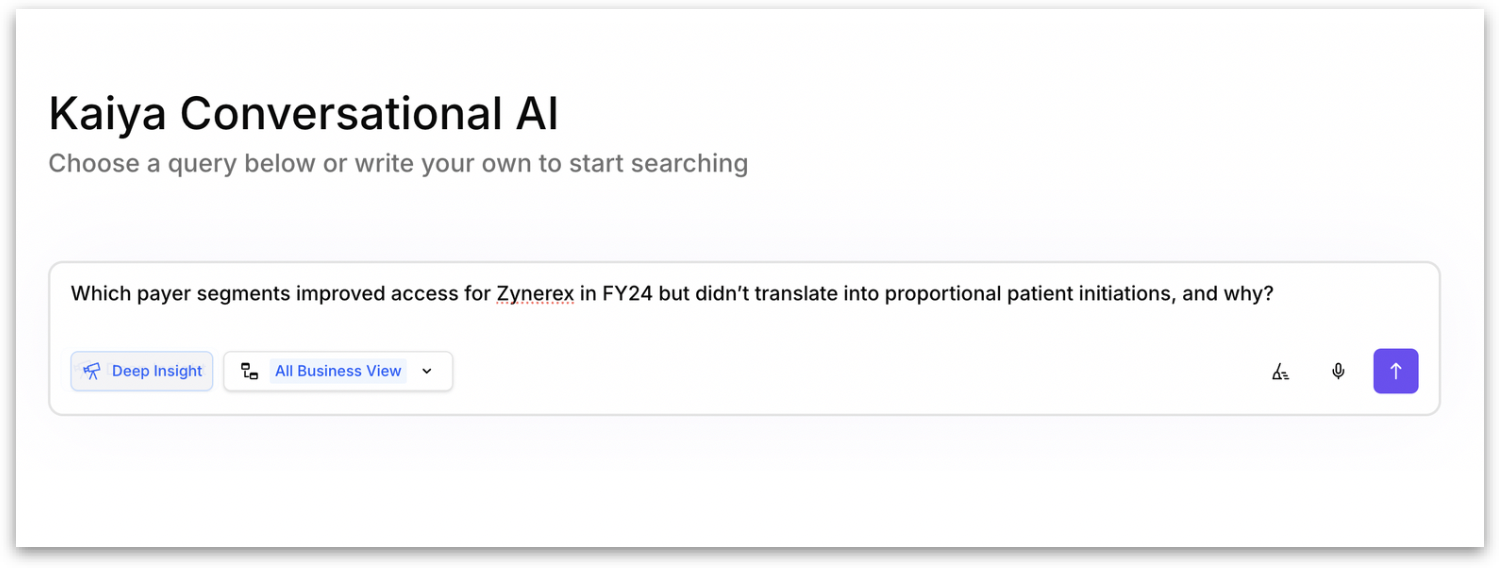
Deep Insight
Deep Insights activates Agent Mode, turning Kaiya into an AI analyst that plans, executes, and explains multi-step analysis from a single business question.
Agent Mode (activated by Deep Insights) turns Kaiya into an always-on AI Analyst that plans, executes, validates, and explains multi-step analysis from a single question. It combines the flexibility of agents with the consistency of workflows so you get 20× deeper insights and recommended next steps.

Go to Kaiya Conversational AI.
Click the Deep Insights button (left of the query bar).
Select your Business View from the dropdown. If you’re unsure about the required Business View, feel free to leave it at “All Business Views”.
Type your question and press Enter (or click on Submit).
From v6.1, you no longer need to manually click the Deep Insight button for applicable questions. Kaiya determines this on its own based on the complexity and nature of your query.
How Kaiya auto-routes your question (from v6.1)
Once Kaiya understands your question (including any clarifications you have provided), it automatically determines the best execution path to generate your answer. This routing happens behind the scenes through an orchestration layer, so you do not need to manually select a mode or specify how Kaiya should process your query.
Kaiya evaluates your question and the current conversation context, then routes it to one of the following execution paths:
SQL-only execution is used when the question can be answered by querying your data tables directly (using filters, joins, aggregations, group-bys, and other standard SQL operations). Most common analytical questions (such as "What were total sales by region last quarter?" or "Show me the top 10 products by revenue") are routed through this path.
SQL + Python-style processing is used when the question requires additional computation beyond what SQL can handle on its own. This includes statistical analysis, forecasting, clustering, custom business logic, advanced text handling, and more complex data transformations.
For example, "What is the forecasted TRx for Product X over the next 6 months?" would be routed through this path because it requires a forecasting model in addition to the underlying data query.
Deep Insights mode is used when the question calls for a multi-step, in-depth analytical exploration rather than a single query. Kaiya can now route to Deep Insights automatically when it detects that the question benefits from a structured plan of sub-analyses.
This automatic routing means you can focus on asking questions naturally. Kaiya handles the decision of how to process each question, reducing the friction of switching between modes or guessing which approach will produce the best result.
Who is it for?
Business users who want answers that go beyond chat (timing, magnitude, why, and what to do next).
Analysts who need repeatable deep dives without manual orchestration.
Data teams that require governed, audited execution across SQL and Python.
How Agent Mode works (at a glance)
A simple loop, Ask → Plan → Execute → Validate → Explain → Save, turns complex questions into governed, multi-step analysis. A multi-agent planner picks SQL or Python per step, applies transparent checks (samples, joins, fiscal calendar), then returns a clear narrative with next steps.
Plan
A multi-agent planner breaks the question into steps.
Chooses the right tools: SQL, Python, and visualization.
Applies sensible defaults and only asks brief clarifications when necessary.
Execute
SQL: Runs warehouse-native work—joins, subqueries, dynamic formulas, nested aggregations.
Python: Handles methods SQL can’t. Changepoints, contribution/variance with volume weighting, sample-size checks, cohorts/retention, correlation/association, causal probes, forecasting with intervals, segmentation/clustering.
Validate & Reflect
Checks whether each group has a big enough sample so results aren’t noisy.
Prevents bad joins that duplicate rows (fan-out/chasm traps).
Keeps the join at the correct grain so numbers add up.
Uses your fiscal calendar so results respect your business timeline.
Explain
Delivers timing and magnitude, ranked drivers, and relevant charts/tables.
Includes concise recommended next steps.
Example walk-through
Consider this question: “How did cancellation rate change week-over-week in Q3, and which regions/products/channels contributed most to the WoW delta?”

Step 0: Ask You ask the question in plain English. If a detail is missing (e.g., fiscal vs. calendar weeks), Kaiya asks clarification once, then proceeds.
Step 1: Build the baseline Kaiya pulls governed data at weekly grain for Q3, honoring row-level policies and your fiscal calendar. It computes the conversion rate series and applies obvious filters (e.g., exclude tests). Outputs are audited and preview-able so you can confirm scope.
Step 2: Create analysis slices Kaiya enriches the baseline with Region / Product / Channel via governed joins. It generates only the slices relevant to the question to avoid fan-out and noise. Sample sufficiency and grain consistency checks ensure stability.
Step 3: Apply the best method Based on intent (“why + drivers”), Kaiya runs variance/contribution analysis and changepoint detection; routes heavy work to SQL and advanced methods to Python. Guardrails enforce sensible defaults and minimum samples; confidence cues are added where possible. You get a ranked, interpretable driver table aligned to the question.
Step 4: Validate & reflect Kaiya verifies enough data, correct join grain, no double counting, and correct week mapping. All defaults used are disclosed; if something looks off, it adjusts filters/grain/method and reruns the affected step.
Step 5: Explain & package You receive a plain-English narrative with timing & magnitude of the drop, ranked drivers by region/product/channel, clear visuals, and recommended next steps (e.g., staffing fix, promo tweak). All assumptions, steps, and artifacts are disclosed for auditability; you can save this run as a reusable workflow.
Supported data sources for Agent Mode and Text-to-SQL: Snowflake, Redshift, ClickHouse. Spark is not yet supported. Please migrate critical datasets to a supported warehouse for these features.
Last updated
Was this helpful?