> For the complete documentation index, see [llms.txt](https://help.tellius.com/llms.txt). Markdown versions of documentation pages are available by appending `.md` to page URLs; this page is available as [Markdown](https://help.tellius.com/vizpads-explore/time-taken-to-load-a-chart/vizpad-level.md).
# Vizpad level
For both **View** and **Edit** modes, Tellius displays the time taken by Tellius and external resources to execute the query and load every chart in a Vizpad.
### **View mode**
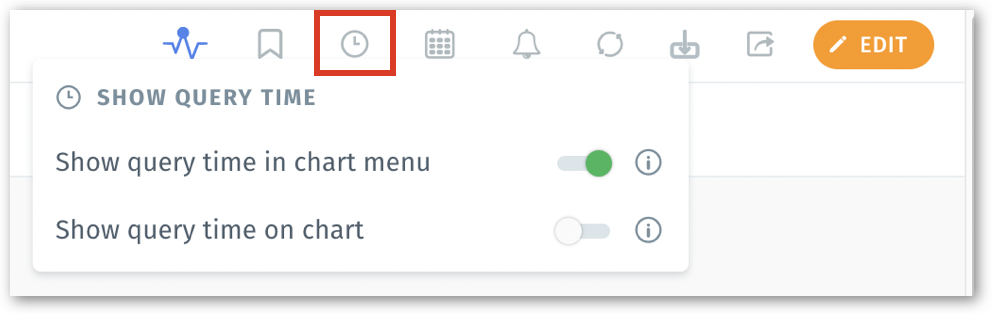
In the **View** mode of a Vizpad, click on the timer icon to turn on/off the query execution time. The following **Show Query Time** menu will be displayed.
Show query time menu in View mode
### **Edit mode**
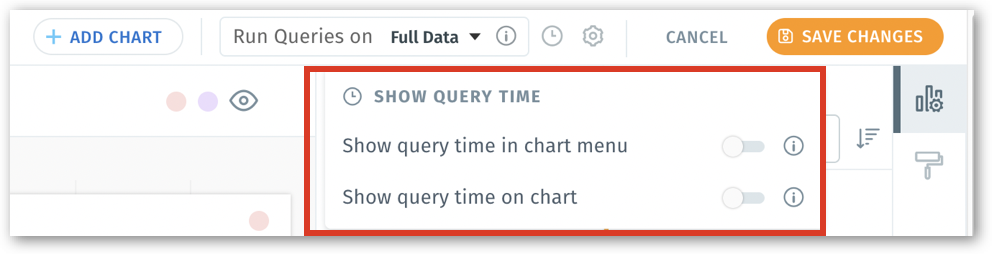
When editing a Vizpad, the query loading time can be enabled/disabled by clicking on the timer icon placed between **Run Queries on** and **Settings** at the top right corner.
Show query time menu in Edit mode
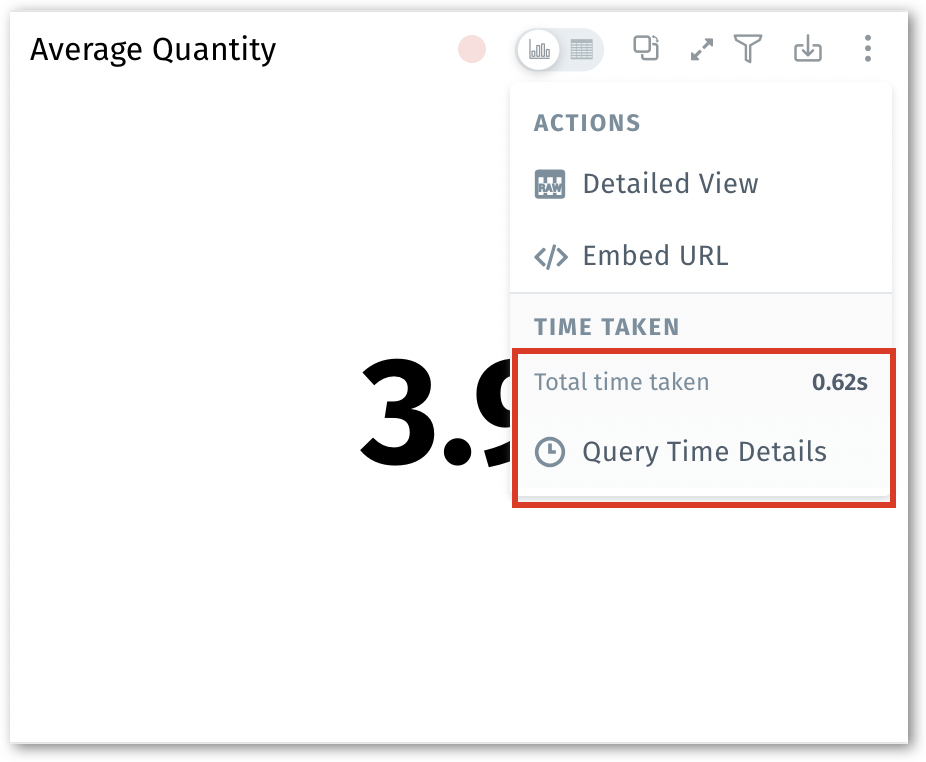
1. If **Show query time in chart menu** is enabled, then the details of the total time taken to execute a query will be displayed in the three-dot kebab menu of every chart.
Display of query time in a chart menu
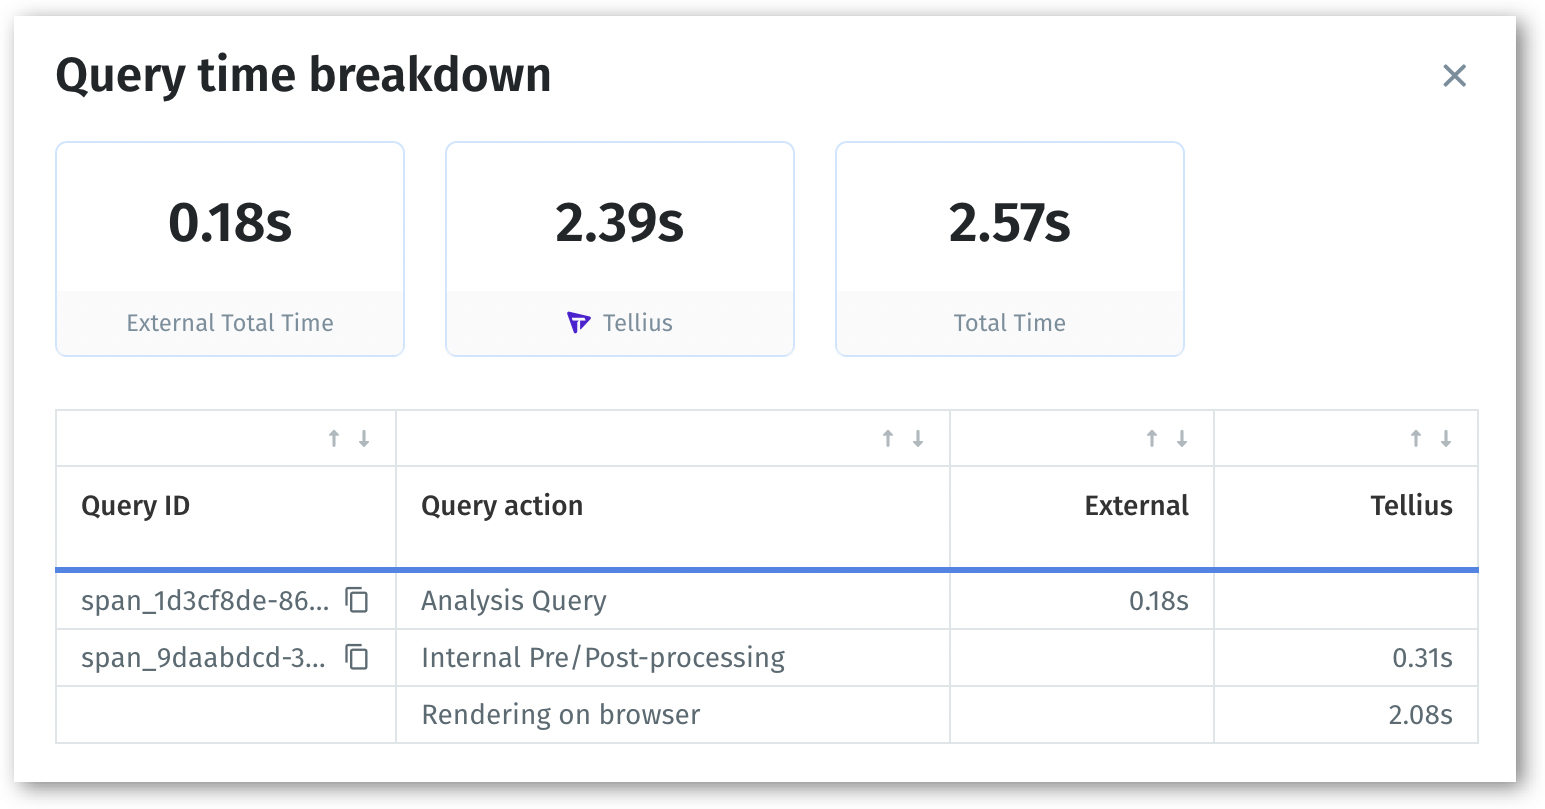
2. Click on the **Query Time Details** to view the breakdown of the query executed. Each query's comprehensive details, including the ID, description, and the resource in which it was executed, will be displayed.
Query time breakdown
3. If **Show query time in chart menu** is disabled, then the query time will not be displayed as a part of the chart's menu.
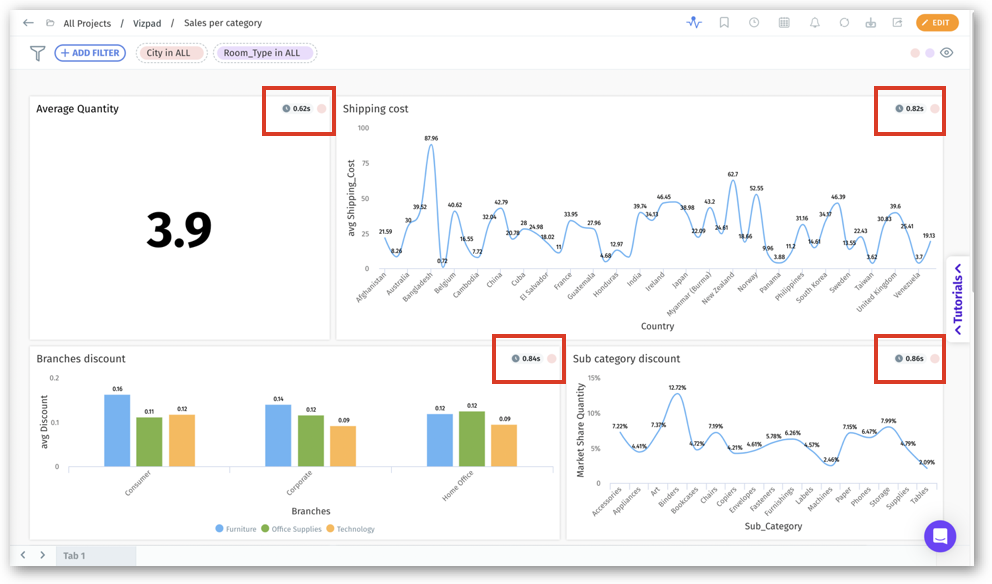
4. If **Show query time on chart** is enabled by the admins on a Vizpad, then the details of the time taken to execute a query will be displayed on the top right corner of every chart (in the form of a pill). This helps in providing a quick, holistic overview of the time taken to load each chart in a Vizpad.
Query time displayed in every chart
{% hint style="info" %}
While **Show query time in chart menu** is available for all users, **Show query time on chart** is available only to admins.
{% endhint %}
5. Click on the time pill to view the breakdown of the time taken to load the query breakdown. Each query's comprehensive details, including the ID, description, and the resource in which it was executed, will be displayed.
Query time breakdown
6. If the **Show query time on chart** toggle is disabled, then the details of the time taken to execute a query will not be displayed on every chart.
{% hint style="warning" %}
Please note that any changes made to the display of the query time in View mode will be reflected in the Edit mode and vice versa.\
\
For example, if **Show query time in chart menu** toggle is disabled in the **View** mode, then the **Show query time** toggle will be disabled for every individual charts in **Edit** mode by default.\
\
Similarly, if **Show query time** toggle is enabled for an individual chart in **Edit** mode, then **Total time taken** will be displayed in the three-dot menu for that particular chart in **View** mode.
{% endhint %}
---
# Agent Instructions
This documentation is published with GitBook. GitBook is the documentation platform designed so that both humans and AI agents can read, navigate, and reason over technical content effectively. Learn more at gitbook.com.
## Querying This Documentation
If you need additional information that is not directly available in this page, you can query the documentation dynamically by asking a question.
Perform an HTTP GET request on the current page URL with the `ask` query parameter, and the optional `goal` query parameter:
```
GET https://help.tellius.com/vizpads-explore/time-taken-to-load-a-chart/vizpad-level.md?ask=&goal=
```
`ask` is the immediate question: it should be specific, self-contained, and written in natural language.
`goal` is optional and describes the broader end goal you are ultimately trying to accomplish on behalf of the user. GitBook uses it to tailor the answer towards what is most useful for that goal.
The response will contain a direct answer to the question and relevant excerpts and sources from the documentation.
Use this mechanism when the answer is not explicitly present in the current page, you need clarification or additional context, or you want to retrieve related documentation sections.