Interacting with the resulting chart
Leverage the full potential of resulting charts
Last updated
Was this helpful?
Leverage the full potential of resulting charts
Last updated
Was this helpful?
A suite of icons located at the top right corner of every chart helps you dive deeper into the chart and interact with the results. Users can directly build Vizpads or Insights from the charts with the help of these actionable icons.
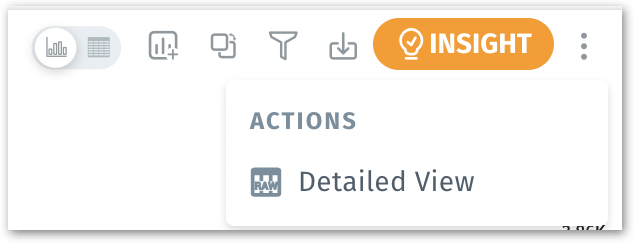
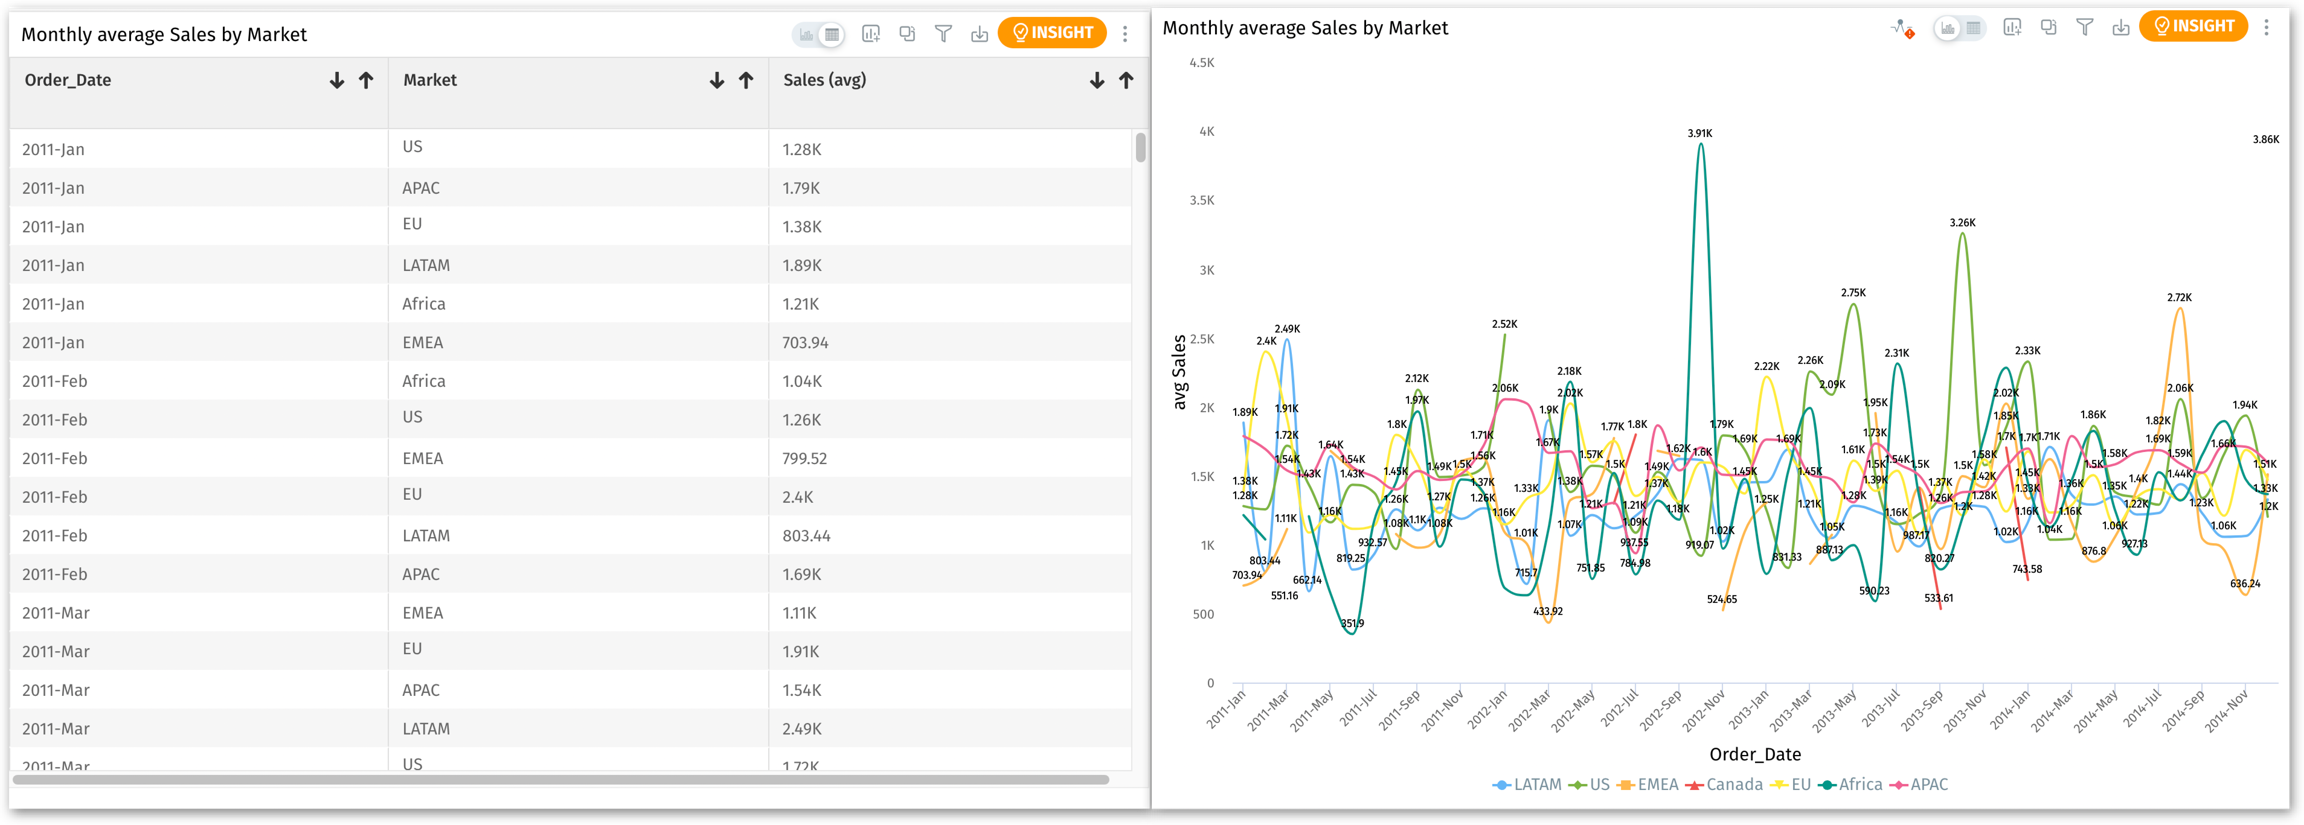
Click on this icon to switch between the visual chart representation and its underlying table data.
Alternatively, click on the three-dot menu and select "Detailed View". This will present the chart data in a tabular format.
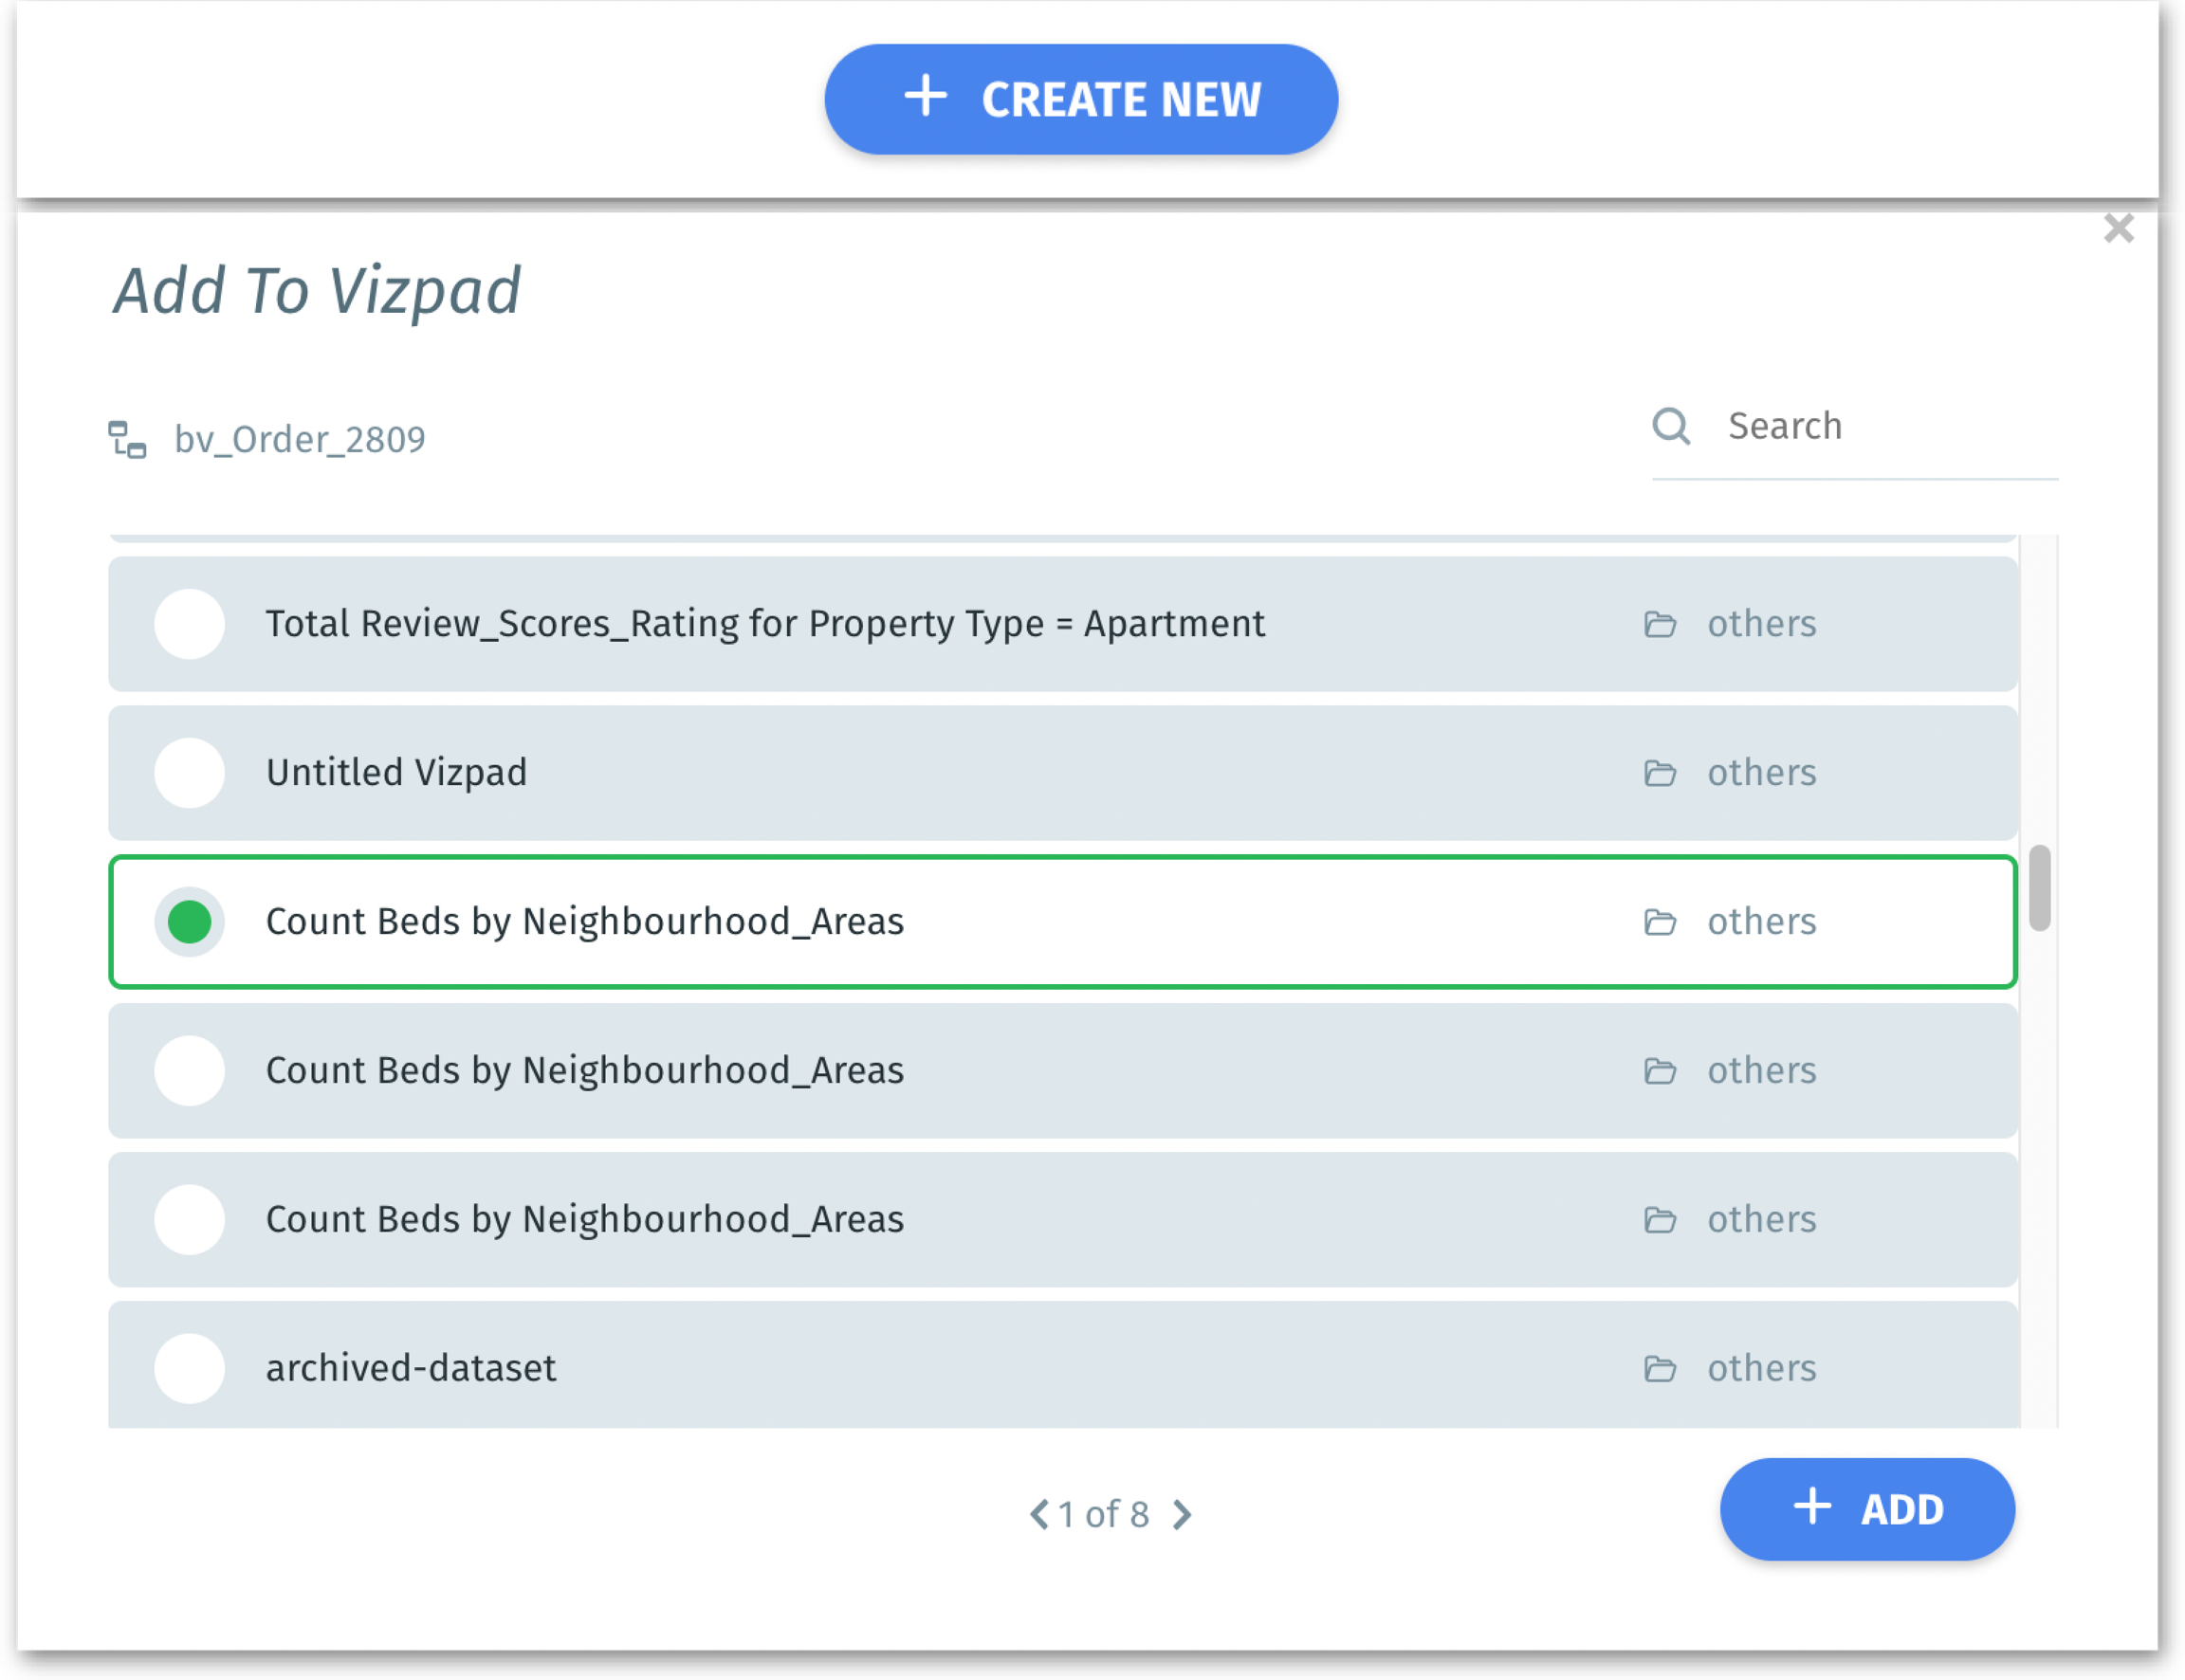
The resulting chart can be incorporated into a Vizpad.
You can either select an existing Vizpad or opt to create a new one.
Once a new Vizpad is created and the chart is added, a prompt window will be displayed asking if you want to go to the new Vizpad. Choose "Yes" to proceed immediately, or "No" if you wish to stay on the current page.
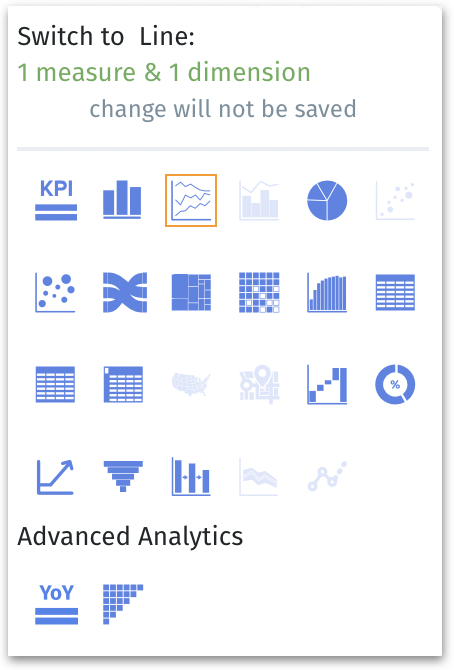
Click on this icon and the available chart types will be displayed. The charts that are incompatible will be greyed out automatically.
The existing chart will be converted to the selected chart type, where all current values and filters will remain applied.
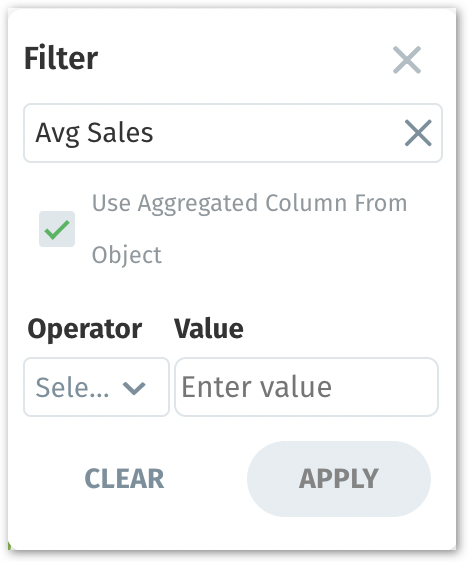
The option "Use aggregated column from object" allows you to filter using data aggregated at a higher level. This is beneficial when analyzing broader trends or patterns.
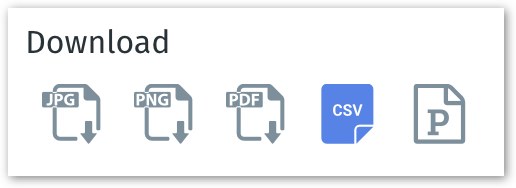
Click on the download icon to download the current chart.
Select the preferred format (JPG, PNG, PDF, CSV or PPT) in which the chart needs to be downloaded.
Click on Insight to generate Insights directly from the chart.
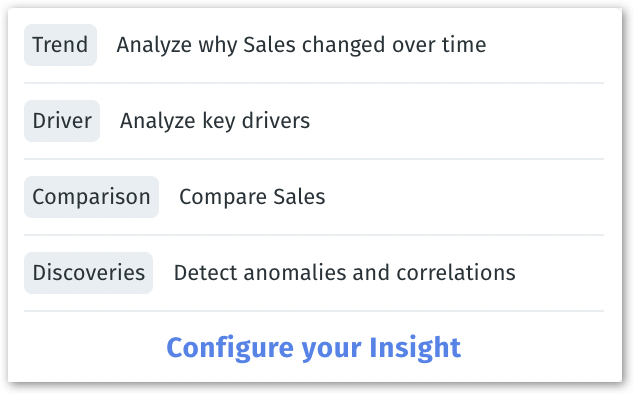
Various Insight types (Trend, Driver, Comparison, Discovery) with a relevant example for each will be displayed.
Select a sample Insight to get started or choose "Configure your Insight" to start a new one.
In the Insight configuration window, follow the prompts to tailor your Insight as needed.
To apply filters, click on the funnel icon. For more details on applying filters, check out .