Understanding search results
Explore Tellius Search results with guided insights, smart visualizations, query inspectors, formatting tools, and advanced analytics to refine and analyze your data.
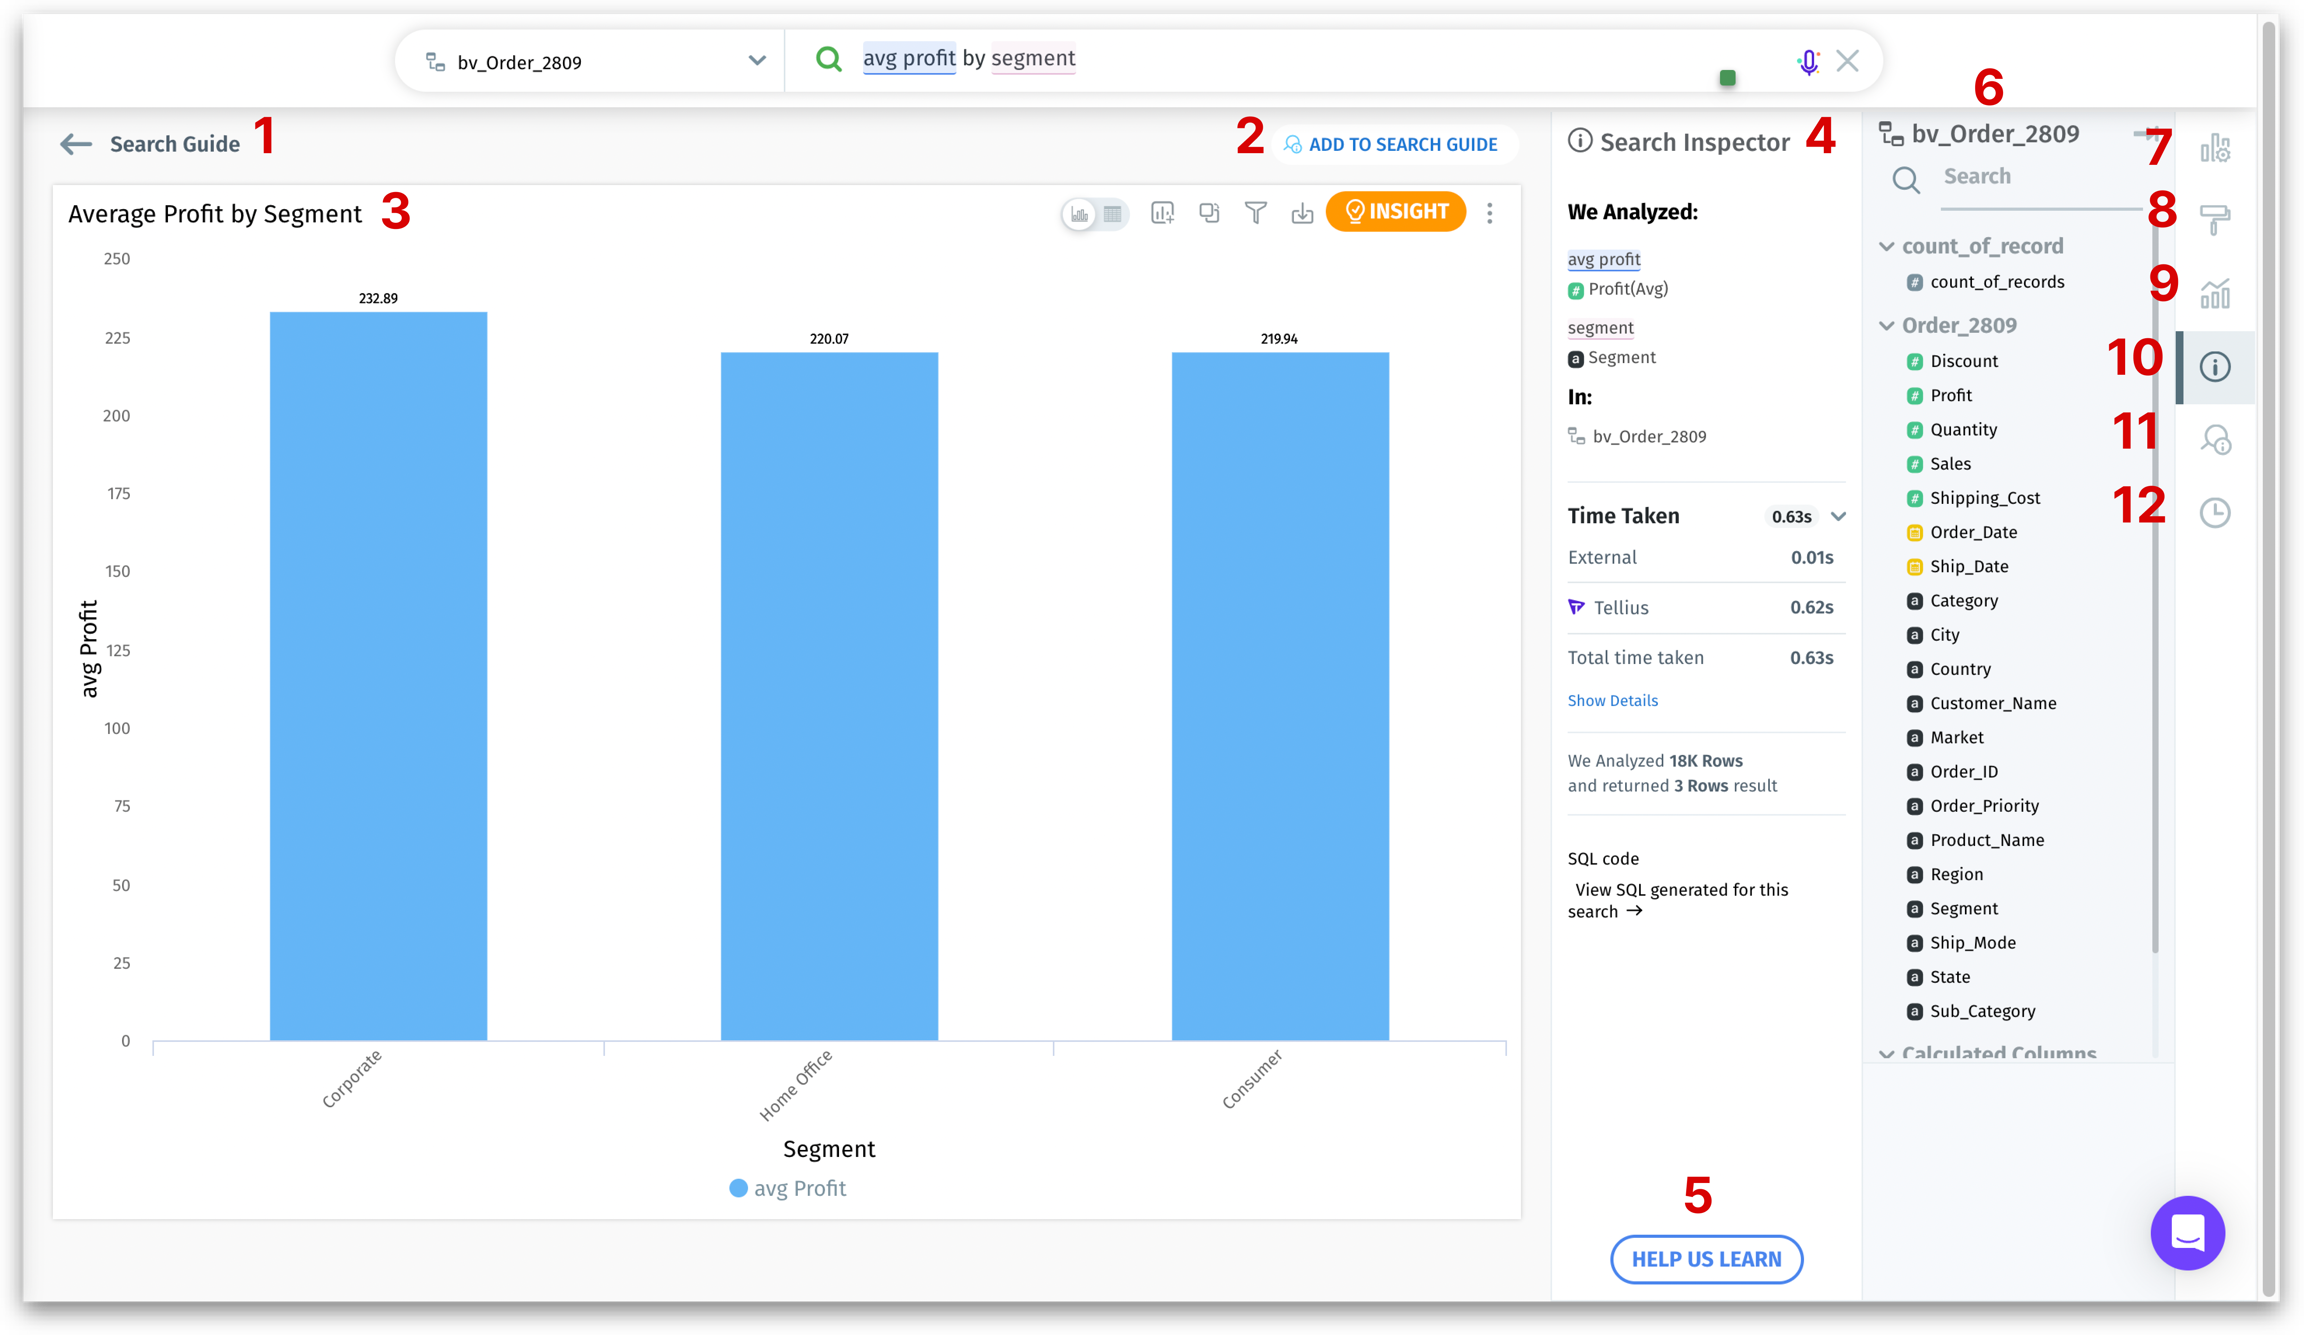
As you enter a query in Tellius, the system immediately begins displaying relevant results. The results screen is composed of several interactive elements, each designed to enhance your search experience and data visualization.

Search Guide
Click on this option to access the Search Guide. It's a helpful resource to refer back to while executing search queries.
Add to Search Guide
If you find a query particularly useful, you can add it to the Search Guide for future reference. Click on this button and you will be redirected to the Search Guide. Select the appropriate category for your query, and save your changes. Alternatively, cancel if you decide not to add it.

Search results canvas
This area displays your search results. Tellius intelligently selects the most suitable chart type for visualizing your data and provides actionable buttons at the top right corner for further analyses.
Search Inspector
Here, you can view the details of your executed query, including the columns analyzed, the Business View used, the time taken to execute a query, and the SQL code generated from the query.
Help us Learn
If the search results don’t align with your expectations, use this feature to guide Tellius in better understanding how to segment your query.
Business View Panel
The panel displays the columns in the Business View for easy identification for constructing/analyzing the query elements.
Settings
The configuration details of the chart will be displayed here, comprising multiple fields. You can add columns from the Business View panel to these fields, allowing you to tailor the visualization according to your needs.
Formatting
Enhance your chart with various formatting options, such as number formatting, conditional formatting, and customizing data labels, color palettes, chart titles, legends, and background colors.
Advanced Analytics
Explore advanced analysis options like benchmarking and setting Y-axis target lines to deepen your data exploration.
Search Query Inspector
Same as Search Inspector (#4). Click here to display the Search Query Inspector. This panel will be displayed by default next to the Business View panel once the query is executed.
Search Guide
Click here to quickly refer to the guide and execute queries from the curated list. The list of categories will be displayed. Click on each category to show/hide the associated queries. Click on any required query to execute it.

Please note that clicking on the Search Guide option in the right pane will display the Search Guide queries in the adjacent panel while keeping the search results intact. However, clicking on the Search Guide (listed #1) will remove the results and move back to the Search Guide.
Search History
Displays the list of search queries executed for a specific date range. Customize the date range and Business View to suit your requirements.
Was this helpful?