Setting up moving calculation
Set up moving calculations to create rolling averages, running totals, and change metrics directly in Vizpads for dynamic, time-based analysis.
These four table-level calculations turn any metric into a clear rolling or cumulative signal—directly in Vizpads, without extra formulas or duplicate Business Views. Pick the option that matches your question, set the window and time order, and Tellius does the rest (even when data has gaps).
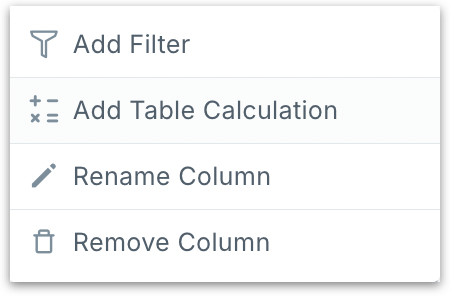
In a Vizpad, click on the three dot menu and choose Add Table Calculation.

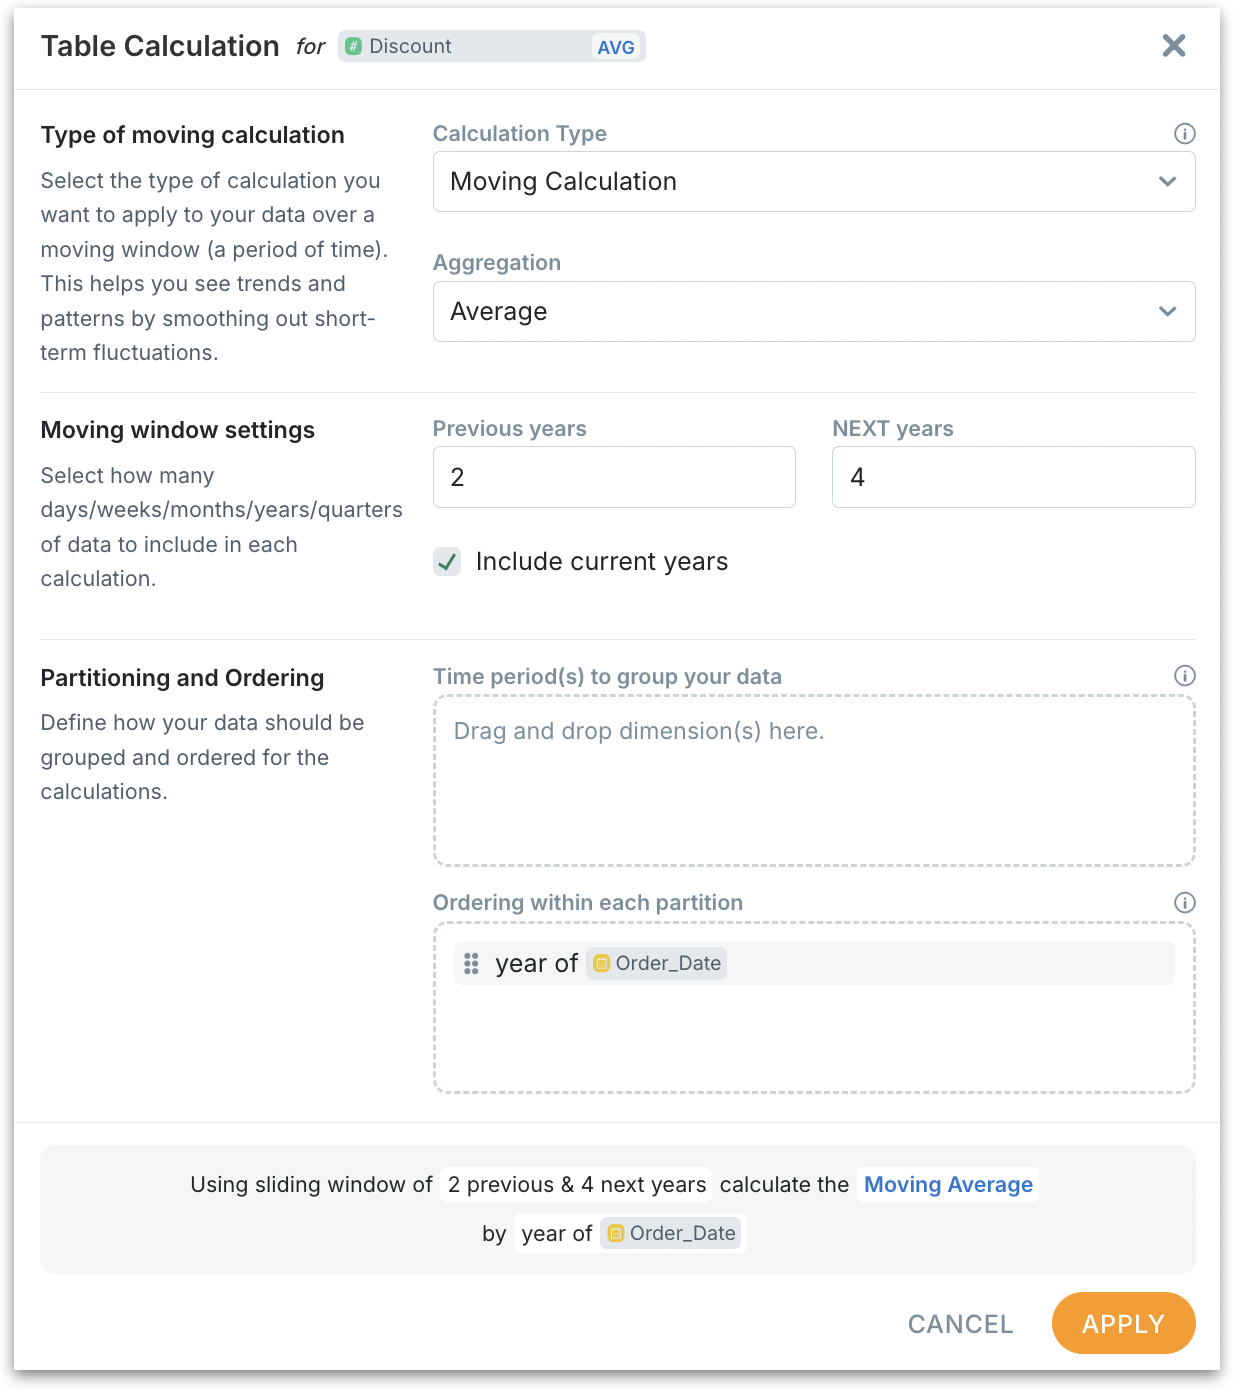
The following window will be displayed.

Moving Calculation
Returns the windowed value (average or sum) at every step.
Type of moving calculation
Calculation Type: Choose Moving Calculation from the dropdown.
Aggregation: Select how values need to be combined inside each window before any comparison (Average, Sum, Minimum and Maximum). Example: With Average and a 2-year window, the moving value is the average over those two years.
Moving window settings
Specify the size of the rolling window. The unit follows your time ordering (see Ordering below). For example, if you order by year of Order_Date, the window is in years. If you order by month of Order_Date, the window is in months etc.
Include current years (checkbox): Select if you want to include the current period in the calculation. Disable for closed-period reporting.
Previous years and Next years: Define how many periods before/after the current position should be included in the window. Example: With Include current years = ON, Previous = 2, Next = 4, the window spans 7 years.
Partitioning and Ordering
Time period(s) to group your data (Partitioning): Drag dimensions here to compute separate series per group. Splits your data into independent “tracks.” Each track gets its own rolling/cumulative math; windows never mix across tracks.
Partition by Region → each Region gets its own rolling/cumulative series. One series per Region (North, South, …). A spike in North doesn’t affect South’s window.
Partition by Region, Product → independent series per Region–Product pair. One series per Region–Product pair (South–Shoes, South–Bags, …).
Leave empty to compute a single global series across the entire table.
Ordering within each partition (Ordering): Drop the time field that defines the sequence (e.g., year of Order_Date). Without a valid time order, moving/running math has no timeline.
Drop one time field, e.g.,
year of Order_Date,month of Order_Date, orweek of Visit_Date.Ascending (chronological) sort is required. Custom/alphabetical sorts produce incorrect windows.
The window unit comes from this field: year → years, month → months, week → weeks.
Order by the grain that matches your question. MoM trends → month; WoW ops → week; YoY smoothing → year. If you order by month but read it as weekly, results won’t match expectations.
If there are multiple date columns in the dataset, pick the one that matches the metric’s logic (e.g.,
Order_Datefor sales,Ship_Datefor logistics). The date you place in Ordering is the one that controls the window; others are ignored for sequencing.
Before clicking on Apply button, make sure the following are implemented:
Partition lists the exact groups you want to compute separately.
Ordering has a single time field, sorted ascending.
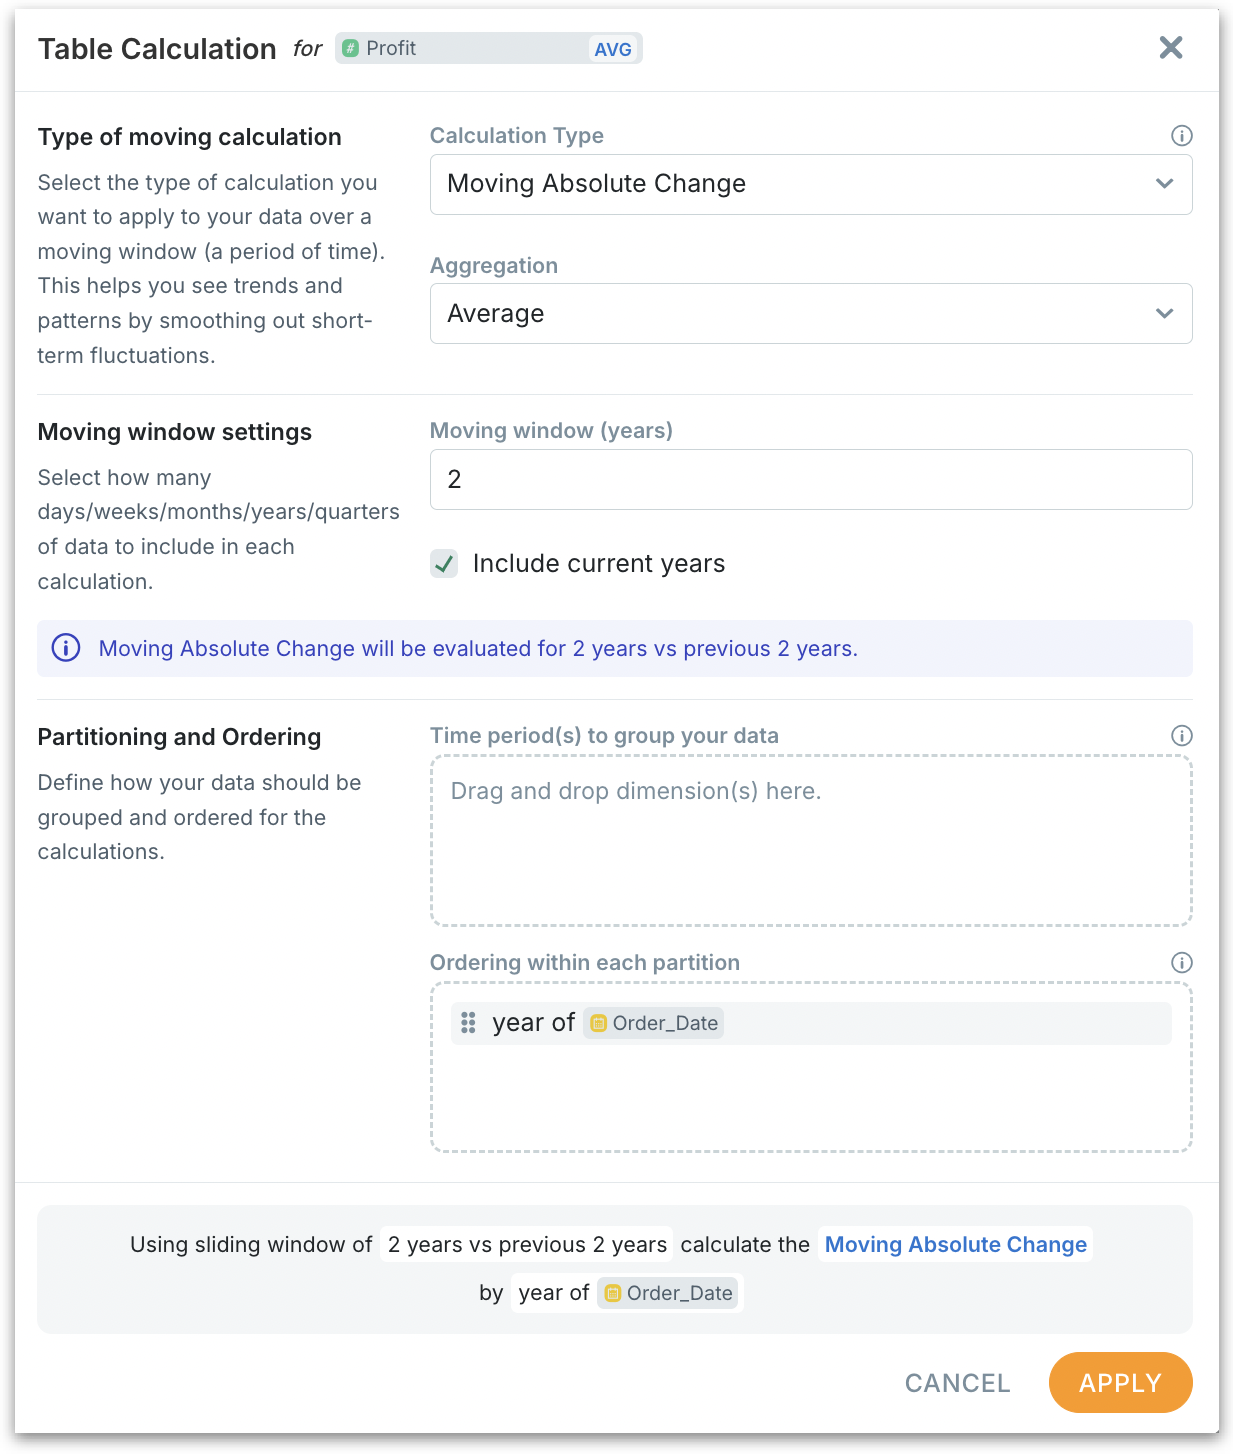
The preview sentence shows the correct unit and window (e.g., “13 weeks” or “2 years vs previous 2 years”).
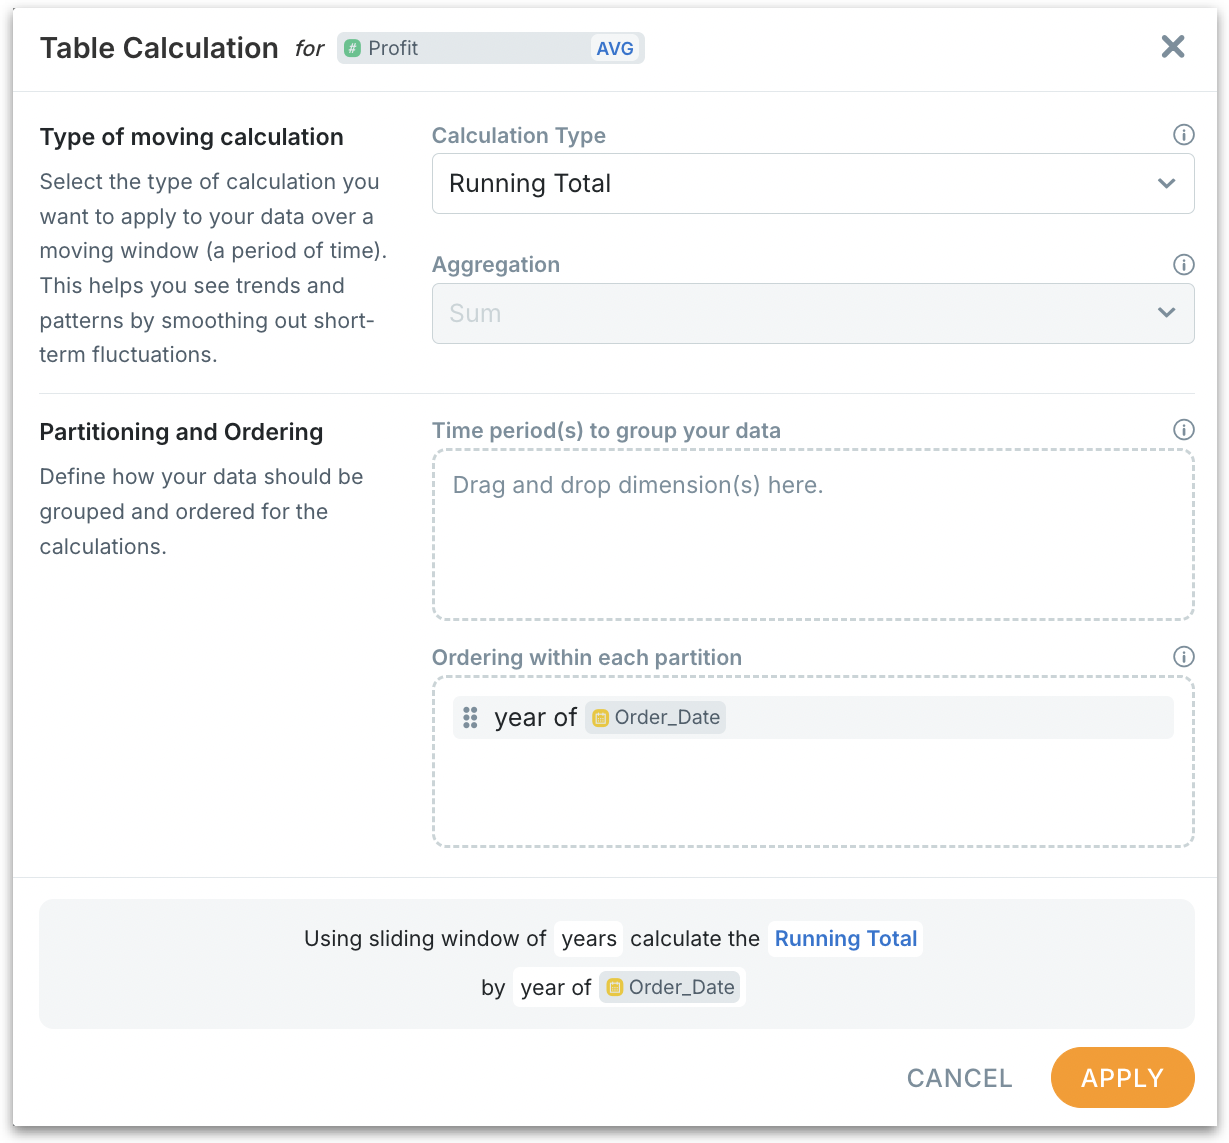
Running Total
The Running Total calculation returns a cumulative sum of a measure from the first ordered period up to the current period within each partition.

Configuration is the same as moving calculation except there won't be Moving window settings. Running Total is cumulative by design—its “window” is implicitly from the first ordered period up to the current one inside each partition. That’s why there are no moving-window fields (no Previous/Next or Moving window (…)). The only thing you specify is the time order (e.g., year of Order_Date) and optional partitions (where the cumulative resets).
If a period is missing (no rows) or the measure is null/zero, the total simply carries forward unchanged—no increment, no reset. Accumulation resumes at the next period that has data.
Moving % change and absolute change
Moving Percentage Change compares the aggregated value over a current sliding window to the immediately previous window of the same size, then expresses the difference as a percentage. Uses the formula:

Moving Absolute Change does the same comparison, reported as a raw difference. Uses the formula:
Moving Percentage/Absolute Change calculations only include a "Moving window (years)" field and do not display "Previous years" and "Next years" fields since those two calculations always compare two back-to-back windows of the same size:
Current window: the last N periods (N = “Moving window”), including the current period if Include current is ON.
Previous window: the N periods immediately before the current window.
Because the windows are fixed to this “current vs previous” pattern, there's no need to configure about “how many previous” or “how many next” periods—the only control you need is the window length (N). That’s why the window shows a single Moving window field.
Example (Ordering = year of Order_Date, Moving window = 2, Include current = ON, at 2024):
Current window = 2023–2024
Previous window = 2021–2022
For these two calculations, our fallback logic ensures that if data from the previous window is missing, Tellius substitutes a valid window from an earlier time period. For example, if you want to see your company's 3-year average profit ending in 2024, ideally you use 2022, 2023, 2024 data. If 2023 is missing, Tellius automatically uses 2021, 2022, 2024 data instead, giving you meaningful results even when your data has gaps.
Was this helpful?