Tellius
  • ๐ŸšฉGetting Started
    • ๐Ÿ‘‹Say Hello to Tellius
      • Glossary
      • Tellius 101
      • Navigating around Tellius
      • Guided tours for quick onboarding
    • โšกQuick Start Guides
      • Search
      • Vizpads (Explore)
      • Insights (Discover)
    • โœ…Best Practices
      • Search
      • Vizpads (Explore)
      • Insights (Discover)
      • Predict
      • Data
    • โฌ‡๏ธInitial Setup
      • Tellius architecture
      • System requirements
      • Installation steps for Tellius
      • Customizing Tellius
    • Universal Search
    • ๐Ÿ Tellius Home Page
  • Kaiya
    • โ™Ÿ๏ธUnderstanding AI Agents & Agentic Flows
      • Glossary
      • Composer
      • ๐Ÿ—๏ธTriggering an agentic workflow
      • The art of possible
      • Setting up LLM for Kaiya
    • ๐ŸคนKaiya conversational AI
      • โ“FAQs on Kaiya Conversations
      • Triggering Insights with "Why" questions
      • Mastering Kaiya conversational AI
  • ๐Ÿ”Search
    • ๐Ÿ‘‹Get familiar with our Search interface
    • ๐Ÿค”Understanding Tellius Search
    • ๐Ÿ“Search Guide
    • ๐Ÿš€Executing a search query
      • Selecting a Business View
      • Typing a search query
      • Constructing effective search queries
      • Marketshare queries
    • ๐Ÿ”‘Analyzing search results
      • Understanding search results
      • Search Inspector
      • Time taken to execute a query
      • Interacting with the resulting chart
    • ๐Ÿ“ŠKnow your charts in Tellius
      • Understanding Tellius charts
      • Variations of a chart type
      • Building charts from Configuration pane
      • List of chart-specific fields
      • Adding columns to fields in Configuration pane
      • Absolute and percentage change aggregations
      • Requirements of charts
      • Switching to another chart
      • Formatting charts
      • Advanced Analytics
      • Cumulative line chart
    • ๐Ÿง‘โ€๐ŸซHelp Tellius learn
    • ๐Ÿ•ต๏ธโ€โ™‚๏ธSearch history
    • ๐ŸŽ™๏ธVoice-driven search
    • ๐Ÿ”ดLive Query mode
  • ๐Ÿ“ˆVizpads (Explore)
    • ๐Ÿ™‹Meet Vizpads!
    • ๐Ÿ‘‹Get familiar with our Vizpads
    • #๏ธโƒฃMeasures, dimensions, date columns
    • โœจCreating Vizpads
    • ๐ŸŒApplying global filters
      • Filters in multi-BV Vizpads
      • Filters using common columns
    • ๐Ÿ“ŒApplying local filters
    • ๐Ÿ“…Date picker in filters
      • Customizing the calendar view
    • โœ…Control filters
      • Multi-select list
      • Single-select list
      • Range slider
      • Dropdown list
    • ๐Ÿ‘๏ธActions in View mode
      • Interacting with the charts
    • ๐Ÿ“Actions in Edit mode
      • ๐Ÿ—จ๏ธViz-level actions
    • ๐Ÿ”งAnomaly management for line charts
      • Instance level
      • Vizpad level
      • Chart level
    • โณTime taken to load a chart
      • Instance level
      • Vizpad level
      • Chart level
    • โ™Ÿ๏ธWorking with sample datasets
    • ๐Ÿ”Swapping Business View of charts
      • Swapping only the current Vizpad
      • Swapping multiple objects
      • Configuring the time of swap
    • ๐Ÿค–Explainable AI charts
  • ๐Ÿ’กInsights (Discover)
    • ๐Ÿ‘‹Get familiar with our Insights
    • โ“Understanding the types of Insights
    • ๐Ÿ•ต๏ธโ€โ™‚๏ธDiscovery Insights
    • โž•How to create new Insights
      • ๐Ÿ”›Creating Discovery Insight
      • ๐Ÿ”‘Creating Key Driver Insights
      • ใ€ฐ๏ธCreating Trend Insights
      • ๐Ÿ‘ฏCreating Comparison Insights
    • ๐ŸงฎThe art of selecting columns for Insights
      • โžก๏ธHow to include/exclude columns?
  • ๐Ÿ”ขData
    • ๐Ÿ‘‹Get familiar with our Data module
    • ๐Ÿฅ‚Connect
    • ๐ŸชนCreate new datasource
      • Connecting to Oracle database
      • Connecting to MySQL database
      • Connecting to MS SQL database
      • Connecting to Postgres SQL database
      • Connecting to Teradata
      • Connecting to Redshift
      • Connecting to Hive
      • Connecting to Azure Blob Storage
      • Connecting to Spark SQL
      • Connecting to generic JDBC
      • Connecting to Salesforce
      • Connecting to Google cloud SQL
        • Connecting to a PostgreSQL cloud SQL instance
        • Connecting to an MSSQL cloud SQL instance
        • Connecting to a MySQL Cloud SQL Instance
      • Connecting to Amazon S3
      • Connecting to Google BigQuery
        • Steps to connect to a Google BigQuery database
      • Connecting to Snowflake
        • OAuth support for Snowflake
        • Integrating Snowflake with Azure AD via OAuth
        • Integrating Snowflake with Okta via OAuth
        • Azure PrivateLink
        • AWS PrivateLink
        • Best practices
      • Connecting to Databricks
      • Connecting to Databricks Delta Lake
      • Connecting to an AlloyDB Cluster
      • Connecting to HDFS
      • Connecting to Looker SQL Interface
      • Loading Excel sheets
      • ๐ŸšงUnderstanding partitioning your data
    • โณTime-to-Live (TTL) and Caching
    • ๐ŸŒทRefreshing a datasource
    • ๐ŸชบManaging your datasets
      • Swapping datasources
    • ๐ŸฃPreparing your datasets
      • ๐ŸคพActions that can be done on a dataset
      • Data Pipeline
      • SQL code snippets
      • โœ๏ธWriteback window
      • ๐ŸงฉEditing Prepare โ†’ Data
      • Handling null or mismatched values
      • Metadata view
      • List of icons and their actions
        • Functions
        • SQL Transform
        • Python Transform
        • Standard Aggregation
        • Creating Hierarchies
      • Dataset Scripting
      • Fusioning your datasets
      • Scheduling refresh for datasets
    • ๐ŸฅPreparing your Business Views
      • ๐ŸŒŸCreate a new Business View
      • Creating calculated columns
      • Creating dynamic parameters
      • Scheduling refresh for Business Views
      • Setting up custom calendars
    • Tellius Engine: Comparison of In-Memory vs. Live Mode
  • Feed
    • ๐Ÿ“ฉWhat is a Feed in Tellius?
    • โ—Alerts on the detection of anomalies
    • ๐Ÿ“ฅViewing and deleting metrics
    • ๐Ÿ–ฒ๏ธTrack a new metric
  • Assistant
    • ๐Ÿ’Introducing Tellius Assistant
    • ๐ŸŽคVoice-based Assistant
    • ๐Ÿ’ฌInteracting with Assistant
    • โ†–๏ธSelecting Business View
  • Embedding Tellius
    • What you should know before embedding
    • Embedding URL
      • ๐Ÿ“ŠEmbedding Vizpads
        • Apply and delete filters
        • Vizpad-related actionTypes
        • Edit, save, and share a Vizpad
        • Keep, remove, drill sections
        • Adding a Viz to a Vizpad
        • Row-level policy filters
      • ๐Ÿ’กEmbedding Insights
        • Creating and Viewing Insights
      • ๐Ÿ”ŽEmbedding Search
        • Search query execution
      • Embedding Assistant
      • ๐Ÿช„Embedding Kaiya
      • Embedding Feed
  • API
    • Insights APIs
    • Search APIs
    • Authentication API (Login API)
  • โœจWhat's New
    • Release 5.4
      • Patch 5.4.0.x
    • Release 5.3
      • Patch 5.3.1
      • Patch 5.3.2
      • Patch 5.3.3
    • Release 5.2
      • Patch 5.2.1
      • Patch 5.2.2
    • Release 5.1
      • Patch 5.1.1
      • Patch 5.1.2
      • Patch 5.1.3
    • Release 5.0
      • Patch 5.0.1
      • Patch 5.0.2
      • Patch 5.0.3
      • Patch 5.0.4
      • Patch 5.0.5
    • Release 4.3 (Fall 2023)
      • Patch 4.3.1
      • Patch 4.3.2
      • Patch 4.3.3
      • Patch 4.3.4
    • Release 4.2
      • Patch 4.2.1
      • Patch 4.2.2
      • Patch 4.2.3
      • Patch 4.2.4
      • Patch 4.2.5
      • Patch 4.2.6
      • Patch 4.2.7
    • Release 4.1
      • Patch 4.1.1
      • Patch 4.1.2
      • Patch 4.1.3
      • Patch 4.1.4
      • Patch 4.1.5
    • Release 4.0
Powered by GitBook

ยฉ 2025 Tellius

On this page
  • Creating a dropdown list
  • Selecting the values

Was this helpful?

Export as PDF
  1. Vizpads (Explore)
  2. Control filters

Dropdown list

Creating and building range slider control filter

PreviousRange sliderNextActions in View mode

Last updated 1 year ago

Was this helpful?

They act similar to multi-select lists but require less space than multi-select lists.

Creating a dropdown list

  1. When you create a dropdown list, then a control filter widget named "Dropdown List (chosen_column)" with a dropdown menu will be created.

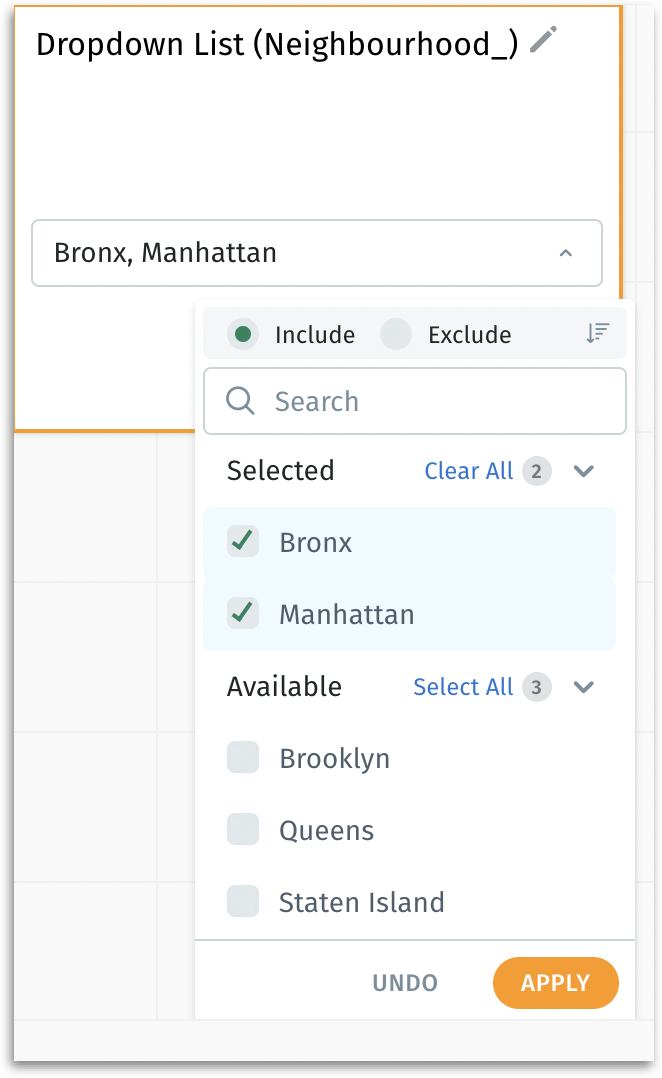
  2. Click on the dropdown menu to view the two nested lists Include and Exclude, and two collapsible lists Selected and Available.

Dropdown list
  1. From the required Business View, select the dimension for which you want to apply filters.

  2. Initially, there won't be any values under Selected, and all the values will be present under Available list.

  3. Click on the pencil icon to rename the multi-select control filter.

  4. To sort the filter values, click on the sorting icon to sort the values in ascending or descending order.

  5. To search for a specific value, start typing the value in the search bar provided above Selected. The values matching your input will be displayed.

Available list will display the first 300 values. Further scrolling will display the remaining values.

Selecting the values

  1. Once the user selects the required values, those values will be moved from Available to Selected.

  2. Include list displays the list of included values. In that case, the values under Selected are the ones that will be considered for filters.

  3. Exclude list displays the list of excluded values. In that case, the values under Selected are the ones that will not be considered for filters.

  4. By default, Include list will be selected.

If you have 200 values and want to select 5 of them, choose Include list. If you have 200 values but want to select 150 of them, choose Exclude list.

  1. Click on Clear All next to Selected to unselect all the selected values. The number next to Clear All indicates the number of values selected.

  2. Click on Select All next to Available to select all the values available in the column. The number next to Select All indicates the number of available values.

No filter will be applied if all existing values are moved to the Selected list (in case of either Include or Exclude).

  1. Once all the required values are selected, click on Apply to apply the filter or click on Undo to revert to the previously saved state.

  2. The filters will be applied to all the charts in the Vizpad that were created using the specific Business View, and a global filter pill will be created that reflects the applied control filter.

๐Ÿ“ˆ
โœ…
Dropdown list