Interacting with the charts
Interact with Tellius charts in View mode—create Insights, Feeds, and ML models, or drill, keep, and remove data segments for deeper visualization analysis.
In addition to viewing the charts and tables, you can interact with them. In the View mode, click on any segment or part of the chart, and the following menu will be displayed.
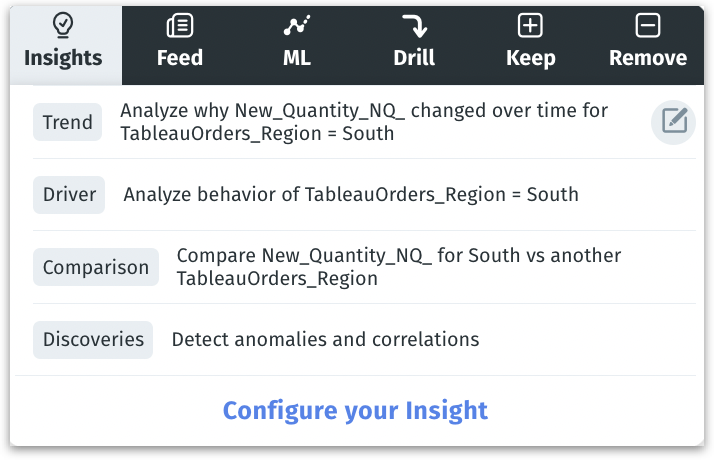
In addition to clicking on the required part of the chart, you can also highlight a specific area in your chart. Drag your mouse pointer over the required area and the above menu will be displayed for the selected area.
Please note that creating Feeds from tables isn’t supported. From tables, you can create Insights, build ML models, and use Drill, Keep, and Remove actions. Click any cell, and you can add a comment or choose Drilldown (downward arrow). Selecting Drilldown opens the configuration panel for deeper exploration.
Vizpads offer dynamic chart manipulation features to gain deeper insights. Here's how you can interact with your visualizations for a more in-depth data analysis:
Insights
Upon selecting a data point, a list of relevant Insights will be displayed under different categories: Trends, Drivers, Comparisons, and Discoveries. For each category of Insight, a ready-to-use example is provided for immediate application. These Insights are context-sensitive, tailored to the data point you've selected within a chart.
Click on an example Insight to open the Insight configuration window. Based on your selection, the relevant fields will be automatically populated in the window.
If the provided Insights don't fully meet your needs, you can opt to configure your own by clicking on the “Configure your Insight” button. Here, you can modify or add to the pre-populated fields to your specific requirements.
Creating an Insight directly from the chart enables you to uncover hidden trends, and investigate anomalies. This immediate, contextual analysis helps in understanding the full story your data tells.
Feed
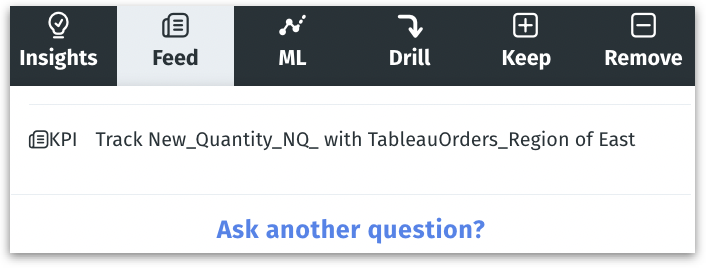
Feed provides a list of questions related to the context of your chart, enabling proactive monitoring of data changes.
Click on a question from the list to open the Feed creation window, where relevant fields are pre-filled.
To monitor something not covered in the list, click on the “Ask your question” button. This allows you to create a new Feed, where you can modify the pre-filled fields or add new details as necessary.
The Feed keeps you updated about significant changes or anomalies as reflected in your chart. By setting up a Feed, you receive timely notifications about important shifts in data trends, ensuring that you're always informed and able to respond promptly to emerging patterns or issues.
ML
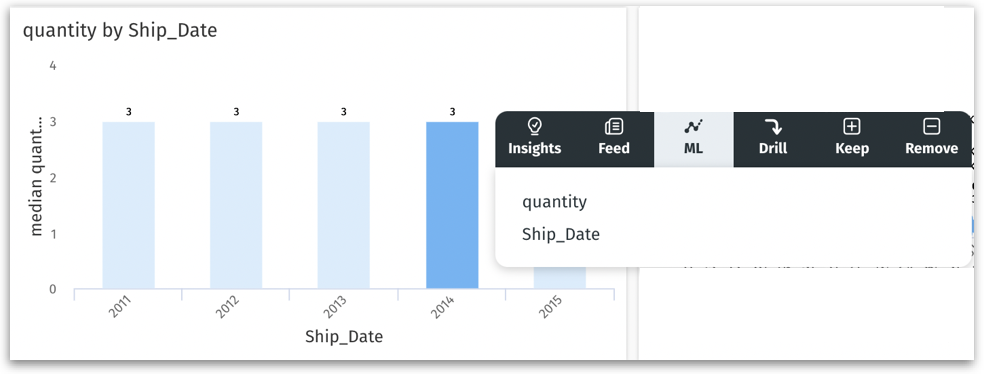
This allows you to create machine learning models based on the primary measures and dimensions used in your chart.
Select the desired column in your chart to start creating a Machine Learning (ML) Model. This action redirects you to the ML-Model creation page.
Creating an ML-Model directly from your chart enables deploying predictive analytics for more nuanced understanding of data patterns and anomalies. It's helpful for harnessing the full potential of AI in your data analysis.
Please note that the following functions will only alter the chart temporarily. These adjustments will not permanently modify the chart or be retained in its original configuration.
Drill
Drilling offers a granular view by changing the chart’s focus or applying the insight to other contexts. Drilling can be done by columns, hierarchy, or across Vizpads.
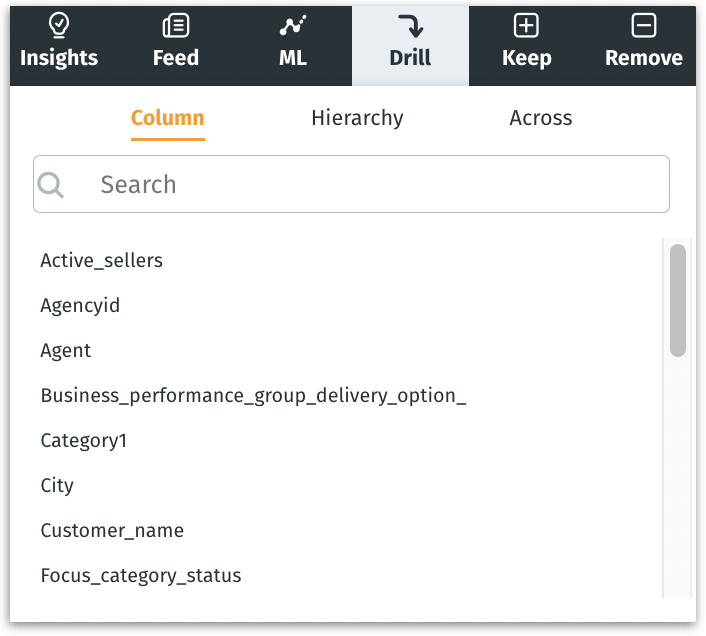
Columns
The list of dimensions of the associated Business View will be displayed. You can change the primary data dimension, while maintaining a specific filter context.
Example: Say, in a bar chart with years as primary data dimension (X-axis), selecting the bar denoting “2023”, and choosing "City" column, will reconfigure the chart to display city-specific data for 2023. A global filter pill indicating the drilled data point will be displayed, which can be removed if required.
Hierarchy
If you’ve created hierarchies during data preparation (Data → Prepare), and if the top layer in the hierarchy is used as the primary data dimension, then the list of those hierarchies will be displayed.
The primary data dimension used in the chart can be switched to the next layer in the hierarchy. Thus, you can navigate through predefined hierarchies for the chosen time frame, descending from broader to finer details.
Example: Consider a hierarchy of 'Yearly → Monthly → Weekly → Daily,' and a bar chart with “Years” as the primary data dimension, where each bar denotes different years.
Clicking on a data point “2023” and choosing the timeline hierarchy will switch “Years” to “Months” as the primary data dimension. Clicking on the hierarchy again will switch it to the next layer (“Weekly”), and so on.
Across
Using Across, you can apply drilling to other Vizpads built with the same Business View. The list of Vizpads that share the same Business View will be displayed. Click on the required Vizpad and you will be redirected to that Vizpad where the drilling would be applied.
Example: If you're analyzing Q1 campaign costs in the 'North Region' Vizpad and want to compare it with the 'East Region', using the "Across" feature will let you seamlessly apply the Q1 filter to the 'East Region' Vizpad. This enables a cohesive across different Vizpads.
Each drill action generates a global filter pill next to “Add filter” that indicates the drilled segment with a downward arrow. This can be removed, if you want to revert the changes and discard the drilled part.

Keep
Isolates and focuses on the selected segment. The rest of the data will temporarily disappear from the chart. It allows for a concentrated examination of the chosen points.
Example: In a bar chart displaying sales over the years, selecting "Keep" on the 2022 bar will isolate this data, providing a clearer view of the sales done in 2022 alone.
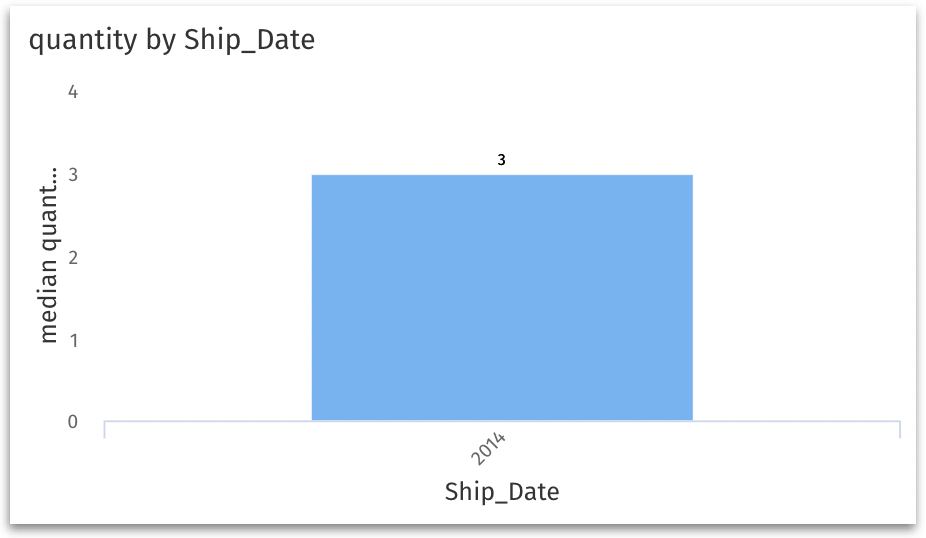
Each "Keep" action generates a global filter pill next to “Add filter” that indicates the prominent data point with a "+". This can be removed, if you want to revert the changes and discard the "Keep" action.

Remove
This action retains all data except the selected segment. This is particularly useful for omitting outliers or irrelevant information that may distract from your core analysis.
Example: If a particular quarter in a line graph shows an outlier that distorts analysis, using "Remove" will exclude this data, offering a normalized trend view.
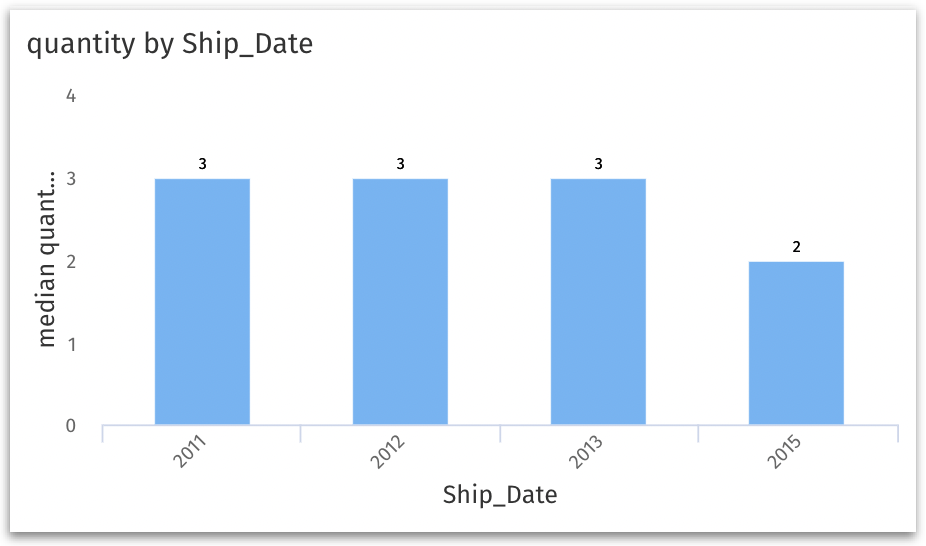
Each "Remove" action generates a global filter pill next to “Add filter” that indicates the prominent data point with a "-". This can be removed, if you want to revert the changes and discard the "Remove" action.

The "Keep" and "Remove" functionalities refine your data visualization without permanently altering or transforming the underlying chart.
Was this helpful?