Chart level

Configuring the display of anomalies for a chart in a Vizpad and Search

Vizpads (Explore tab)

View mode

  1. Click on the required Vizpad from Explore tab.

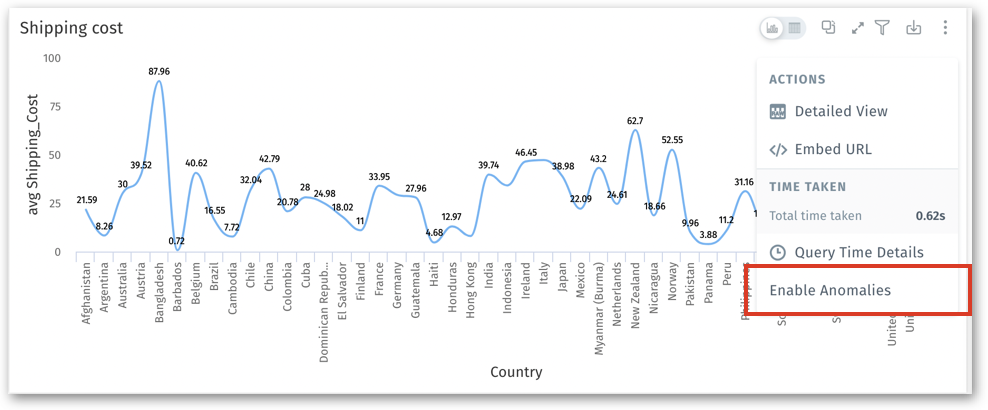
  2. For any line chart, click on the three-dot kebab menu and select Enable Anomalies to display the anomalies or Disable Anomalies to hide the anomalies.

Vizpad chart in View mode

Edit mode

  1. Click on the Edit button on the required Vizpad.

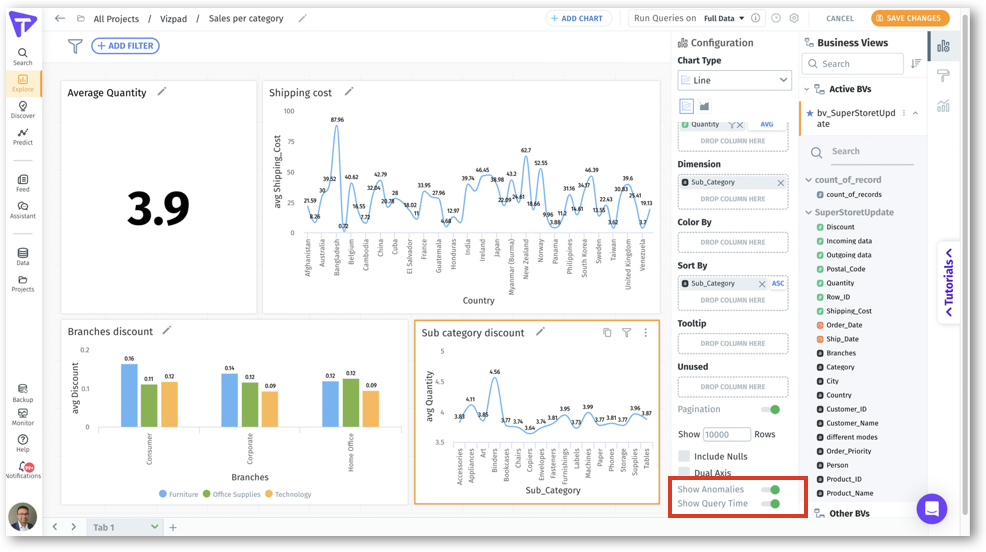
  2. In the right Configuration pane, enable the Show Anomalies toggle to display the anomalies in a chart. Turn off the toggle if you want to hide anomalies for the chart.

Vizpad chart in Edit mode
Setting anomalies for a chart in Search
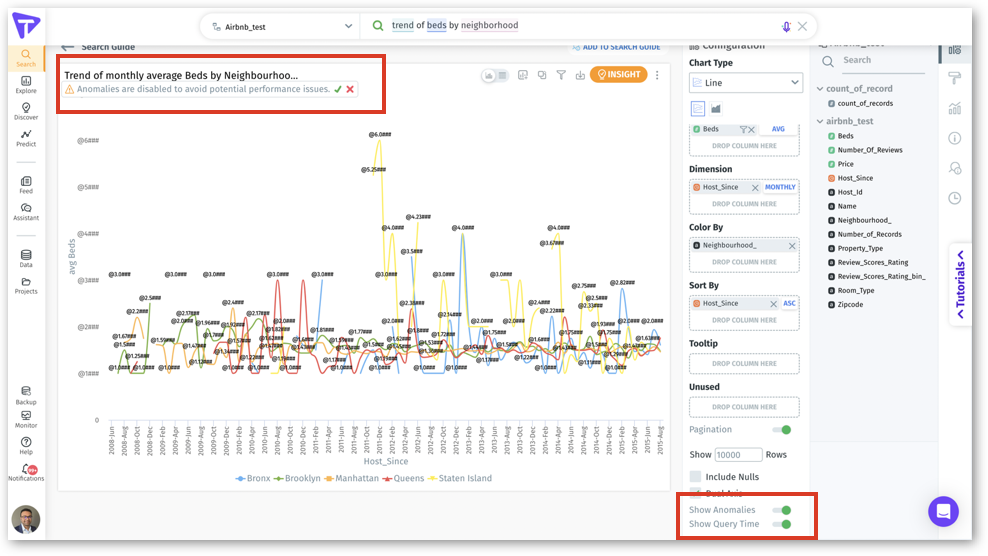
  1. Users have the flexibility to show/hide the anomalies displayed in search query results.

  2. In the right Configuration pane, enable the Show Anomalies toggle to display the anomalies in a chart. Turn off the toggle if you want to hide anomalies for the chart.

Last updated

Was this helpful?