
Patch 5.0.2
Discover what's new in Tellius v5.0.2—enhanced performance, streamlined workflows, Trino JDBC support, and over 70 fixes across Vizpads, Search, Insights, ML Models.
The version 5.0.2 brings a series of enhancements and minor fixes to improve the functionality and user experience across our platform. This update focuses on optimizing performance, enhancing visibility, and increasing reliability to ensure that our users can manage and analyze their data more effectively.
📈 Enhancements
Support for Trino JDBC
Added support for the Trino JDBC connector, enhancing database connectivity options and expanding integration capabilities with various data sources.
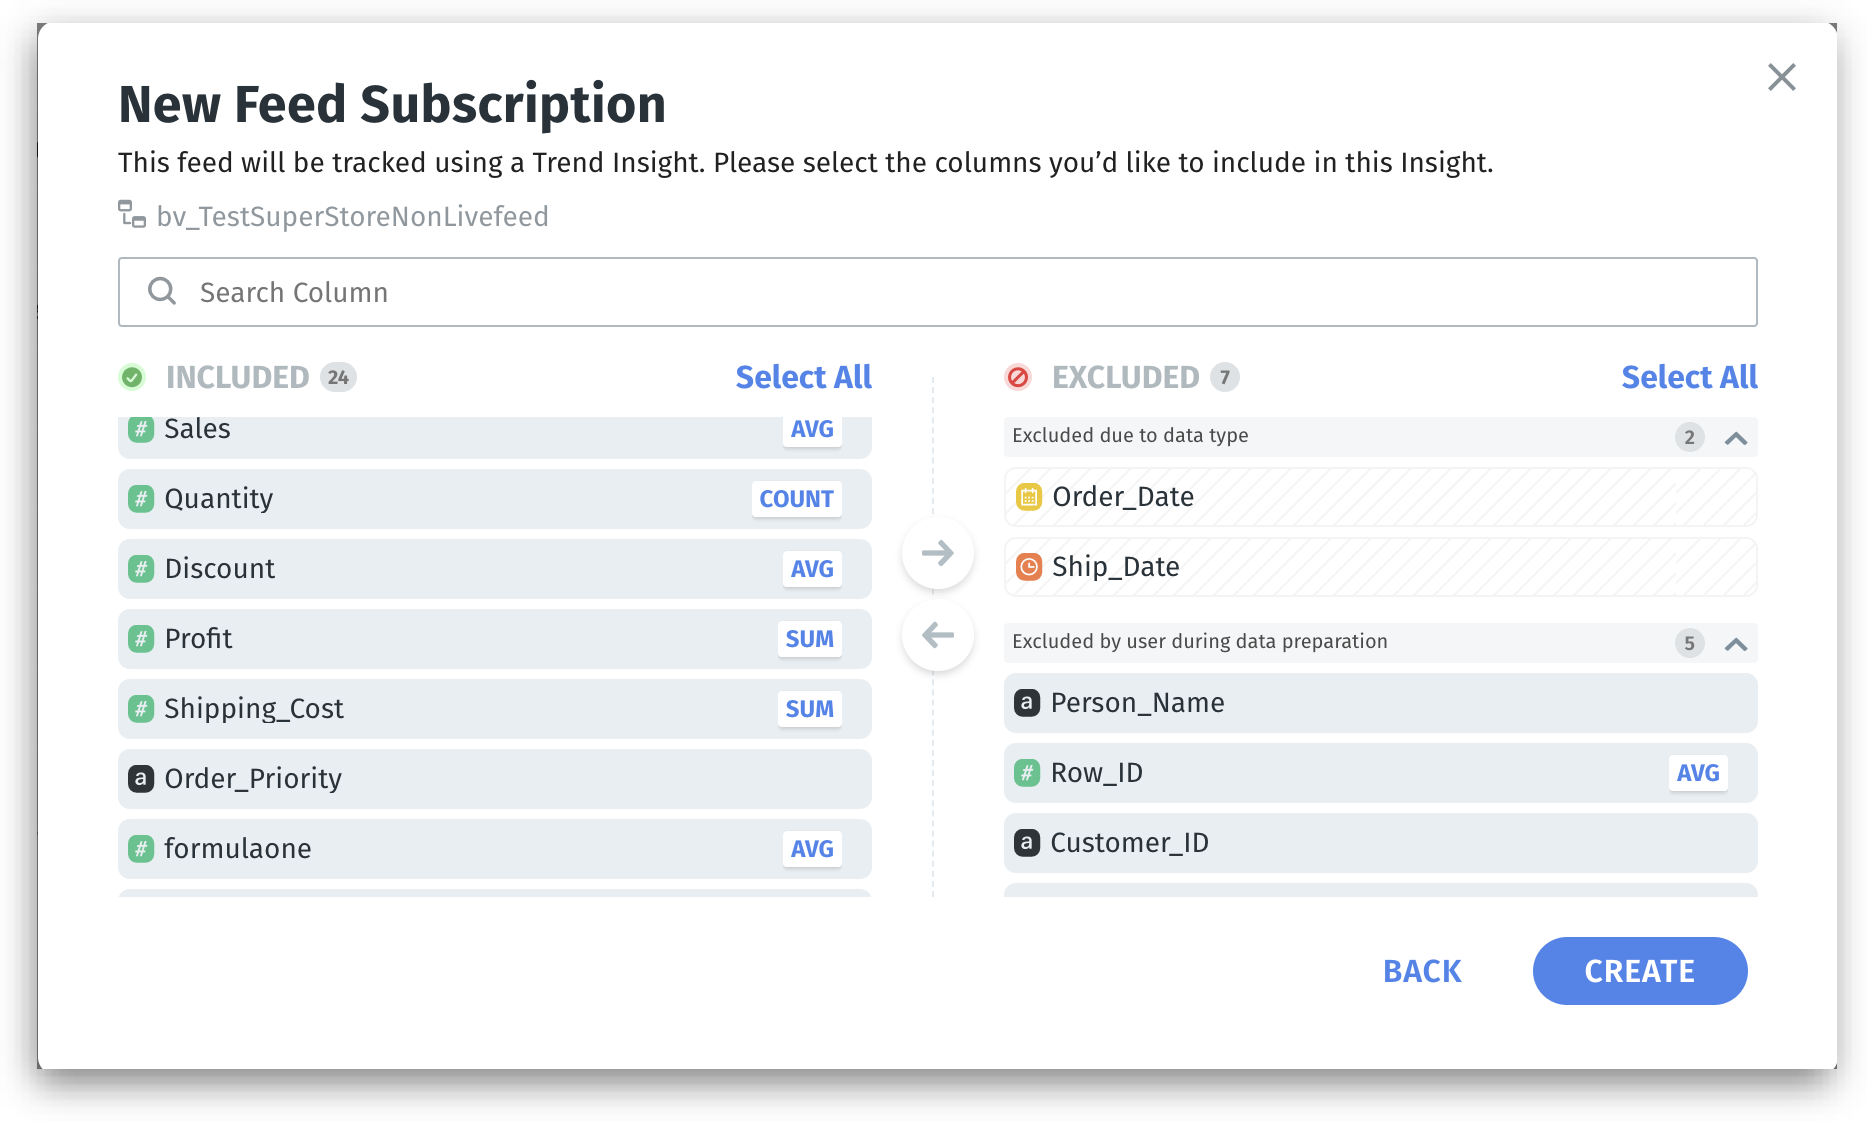
Clear visibility of selected columns in Feed
During Feed creation, enabled the display of number of available and selected columns for include-exclude columns (akin to Insight creation). This improves user experience by providing clearer visibility and transparency about which columns are being included or excluded from the feed.
Optimized date queries in Vizpads
In Vizpads, we've enhanced the performance of charts that involve date columns, which previously queried the maximum date, leading to delayed responses, particularly over slow connections. In this update, we've refined our caching logic to store the results of such queries. Now, when identical requests are made, the system retrieves the cached results instead of re-querying the database. We have also disabled the automatic calculation of total row counts by default.
This optimization reduces load times and improves the overall responsiveness of charts, ensuring a smoother and faster user experience.
🛠️ Minor fixes
Resolved an issue where Insight names were not updating upon hitting the "Enter" key, ensuring changes are now immediately reflected in the system.
Fixed a bug where applying display names to date columns interfered with the functioning of time series regression models in ML-Models.
In the Notifications → View details for imported objects, the "View" button has been removed to streamline user experience.
In Vizpads, addressed a bug that caused errors when date columns were used in YOY charts.
In Vizpads, fixed the issue with adding date filters in column filters when Top (n) filters are used without any column assigned for the “By” field.
During data preparation, corrected an issue where date columns published as primary date columns were incorrectly retained after switching to a dataset.
In Tellius Assistant, fixed the issue where the logo reverted to the default after updating and refreshing the page.
In Trend Driver Insights, addressed the issue with displaying line charts in the “Why” section.
Addressed an issue where users encountered a blank page when trying to create an Auto-ML model directly from Vizpad charts.
Resolved the failure of percentage queries when a date column filter was applied.
Fixed a bug that caused failures in Insights refresh and notifications when multiple email IDs were involved.
For Snowflake live datasets, resolved the issue with using calculated columns involving comparisons in Vizpads and live Trend Driver Insights.
In Vizpads, resolved issues with date sorting when transitioning from Treemap to Detailed Table views.
In Trend Driver Insights, removed the display of unnecessary labels from the "Why" section.
In Vizpads, corrected inconsistencies in the display of applied filter values in the global filter when using options such as drill, keep, and remove.
When deduplication is enabled for Snowflake live datasets, the issue with using calculated columns in Vizpads has been fixed.
Resolved the issue with email notifications not getting reflected after updating and saving the settings.
In Vizpads, fixed the sorting issue when measure is added to a date column.
Implemented restrictions to prevent the deletion of dataset columns if they are used in Business Views (BVs) with aliases.
In Vizpads, fixed the issue of displaying Business View columns when multiple BVs are used.
The issue with parsing calculated column formulas containing window functions has been resolved.
The type of calculated columns are reverted to measure types, for them to be seamlessly used as measures in Search and Vizpad.
In Search, enhanced the search bar to handle lengthy queries and improved the “Hit Enter to Search” prompt.
Fixed the issue where calculated columns defined within a multi-dataset Business View were inadvertently deleted when a single dataset within that BV was updated and republished.
In Search, resolved the issue where ambiguity messages in marketshare comparison queries did not display the specific column names involved.
Addressed issues with deduplication for formula columns using functions like "distinct”.
Fixed the issue with the SmartSelect feature (automatic selection of relevant Business View) for a high number (more than 200) of Business Views.
In Vizpads, fixed the issues with downloading boundary and location map charts in PNG, JPG, or PDF formats.
In user settings, resolved issues preventing users from successfully updating their passwords.
Fixed the issue with the display of undefined time ranges when re-running old Trend Insights.
In Data→ Business View, addressed an issue where hidden columns became visible when pagination was used.
In Predict (ML-Models), corrected discrepancies in the values displayed on the Y-axis in clustering views.
In user settings, the issue with enabling email notifications checkbox has been resolved.
In Vizpads, resolved errors (indicating missing columns or type changes) that appeared when adding numeric dimensions to control filters.
In Vizpads, enhanced error handling in PDF generation to send meaningful error messages instead of producing empty or corrupt PDFs.
In Search → Search Inspector, improved scrolling so that filters are consistently visible.
Addressed inconsistencies in the hiding/unhiding functionality for datasets across multiple datasets in the Business View
Resolved the auto-cancelling of jobs after refreshing Business Views with a large number of columns and datasets.
In the Notifications page, added Job Type and Display type for metadata migration job.
Enhanced error messaging for API timeouts, when the swapping and validation of datasource fails.
Addressed the issue where the “Export” option was not visible in Vizpads shared in View mode.
Under Data → Prepare → Data, fixed the “Alert success” notification banner displayed after setting up alerts for datasets.
For Snowflake Live datasets, fixed the issue with displaying deduplication toggle for shared users (with Edit access).
While creating Insights, corrected an issue where date data types were incorrectly displayed as timestamp types.
In Vizpads, addressed the issue of editing and applying filters from filter pills.
For Snowflake live Business Views, fixed marketshare absolute/percentage change queries involving calculated column level formulas.
In Notifications, fixed the sorting order of notifications to reflect across all pages.
In Vizpads, resolved the intermittent display of legends in stacked bar charts.
Provided relevant error messages when scheduling refresh for datasets.
Added custom horizontal scrollbars to datasets (Data → Prepare) and Business Views (Data → Business View).
In Vizpads, fixed the issue with displaying duplicate entries in control lists.
To reduce system load and avoid timeout issues, SQL script validation now occurs on sample data instead of full datasets.
In the Notifications page, improved the visibility and clarity of error messages for failing SQL jobs, particularly those due to missing columns in datasets.
In Search, fixed an issue where text and icons overlapped in search queries.
The “Export Dependencies” checkbox has been removed when trying to export Vizpads and Projects.
Under Predict → Feature transform → Select columns to predict, fixed the issue with selecting "All" and "Exclude" options while configuring time series models.
Ensured that schedules on refreshing resources (Vizpads, Insights etc.) are listed only if the resource has edit access.
In Vizpads → Configuration pane, the overflowing issue with the tooltips has been resolved.
In Data → Connect → Amazon S3 connector, addressed the search limitation where only the initial 999 preloaded files were searchable.
Addressed the issue with the opening of “Favorites” menu from Insights and Predict.
In Vizpads, implemented a fix to restrict Viz titles to less than 255 characters when adding a chart from the Search function.
In Azure AD, resolved an issue where the Authentication Provider name was not displayed when selected.
Fixed the issue with the display of values when attempting to reconfigure a failed Insight from Notifications → View Details.
In Models, resolved the display of Business View names in the popup window during the swapping of Business Views.
In Vizpads, addressed an issue that prevented users from resizing KPI widgets to 2x2 after switching from another chart type.
In the user settings page, fixed the issue with displaying the display name (instead of column names) when selecting a filter column.
In Vizpads, fixed inconsistencies with the display of number of selected and available values in cloned control filter lists.
In Vizpads, fixed the issue where the Y-axis was not updated after changing column aggregation for bar charts with benchmark.
In the user settings page, fixed the filtering issues with applying and deleting row-level policies for measures and dimensions.
In ML Models, resolved an issue where the Feature Importance values were not reflected according to the algorithm changed.
In Predict, fixed the issue with the display of display names for Auto ML and Point and Click models.
In the Edit mode of Vizpads, addressed the display issue of global filters overlapping with the charts.
While embedding Vizpads, fixed the issue with dragging and dropping the columns to the the Configuration pane.
In Insights, fixed an issue where Insights were failing when re-run in Edit mode with a different time period.
When sharing Vizpads using embed URL, fixed an issue where users encountered an "Unauthenticated or not enough privileges" error.
In Vizpads, updated benchmark line calculations to include the configuration used to plot the chart, including filters.
In Vizpads, resolved the issue with searching in dropdown control filters.
Snowflake queries implemented from Vizpad and Search that run over 15 minutes will be automatically terminated to avoid excessive billing.
Fixed the issue with dependent calculated columns in deduplication-enabled live Business Views.
In Vizpads, fixed the issue with active Business Views remaining open when adding new charts.
Fixed an issue where metadata was not being correctly updated across the instance when renaming a dataset.
Fixed an issue where adding learning to a Business View shared in View mode incorrectly granted edit permissions.
In trend driver Insights, addressed an issue where the KPI in the "WHY" section was defaulting to incorrect aggregation.
In trend/cohort driver Insights, fixed the incorrect handling of empty or null values.
In Insights, fixed the issue with the rendering of charts after removing the filter from the “WHY” section.
In Insights, fixed the issue with displaying colors in the trends chart.
In Insights, the measure contributor for the total number of rows in the "WHY" section is now completely hidden.
In Search, fixed the display issue with the data labels for charts when filters were manually added.
Resolved an issue where market share filters were not working on column-level formulas when deduplication was enabled for Snowflake live Business Views.
The issue with displaying column values containing colons and special characters has been fixed across Tellius.
In Snowflake live Business Views where deduplication is enabled, improved error messages for fact-to-fact joins to use dataset names instead of dataset IDs, making them more user-friendly.
In Search, addressed an issue where the auto Business View (BV) selection pointed to the last used BV when the previous query was removed.
In Trend Insights, fixed the issue with updating the formatting of measure columns.
Fixed an issue where aliases for sub-expressions in formula columns were generated as random strings within Snowflake Business Views (deduplication enabled), which prevented proper caching of results in Snowflake.
Adjusted the row count validation during Business View publish to avoid running on sample data.
In the configuration pane of Vizpads, resolved the display issue with the measure icon for absolute and percentage change.
In Comparison Insights, fixed an issue that prevented the addition of Viz to a Vizpad from the "WHAT" and "WHY" sections.
In Search, resolved the issue of displaying duplicate column names in the right side panel.
In the Application Settings page, fixed enabling/disabling issues for options related to the display of data labels, default color palette, query time display, and email configuration.
In Vizpad charts, handled the issue where case statements involving date functions caused row-level formulas to fail when used in another formula.
In Vizpads, fixed the issue with saving sorting preferences for control filter values.
In Vizpads, fixed the issue where the sample data/full data preference was not reflected in the charts.
In Insights, the issue with displaying relevant details after clicking on the "Understand why" button for a contributor has been resolved.
Was this helpful?