Tellius
  • 🚩Getting Started
    • 👋Say Hello to Tellius
      • Glossary
      • Tellius 101
      • Navigating around Tellius
      • Guided tours for quick onboarding
    • ⚡Quick Start Guides
      • Search
      • Vizpads (Explore)
      • Insights (Discover)
    • ✅Best Practices
      • Search
      • Vizpads (Explore)
      • Insights (Discover)
      • Predict
      • Data
    • ⬇️Initial Setup
      • Tellius architecture
      • System requirements
      • Installation steps for Tellius
      • Customizing Tellius
    • Universal Search
    • 🏠Tellius Home Page
  • Kaiya
    • ♟️Understanding AI Agents & Agentic Flows
      • Glossary
      • Composer
      • 🗝️Triggering an agentic workflow
      • The art of possible
      • Setting up LLM for Kaiya
    • 🤹Kaiya conversational AI
      • ❓FAQs on Kaiya Conversations
      • Triggering Insights with "Why" questions
      • Mastering Kaiya conversational AI
  • 🔍Search
    • 👋Get familiar with our Search interface
    • 🤔Understanding Tellius Search
    • 📍Search Guide
    • 🚀Executing a search query
      • Selecting a Business View
      • Typing a search query
      • Constructing effective search queries
      • Marketshare queries
    • 🔑Analyzing search results
      • Understanding search results
      • Search Inspector
      • Time taken to execute a query
      • Interacting with the resulting chart
    • 📊Know your charts in Tellius
      • Understanding Tellius charts
      • Variations of a chart type
      • Building charts from Configuration pane
      • List of chart-specific fields
      • Adding columns to fields in Configuration pane
      • Absolute and percentage change aggregations
      • Requirements of charts
      • Switching to another chart
      • Formatting charts
      • Advanced Analytics
      • Cumulative line chart
    • 🧑‍🏫Help Tellius learn
    • 🕵️‍♂️Search history
    • 🎙️Voice-driven search
    • 🔴Live Query mode
  • 📈Vizpads (Explore)
    • 🙋Meet Vizpads!
    • 👋Get familiar with our Vizpads
    • #️⃣Measures, dimensions, date columns
    • ✨Creating Vizpads
    • 🌐Applying global filters
      • Filters in multi-BV Vizpads
      • Filters using common columns
    • 📌Applying local filters
    • 📅Date picker in filters
      • Customizing the calendar view
    • ✅Control filters
      • Multi-select list
      • Single-select list
      • Range slider
      • Dropdown list
    • 👁️Actions in View mode
      • Interacting with the charts
    • 📝Actions in Edit mode
      • 🗨️Viz-level actions
    • 🔧Anomaly management for line charts
      • Instance level
      • Vizpad level
      • Chart level
    • ⏳Time taken to load a chart
      • Instance level
      • Vizpad level
      • Chart level
    • ♟️Working with sample datasets
    • 🔁Swapping Business View of charts
      • Swapping only the current Vizpad
      • Swapping multiple objects
      • Configuring the time of swap
    • 🤖Explainable AI charts
  • 💡Insights (Discover)
    • 👋Get familiar with our Insights
    • ❓Understanding the types of Insights
    • 🕵️‍♂️Discovery Insights
    • ➕How to create new Insights
      • 🔛Creating Discovery Insight
      • 🔑Creating Key Driver Insights
      • 〰️Creating Trend Insights
      • 👯Creating Comparison Insights
    • 🧮The art of selecting columns for Insights
      • ➡️How to include/exclude columns?
  • 🔢Data
    • 👋Get familiar with our Data module
    • 🥂Connect
    • 🪹Create new datasource
      • Connecting to Oracle database
      • Connecting to MySQL database
      • Connecting to MS SQL database
      • Connecting to Postgres SQL database
      • Connecting to Teradata
      • Connecting to Redshift
      • Connecting to Hive
      • Connecting to Azure Blob Storage
      • Connecting to Spark SQL
      • Connecting to generic JDBC
      • Connecting to Salesforce
      • Connecting to Google cloud SQL
        • Connecting to a PostgreSQL cloud SQL instance
        • Connecting to an MSSQL cloud SQL instance
        • Connecting to a MySQL Cloud SQL Instance
      • Connecting to Amazon S3
      • Connecting to Google BigQuery
        • Steps to connect to a Google BigQuery database
      • Connecting to Snowflake
        • OAuth support for Snowflake
        • Integrating Snowflake with Azure AD via OAuth
        • Integrating Snowflake with Okta via OAuth
        • Azure PrivateLink
        • AWS PrivateLink
        • Best practices
      • Connecting to Databricks
      • Connecting to Databricks Delta Lake
      • Connecting to an AlloyDB Cluster
      • Connecting to HDFS
      • Connecting to Looker SQL Interface
      • Loading Excel sheets
      • 🚧Understanding partitioning your data
    • ⏳Time-to-Live (TTL) and Caching
    • 🌷Refreshing a datasource
    • 🪺Managing your datasets
      • Swapping datasources
    • 🐣Preparing your datasets
      • 🤾Actions that can be done on a dataset
      • Data Pipeline
      • SQL code snippets
      • ✍️Writeback window
      • 🧩Editing Prepare → Data
      • Handling null or mismatched values
      • Metadata view
      • List of icons and their actions
        • Functions
        • SQL Transform
        • Python Transform
        • Standard Aggregation
        • Creating Hierarchies
      • Dataset Scripting
      • Fusioning your datasets
      • Scheduling refresh for datasets
    • 🐥Preparing your Business Views
      • 🌟Create a new Business View
      • Creating calculated columns
      • Creating dynamic parameters
      • Scheduling refresh for Business Views
      • Setting up custom calendars
    • Tellius Engine: Comparison of In-Memory vs. Live Mode
  • Feed
    • 📩What is a Feed in Tellius?
    • ❗Alerts on the detection of anomalies
    • 📥Viewing and deleting metrics
    • 🖲️Track a new metric
  • Assistant
    • 💁Introducing Tellius Assistant
    • 🎤Voice-based Assistant
    • 💬Interacting with Assistant
    • ↖️Selecting Business View
  • Embedding Tellius
    • What you should know before embedding
    • Embedding URL
      • 📊Embedding Vizpads
        • Apply and delete filters
        • Vizpad-related actionTypes
        • Edit, save, and share a Vizpad
        • Keep, remove, drill sections
        • Adding a Viz to a Vizpad
        • Row-level policy filters
      • 💡Embedding Insights
        • Creating and Viewing Insights
      • 🔎Embedding Search
        • Search query execution
      • Embedding Assistant
      • 🪄Embedding Kaiya
      • Embedding Feed
  • API
    • Insights APIs
    • Search APIs
    • Authentication API (Login API)
  • ✨What's New
    • Release 5.4
      • Patch 5.4.0.x
    • Release 5.3
      • Patch 5.3.1
      • Patch 5.3.2
      • Patch 5.3.3
    • Release 5.2
      • Patch 5.2.1
      • Patch 5.2.2
    • Release 5.1
      • Patch 5.1.1
      • Patch 5.1.2
      • Patch 5.1.3
    • Release 5.0
      • Patch 5.0.1
      • Patch 5.0.2
      • Patch 5.0.3
      • Patch 5.0.4
      • Patch 5.0.5
    • Release 4.3 (Fall 2023)
      • Patch 4.3.1
      • Patch 4.3.2
      • Patch 4.3.3
      • Patch 4.3.4
    • Release 4.2
      • Patch 4.2.1
      • Patch 4.2.2
      • Patch 4.2.3
      • Patch 4.2.4
      • Patch 4.2.5
      • Patch 4.2.6
      • Patch 4.2.7
    • Release 4.1
      • Patch 4.1.1
      • Patch 4.1.2
      • Patch 4.1.3
      • Patch 4.1.4
      • Patch 4.1.5
    • Release 4.0
Powered by GitBook

© 2025 Tellius

On this page
  • 📈 Enhancements
  • Support for switching KPI charts
  • Increased dimensions for pivot tables in Vizpads
  • Strengthening Kaiya Search
  • 🛠️ Minor fixes

Was this helpful?

Export as PDF
  1. What's New
  2. Release 5.0

Patch 5.0.3

PreviousPatch 5.0.2NextPatch 5.0.4

Last updated 4 days ago

Was this helpful?

The latest version 5.0.3 delivers a range of improvements and fixes across various modules to enhance overall functionality and user experience. This update addresses multiple issues related to data visualization, user interface consistency, and system performance. Users will benefit from improved stability, more intuitive controls, and better handling of complex queries and datasets.

📈 Enhancements

Support for switching KPI charts

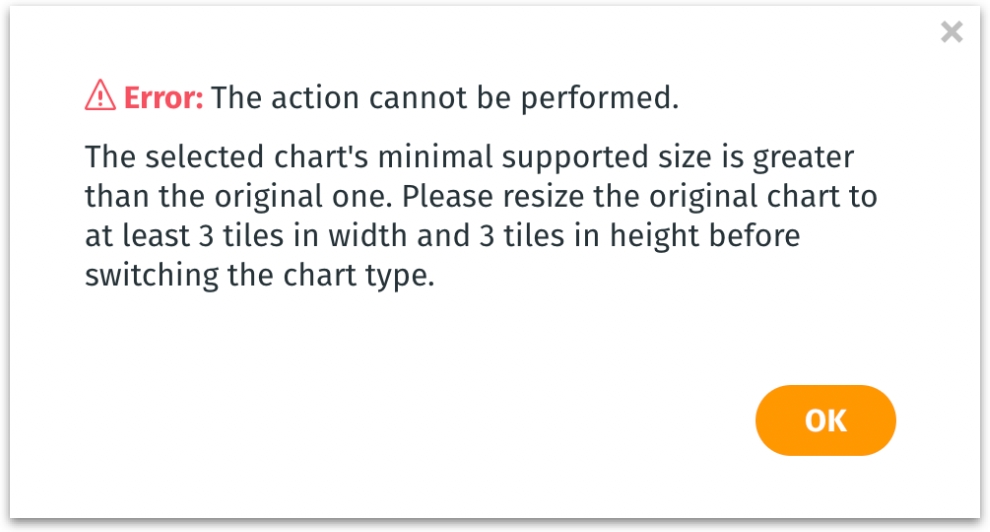
In Vizpads, KPI charts can be switched to any required chart. Users can select an existing chart and switch it to the available chart from the Chart Type dropdown in the Configuration pane.

However, the KPI chart needs to be resized to cover a 3x3 grid area within the Vizpad layout before switching to the selected chart. This enhances flexibility, allowing users to customize their dashboards to better suit their analytical needs while ensuring adequate space for the new chart type.

Alert message when switching KPI chart

Increased dimensions for pivot tables in Vizpads

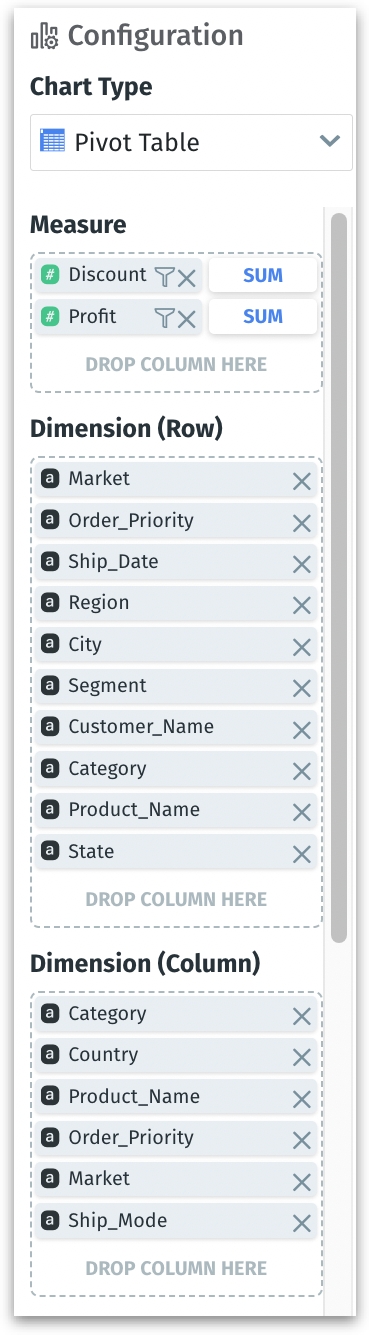
The number of dimensions for pivot table rows and columns in Vizpads has been increased from 5 to 10, supporting up to 10 columns in both rows and columns. This enhancement allows for more complex data analysis and greater detail in pivot tables, enabling users to uncover deeper insights by incorporating more dimensions into their analyses.

Strengthening Kaiya Search

The prompts for Kaiya-powered Search have been enhanced to provide more cohesive and meaningful responses for complex queries. This improvement enhances the quality of results generated by Kaiya, making it easier for users to obtain relevant and comprehensive answers to their complex questions, thereby improving the overall search experience.

🛠️ Minor fixes

  1. In Trend Insights, the display of relevant numbers in status bars above “Top Change Contributors” has been fixed.

  2. When embedding a Vizpad, fixed the display of date picker and the application of date filters to charts.

  3. In Notifications, fixed the issue with retrying failed “Publish” jobs of Business Views.

  4. In Insights, the issue with displaying sentiment (red, down arrow for decrease and green, up arrow for increase) has been resolved for “Contributors to the increase/drop” section.

  5. Under Settings → Users & Groups, fixed the issue with adding a user to a user group.

  6. Added error message in the top banner to indicate the longer response times and timeout.

  7. In Insights, resolved the issue with providing share permissions to a view-only user.

  8. Under Settings → Users & Groups, the issue with displaying longer user names has been fixed.

  9. In Insights, resolved the issue with displaying relevant charts after removing a filter from the “Why” section.

  10. In Vizpads, fixed the issue with displaying the aggregation twice for any column added under conditional formatting.

  11. Resolved the issue with navigating to the Backup & Restore page from different pages across Tellius.

  12. Under the “Why” section of Insights, resolved the issue with the color palette of trend charts.

  13. Under Data → Prepare → Schedule, a progress bar will be displayed to indicate the uploading process and the associated “Refresh” button will be disabled until the upload is completed.

  14. In Insights, after clicking on “Show why”, fixed the issue with the display of relevant charts as per the applied filter.

  15. For shared Vizpads, fixed the issue with displaying active Business Views and filters in the right configuration pane.

  16. In Trend Driver Insights, calculated columns can no longer be assigned as target measure aggregations.

  17. In Vizpads, fixed the issue with displaying the Configuration pane after saving an empty multi-select control filter.

  18. The issue with publishing Business Views from the Notifications page (reconfiguring) has been fixed.

  19. In Vizpads, removed the additional message displayed when trying to export Vizpads.

  20. Under Data → Prepare → Data, removed the options to rename and delete the datasets shared in View mode.

  21. In Trend Driver Insights, fixed the issue with applying date filters for the Segment section.

  22. Resolved the issue with successfully submitting feedback from the Help page.

  23. Under Data → Business Views, after selecting a Business View, the associated Publish button will be disabled until the Business View gets loaded completely.

  24. Under Settings → Application Settings → Miscellaneous, fixed the issue with enabling/disabling the Offline Render toggle for Report Configuration.

  25. In the Conditional Formatting popup of Vizpads, fixed the issue with displaying duplicate aggregation for the selected columns to be formatted.

  26. Under Settings → Security → OAuth access, resolved the issue with displaying the selected Scope for newly created clients.

  27. In Vizpads, fixed the issue with maintaining the formatting after changing the aggregation for pivot tables.

  28. Datasets should be labeled as "Facts" or "Dimensions", while unlabeled datasets are treated as "Dimensions". This information will be stored in the Requests collection in MongoDB. If a user's analysis involves multiple Fact groups without direct joins, an error will be triggered. Separate analyses will be performed for each Fact group if needed.

  29. Improved graph processing to eliminate redundant joins when using distant datasets, enhancing efficiency for in-database Snowflake queries.

  30. Under Settings → My Profile, resolved the issue with applying and saving Language Preferences.

  31. In Comparison Insights, fixed the issue with the display of irrelevant dates when editing the date columns.

  32. In Insights, fixed the design issues with “Move Insights” pop-up.

  33. Disabled preview for live Snowflake BusinessViews with deduplication enabled due to performance issues and the impracticality of previewing exploded data.

  34. In Vizpads, resolved the issue with saving and retaining the changes made to the column width of tables.

  35. The deletion of any type of object (Insights, Vizpads etc.) is restricted only to admins and the original creators. On hovering over the disabled "Delete" option in any object shared in Edit mode, a relevant tooltip will be displayed.

  36. Under Settings → Application Settings → Assistant, fixed the issue with displaying the uploaded logo.

  37. When configuring Comparison Insights, only two types of modes (Instant and Fast) will be displayed.

  38. In Vizpad charts, resolved the issue with displaying Y-axis titles in tooltips.

  39. In Vizpads, fixed the issue with displaying relevant filter values (as per the typed characters in Search field) when applying local filters.

  40. Using Help Tellius Learn, the learnings that were created referring to incorrect column names will be ignored.

  41. In Search, resolved an issue where Insight generation from a chart was failing if attempted after using the “Remove” action.

  42. In Vizpads, added tooltips for “Expand” and “Shrink” actions in the top right corner of every chart.

  43. Fixed an issue where Vizpads were not being deleted when their associated Business Views were deleted.

Pivot table configuration
✨