
Patch 5.1.2
Explore Tellius Patch 5.1.2: Enhanced Vizpad performance, improved anomaly detection, and critical bug fixes for a smoother analytics experience.
We're excited to announce the release of version 5.1.2, which brings a significant enhancement to our Feed feature, along with numerous improvements and bug fixes across the platform. This version focuses on improving the user experience, enhancing security, and increasing the reliability of our Vizpads, Insights, and data handling capabilities.
📈 Enhancements
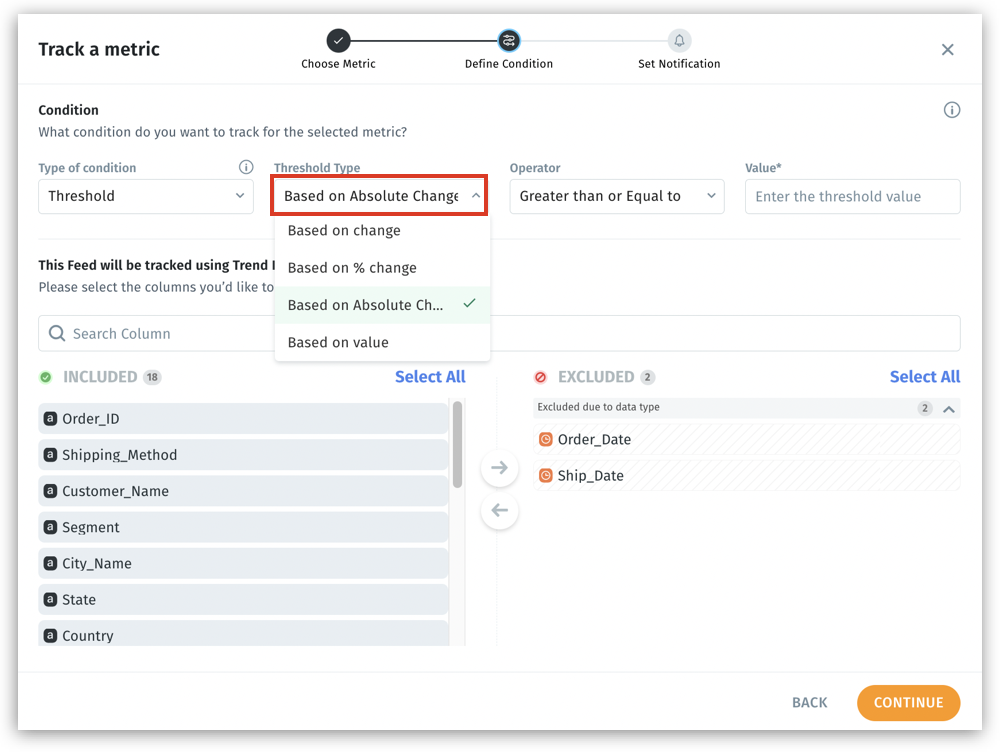
Feed: Introducing “Absolute Change” in Threshold-based alert method
We've added another enhancement to our Feed's threshold-based alerting system. In addition to the existing options of "Based on value", "Based on change," and "Based on % change", we've introduced a new alert type: "Based on Absolute Change”, which alerts based on the magnitude of change, regardless of direction. This allows you to track significant shifts in your metrics whether they're increases or decreases, ideal for identifying any substantial movement that requires attention, and also preventing you from setting separate alerts for positive and negative changes.
For example, you can set an alert to trigger if daily active users change by more than 1,000 in either direction. This allows you to quickly identify and respond to significant fluctuations in user activity, whether it's a sudden increase or decrease.
🛠️ Minor fixes
In Vizpads, resolved an issue where pivot tables weren't displayed properly when global filters were changed, especially after adding 4-5 charts.
Removed SQL scripts like calculated column formulas from the Insight and Vizpads APIs to prevent potential firewall blocking.
Fixed the formatting updates done for measures from the Prepare page weren’t getting reflected in the associated Business View.
When setting up Feed, the UI issues with displaying the “Back” button and scrolling issues have been resolved.
When editing Insights, improved the ability to drag and drop columns for filtering.
In Vizpads, fixed an issue where sort configurations applied in pivot tables weren't being maintained after saving and reopening.
In Vizpads, fixed the functionality of Top N/Bottom N filters for pivot charts.
Implemented critical security updates, strengthening our API authentication protocols and improving the handling of user-uploaded content.
Improved the readability and UI for the “Edit Column Group” popup under Data → Business View.
In Vizpads, fixed the issue with scrolling and handling null values for pivot tables.
Under Notifications → View details, improved the error message when connection timed out due to email server connection.
Under Notifications, resolved the issue with displaying the status of failed Feed.
Resolved the issue with displaying results for a search query after updating it in the Search Guide.
Fixed an issue where row-level data restrictions were not being properly applied when users published Business Views.
Fixed the issue where “Include current time” checkbox in the popup for time/date-based dimensions wasn't reflecting based on system settings.
Resolved an issue where Favorite Insights weren't opening properly when selected from the side panel in the Favorite Insights popup.
Corrected a problem where the “Offline Render” option under Settings → Miscellaneous → Report Configuration settings was showing as disabled after page refresh.
In Vizpads, fixed an issue where opening one filter wasn't closing previously opened filter popups.
In Search, resolved the issue with displaying the relevant sample queries as per the selected Business View after updating the Search Guide.
In Vizpads, updated the UI of the “Download” option for tables and pivot tables.
In Vizpads, resolved the issue with aligning the tooltips with the selected columns in the Configuration pane.
In Vizpads, resolved the issue with retaining custom theme colors for a chart, especially after changing alias names for columns associated with that chart.
In Vizpads, rectified the issue that prevented column drag-and-drop within Configuration pane due to tooltip overlap.
Fixed a problem where the dataset size wasn't being updated after the refresh flow.
Under Notifications, updated the error message displayed when the status failed for the creation of discovery Insights with report level columns.
In Vizpads, resolved an issue where filter popups were closing unexpectedly when scrolling.
Under Data → Business View → Learnings → NLP, fixed the issue with deleting the required, individual Learning.
Under Settings → Application Settings → Email, provided the relevant title and description for the page.
In Vizpads, fixed the issue with applying control filters for Keep action when date columns are involved.
In Vizpads, resolved an issue where the colors for line charts were not ordered according to the selected columns in the Configuration pane.
In Insights, fixed the issue with displaying the accurate dates in the “Why” section.
In Vizpads, fixed the issue with displaying the local filter for every chart when multiple charts are arranged in the Vizpad.
Was this helpful?