Tellius
  • ๐ŸšฉGetting Started
    • ๐Ÿ‘‹Say Hello to Tellius
      • Glossary
      • Tellius 101
      • Navigating around Tellius
      • Guided tours for quick onboarding
    • โšกQuick Start Guides
      • Search
      • Vizpads (Explore)
      • Insights (Discover)
    • โœ…Best Practices
      • Search
      • Vizpads (Explore)
      • Insights (Discover)
      • Predict
      • Data
    • โฌ‡๏ธInitial Setup
      • Tellius architecture
      • System requirements
      • Installation steps for Tellius
      • Customizing Tellius
    • Universal Search
    • ๐Ÿ Tellius Home Page
  • Kaiya
    • โ™Ÿ๏ธUnderstanding AI Agents & Agentic Flows
      • Glossary
      • Composer
      • ๐Ÿ—๏ธTriggering an agentic workflow
      • The art of possible
      • Setting up LLM for Kaiya
    • ๐ŸคนKaiya conversational AI
      • โ“FAQs on Kaiya Conversations
      • Triggering Insights with "Why" questions
      • Mastering Kaiya conversational AI
  • ๐Ÿ”Search
    • ๐Ÿ‘‹Get familiar with our Search interface
    • ๐Ÿค”Understanding Tellius Search
    • ๐Ÿ“Search Guide
    • ๐Ÿš€Executing a search query
      • Selecting a Business View
      • Typing a search query
      • Constructing effective search queries
      • Marketshare queries
    • ๐Ÿ”‘Analyzing search results
      • Understanding search results
      • Search Inspector
      • Time taken to execute a query
      • Interacting with the resulting chart
    • ๐Ÿ“ŠKnow your charts in Tellius
      • Understanding Tellius charts
      • Variations of a chart type
      • Building charts from Configuration pane
      • List of chart-specific fields
      • Adding columns to fields in Configuration pane
      • Absolute and percentage change aggregations
      • Requirements of charts
      • Switching to another chart
      • Formatting charts
      • Advanced Analytics
      • Cumulative line chart
    • ๐Ÿง‘โ€๐ŸซHelp Tellius learn
    • ๐Ÿ•ต๏ธโ€โ™‚๏ธSearch history
    • ๐ŸŽ™๏ธVoice-driven search
    • ๐Ÿ”ดLive Query mode
  • ๐Ÿ“ˆVizpads (Explore)
    • ๐Ÿ™‹Meet Vizpads!
    • ๐Ÿ‘‹Get familiar with our Vizpads
    • #๏ธโƒฃMeasures, dimensions, date columns
    • โœจCreating Vizpads
    • ๐ŸŒApplying global filters
      • Filters in multi-BV Vizpads
      • Filters using common columns
    • ๐Ÿ“ŒApplying local filters
    • ๐Ÿ“…Date picker in filters
      • Customizing the calendar view
    • โœ…Control filters
      • Multi-select list
      • Single-select list
      • Range slider
      • Dropdown list
    • ๐Ÿ‘๏ธActions in View mode
      • Interacting with the charts
    • ๐Ÿ“Actions in Edit mode
      • ๐Ÿ—จ๏ธViz-level actions
    • ๐Ÿ”งAnomaly management for line charts
      • Instance level
      • Vizpad level
      • Chart level
    • โณTime taken to load a chart
      • Instance level
      • Vizpad level
      • Chart level
    • โ™Ÿ๏ธWorking with sample datasets
    • ๐Ÿ”Swapping Business View of charts
      • Swapping only the current Vizpad
      • Swapping multiple objects
      • Configuring the time of swap
    • ๐Ÿค–Explainable AI charts
  • ๐Ÿ’กInsights (Discover)
    • ๐Ÿ‘‹Get familiar with our Insights
    • โ“Understanding the types of Insights
    • ๐Ÿ•ต๏ธโ€โ™‚๏ธDiscovery Insights
    • โž•How to create new Insights
      • ๐Ÿ”›Creating Discovery Insight
      • ๐Ÿ”‘Creating Key Driver Insights
      • ใ€ฐ๏ธCreating Trend Insights
      • ๐Ÿ‘ฏCreating Comparison Insights
    • ๐ŸงฎThe art of selecting columns for Insights
      • โžก๏ธHow to include/exclude columns?
  • ๐Ÿ”ขData
    • ๐Ÿ‘‹Get familiar with our Data module
    • ๐Ÿฅ‚Connect
    • ๐ŸชนCreate new datasource
      • Connecting to Oracle database
      • Connecting to MySQL database
      • Connecting to MS SQL database
      • Connecting to Postgres SQL database
      • Connecting to Teradata
      • Connecting to Redshift
      • Connecting to Hive
      • Connecting to Azure Blob Storage
      • Connecting to Spark SQL
      • Connecting to generic JDBC
      • Connecting to Salesforce
      • Connecting to Google cloud SQL
        • Connecting to a PostgreSQL cloud SQL instance
        • Connecting to an MSSQL cloud SQL instance
        • Connecting to a MySQL Cloud SQL Instance
      • Connecting to Amazon S3
      • Connecting to Google BigQuery
        • Steps to connect to a Google BigQuery database
      • Connecting to Snowflake
        • OAuth support for Snowflake
        • Integrating Snowflake with Azure AD via OAuth
        • Integrating Snowflake with Okta via OAuth
        • Azure PrivateLink
        • AWS PrivateLink
        • Best practices
      • Connecting to Databricks
      • Connecting to Databricks Delta Lake
      • Connecting to an AlloyDB Cluster
      • Connecting to HDFS
      • Connecting to Looker SQL Interface
      • Loading Excel sheets
      • ๐ŸšงUnderstanding partitioning your data
    • โณTime-to-Live (TTL) and Caching
    • ๐ŸŒทRefreshing a datasource
    • ๐ŸชบManaging your datasets
      • Swapping datasources
    • ๐ŸฃPreparing your datasets
      • ๐ŸคพActions that can be done on a dataset
      • Data Pipeline
      • SQL code snippets
      • โœ๏ธWriteback window
      • ๐ŸงฉEditing Prepare โ†’ Data
      • Handling null or mismatched values
      • Metadata view
      • List of icons and their actions
        • Functions
        • SQL Transform
        • Python Transform
        • Standard Aggregation
        • Creating Hierarchies
      • Dataset Scripting
      • Fusioning your datasets
      • Scheduling refresh for datasets
    • ๐ŸฅPreparing your Business Views
      • ๐ŸŒŸCreate a new Business View
      • Creating calculated columns
      • Creating dynamic parameters
      • Scheduling refresh for Business Views
      • Setting up custom calendars
    • Tellius Engine: Comparison of In-Memory vs. Live Mode
  • Feed
    • ๐Ÿ“ฉWhat is a Feed in Tellius?
    • โ—Alerts on the detection of anomalies
    • ๐Ÿ“ฅViewing and deleting metrics
    • ๐Ÿ–ฒ๏ธTrack a new metric
  • Assistant
    • ๐Ÿ’Introducing Tellius Assistant
    • ๐ŸŽคVoice-based Assistant
    • ๐Ÿ’ฌInteracting with Assistant
    • โ†–๏ธSelecting Business View
  • Embedding Tellius
    • What you should know before embedding
    • Embedding URL
      • ๐Ÿ“ŠEmbedding Vizpads
        • Apply and delete filters
        • Vizpad-related actionTypes
        • Edit, save, and share a Vizpad
        • Keep, remove, drill sections
        • Adding a Viz to a Vizpad
        • Row-level policy filters
      • ๐Ÿ’กEmbedding Insights
        • Creating and Viewing Insights
      • ๐Ÿ”ŽEmbedding Search
        • Search query execution
      • Embedding Assistant
      • ๐Ÿช„Embedding Kaiya
      • Embedding Feed
  • API
    • Insights APIs
    • Search APIs
    • Authentication API (Login API)
  • โœจWhat's New
    • Release 5.4
      • Patch 5.4.0.x
    • Release 5.3
      • Patch 5.3.1
      • Patch 5.3.2
      • Patch 5.3.3
    • Release 5.2
      • Patch 5.2.1
      • Patch 5.2.2
    • Release 5.1
      • Patch 5.1.1
      • Patch 5.1.2
      • Patch 5.1.3
    • Release 5.0
      • Patch 5.0.1
      • Patch 5.0.2
      • Patch 5.0.3
      • Patch 5.0.4
      • Patch 5.0.5
    • Release 4.3 (Fall 2023)
      • Patch 4.3.1
      • Patch 4.3.2
      • Patch 4.3.3
      • Patch 4.3.4
    • Release 4.2
      • Patch 4.2.1
      • Patch 4.2.2
      • Patch 4.2.3
      • Patch 4.2.4
      • Patch 4.2.5
      • Patch 4.2.6
      • Patch 4.2.7
    • Release 4.1
      • Patch 4.1.1
      • Patch 4.1.2
      • Patch 4.1.3
      • Patch 4.1.4
      • Patch 4.1.5
    • Release 4.0
Powered by GitBook
On this page
  • ๐Ÿ“ˆ Enhancements
  • Custom limit for pivot tables
  • ๐Ÿ› ๏ธ Minor fixes

Was this helpful?

Export as PDF
  1. โœจWhat's New
  2. Release 5.1

Patch 5.1.3

PreviousPatch 5.1.2NextRelease 5.0

Last updated 4 days ago

Was this helpful?

ยฉ 2025 Tellius

The 5.1.3 release brings significant enhancements and numerous minor fixes. The key update is the ability to set custom row and column limits when exporting pivot tables, now supporting up to 20,000 data points for greater flexibility. We've also addressed various issues across Feed, Vizpads, Search, and Data preparation, enhancing functionality and ensuring smoother performance.

๐Ÿ“ˆ Enhancements

Custom limit for pivot tables

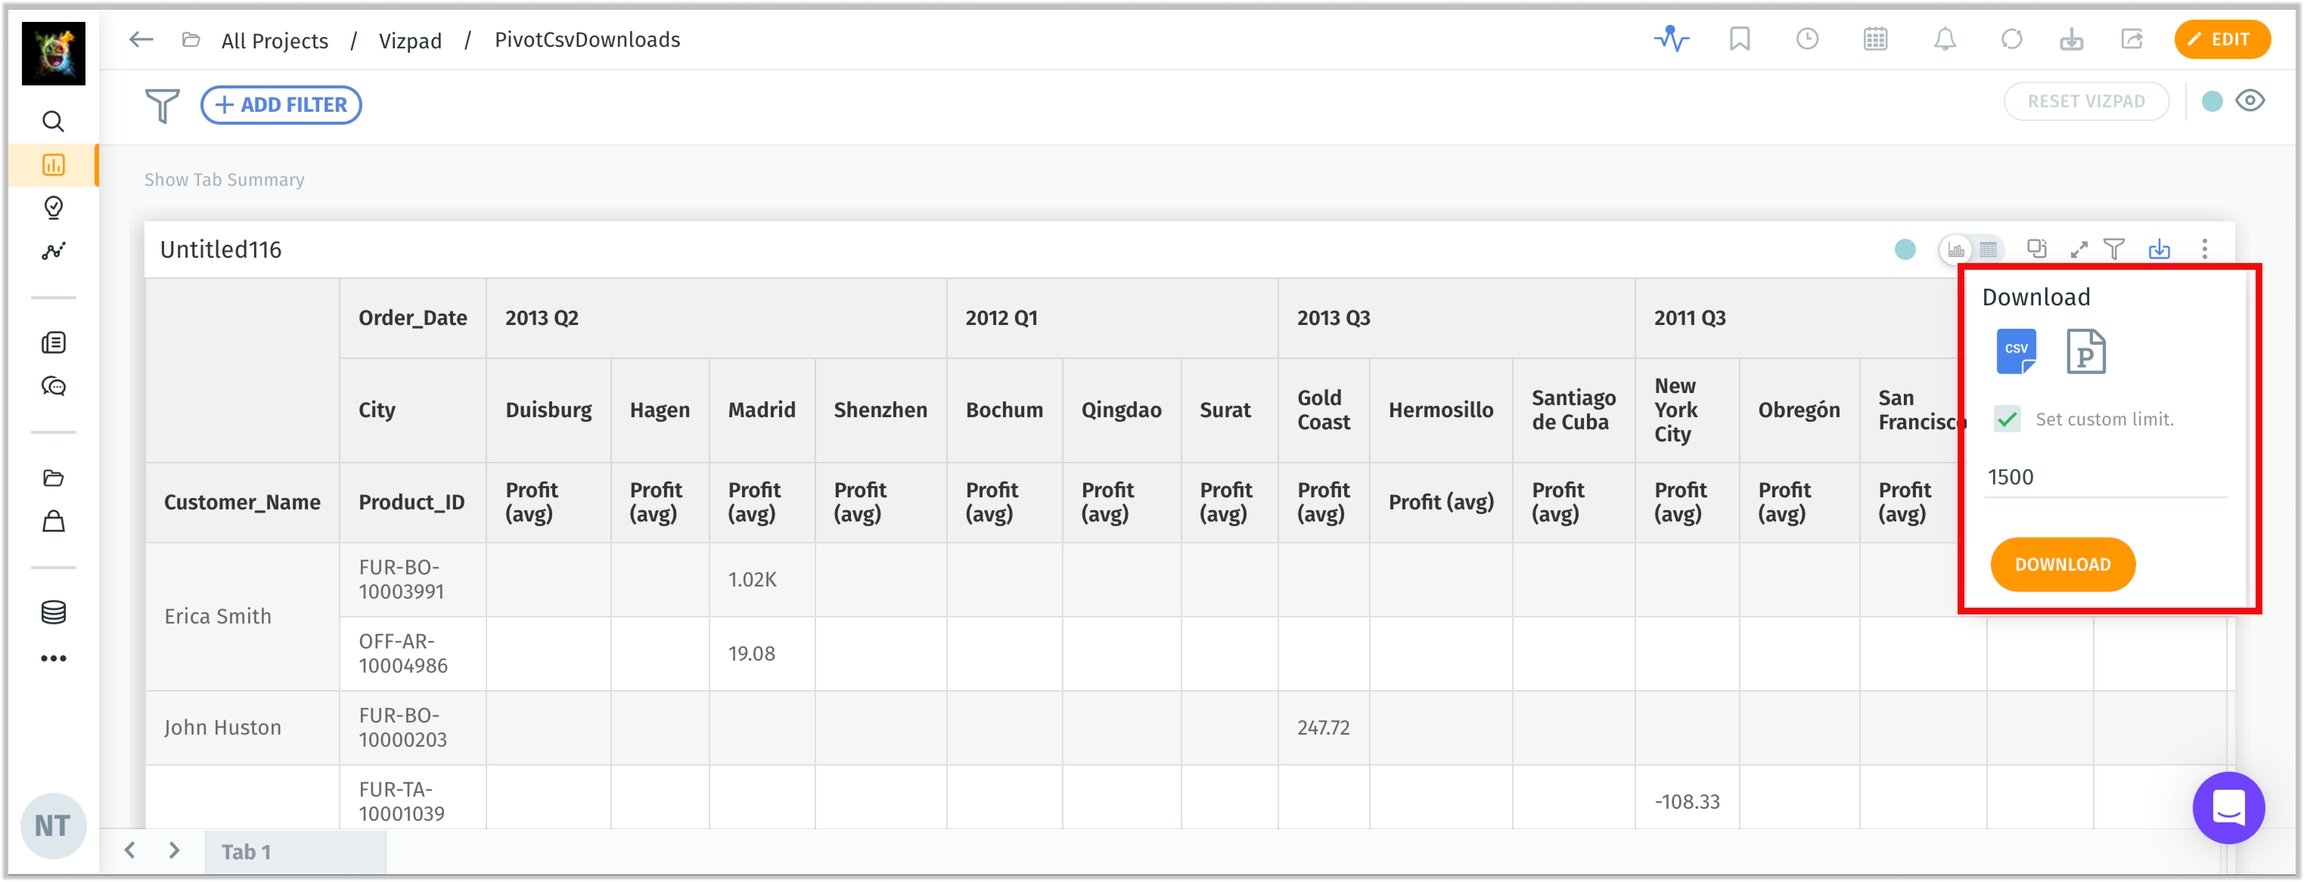
Users can now set custom row and column limits when exporting pivot tables. If a custom limit is specified during the download process, it will override the default UI settings, up to a maximum of 20,000 data points. This enhancement applies to both CSV and XLSX pivot table exports.

Custom row and column limits

๐Ÿ› ๏ธ Minor fixes

  1. In Feed, fixed the โ€œShow Insightโ€ button which was greyed out in embed mode.

  2. In Vizpads, resolved the issue with applying decimal number formatting.

  3. Resolved the issue with capturing usage data for search queries.

  4. In Vizpads, fixed the issue with adding multiple calculated columns with aggregations for tables.

  5. Resolved the issue with generating Feed that was created with weekly aggregation.

  6. In Feed, fixed the issue with applying formatting for the columns used in that particular Feed.

  7. In Vizpads, fixed the issue with displaying the relevant factors after switching between New and Trained Data for explainable AI charts.

  8. In Feed, resolved the issue with hiding Show Insight and displaying Generate Insight while embedding.

  9. Under Data โ†’ Business Views, resolved issues to ensure appropriate access rights for view only users.

  10. In Search, resolved the UI issue with the proper display of date filter window when trying to apply date filters from the measures in the Configuration pane.

  11. Resolved the issue where Feed and Insights were unable to be embedded.

  12. In Vizpads, resolved the issue with retaining the modified table widths after saving the Vizpad.

  13. Resolved the issue with retaining the user-defined aggregation when creating Insights from a Feed.

  14. In Search, fixed the issue with the incorrect display of dates in date picker when applying date filters in Configuration pane.

  15. In Vizpads, resolved an issue where the value 1 and value 2 were swapped in comparisons affecting percentage, absolute, and market share calculations.

  16. In default Search mode, fixed the issue with auto-selecting the relevant Business View.

  17. In the results of Key Driver Insights, resolved the issue with displaying the original column name instead of the display name in the Insights Summary section.

  18. When importing the exported object and trying to map the relevant Business Views and datasources, fixed the issue where calculated columns were getting duplicated.

  19. In Feed, resolved the issue with handling zero or null values.

  20. Under Data โ†’ Prepare โ†’ Scripting, resolved an issue where updating the source of a scripted dataset validated the entire dataset instead of sample data, leading to timeouts.

  21. Under Data โ†’ Business View โ†’ Calculated columns, added a "No rows to show" message when the preview result is empty, informing users when no rows are available.

  22. In Search, fixed the issue where reopening the โ€œHelp Us Learnโ€ popup didnโ€™t retain the time filters mapped and duplicated words to be displayed in the original query text.

  23. In Search history, fixed the issue with retaining the search queries marked as favorite after a page refresh.

  24. Improved the structure and content of Feed alert emails.

  25. In Vizpad charts, resolved an issue where the Y-axis range was not recalculated to include Y-axis target lines or data points outside the current minimum and maximum values.

  26. In Vizpads, fixed the issue with retaining the table cell comments after refresh when moving window calculated columns and date-related columns are present.

  27. In Vizpads, resolved the issue with the global filter pill not synchronized with the multi-select control filters, after cloning the Vizpad.

  28. Resolved an issue where updates to a user's first and last names in the identity provider (IdP) were not reflected in Tellius during subsequent SAML logins if these fields were initially left blank in the first login.

  29. Fixed the issue with generating Insights for Feed created with dimension drilldown.

  30. In Feed, fixed the issue with showcasing display names (instead of the original column names) in the descriptions of Drilldown measures across dimensions.

  31. In Search, fixed the issue where the complex case statements with three or more nested levels weren't working properly, especially in queries used for calculating market share.

  32. Under Data โ†’ Prepare โ†’ Metadata โ†’ Edit, fixed the issue with generating Display names (using Kaiya) for empty cells.

  33. Users can now specify a custom SAML field to map to the username (by default it maps to email) in Tellius. A configuration option allows you to set which SAML attribute should be used as the username during SAML authentication.

  34. In Vizpads, fixed the issue where the โ€œInclude current {time-frame}โ€ checkbox in date picker window not getting reflected as per the toggle made under Settings โ†’ Application Settings โ†’ Time Configuration.