Data Pipeline
A visual roadmap of your data transformations
Last updated
Was this helpful?
A visual roadmap of your data transformations
Last updated
Was this helpful?
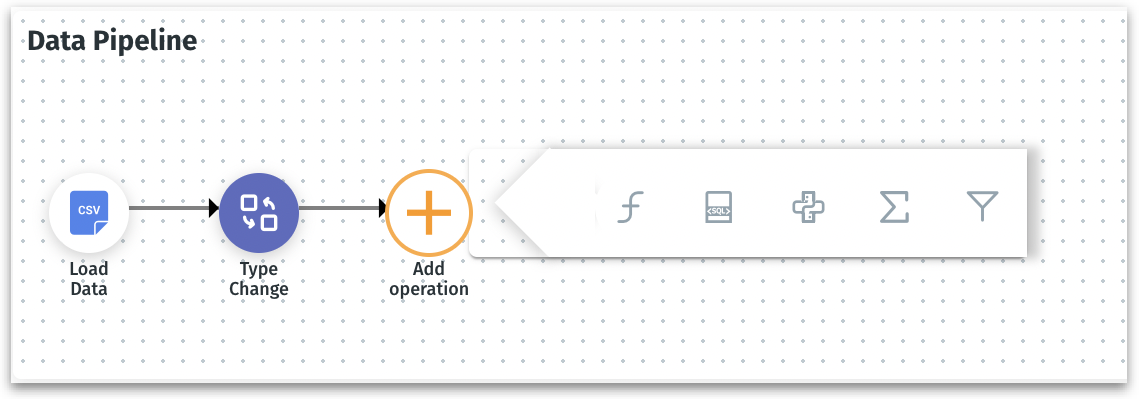
The Data Pipeline is designed to give you a transparent, node-by-node record of every transformation and action performed on your dataset. Each node in the pipeline represents a distinct stepโsuch as loading data, changing column types, or adjusting metadataโmaking it easy to visualize and manage how your data evolves over time.
Data pipeline can be found under Data โ Prepare โ Data and Data โ Prepare โ Metadata, just above the search bar.
Click on the arrow at the far right to expand or collapse the Data Pipeline.
Arrows between nodes show the flow of data from one action to the next, giving a clear picture of how each step depends on the previous ones.
Hover over any node to view the timestamp of the action performed along with the initials of the username who performed that action.
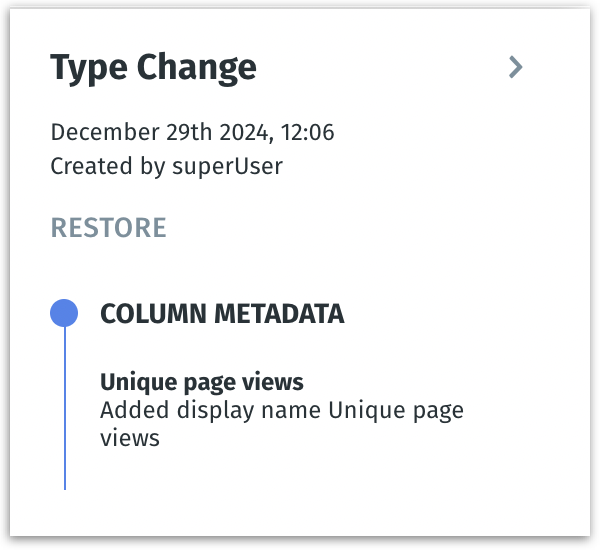
Click on any node, and the right pane will appear, displaying detailed information such as:
Action name (e.g., โType Changeโ)
Timestamp (e.g., December 29, 2024, 12:06)
User who performed the action (e.g., โCreated by superUserโ)
Operation Details (e.g., โAdded display name โUnique page viewsโโ)
The pane includes a Restore button that reverts the pipeline (and thus your dataset) to the state at that step. Once discarded, the pipeline and data revert to the state of the previous node.
Each node effectively stores a snapshot (version control) of the pipeline at that stage. You can restore to a previous state if you need to revert a change.
Add Operation (+) and Restore actions are available only in Edit mode.
From the Data Pipeline, you can also click on Add Operation (+) button to perform new actions. For more details about the actions displayed, check out section.