Tellius
  • ๐ŸšฉGetting Started
    • ๐Ÿ‘‹Say Hello to Tellius
      • Glossary
      • Tellius 101
      • Navigating around Tellius
      • Guided tours for quick onboarding
    • โšกQuick Start Guides
      • Search
      • Vizpads (Explore)
      • Insights (Discover)
    • โœ…Best Practices
      • Search
      • Vizpads (Explore)
      • Insights (Discover)
      • Predict
      • Data
    • โฌ‡๏ธInitial Setup
      • Tellius architecture
      • System requirements
      • Installation steps for Tellius
      • Customizing Tellius
    • Universal Search
    • ๐Ÿ Tellius Home Page
  • Kaiya
    • โ™Ÿ๏ธUnderstanding AI Agents & Agentic Flows
      • Glossary
      • Composer
      • ๐Ÿ—๏ธTriggering an agentic workflow
      • The art of possible
      • Setting up LLM for Kaiya
    • ๐ŸคนKaiya conversational AI
      • โ“FAQs on Kaiya Conversations
      • Triggering Insights with "Why" questions
      • Mastering Kaiya conversational AI
  • ๐Ÿ”Search
    • ๐Ÿ‘‹Get familiar with our Search interface
    • ๐Ÿค”Understanding Tellius Search
    • ๐Ÿ“Search Guide
    • ๐Ÿš€Executing a search query
      • Selecting a Business View
      • Typing a search query
      • Constructing effective search queries
      • Marketshare queries
    • ๐Ÿ”‘Analyzing search results
      • Understanding search results
      • Search Inspector
      • Time taken to execute a query
      • Interacting with the resulting chart
    • ๐Ÿ“ŠKnow your charts in Tellius
      • Understanding Tellius charts
      • Variations of a chart type
      • Building charts from Configuration pane
      • List of chart-specific fields
      • Adding columns to fields in Configuration pane
      • Absolute and percentage change aggregations
      • Requirements of charts
      • Switching to another chart
      • Formatting charts
      • Advanced Analytics
      • Cumulative line chart
    • ๐Ÿง‘โ€๐ŸซHelp Tellius learn
    • ๐Ÿ•ต๏ธโ€โ™‚๏ธSearch history
    • ๐ŸŽ™๏ธVoice-driven search
    • ๐Ÿ”ดLive Query mode
  • ๐Ÿ“ˆVizpads (Explore)
    • ๐Ÿ™‹Meet Vizpads!
    • ๐Ÿ‘‹Get familiar with our Vizpads
    • #๏ธโƒฃMeasures, dimensions, date columns
    • โœจCreating Vizpads
    • ๐ŸŒApplying global filters
      • Filters in multi-BV Vizpads
      • Filters using common columns
    • ๐Ÿ“ŒApplying local filters
    • ๐Ÿ“…Date picker in filters
      • Customizing the calendar view
    • โœ…Control filters
      • Multi-select list
      • Single-select list
      • Range slider
      • Dropdown list
    • ๐Ÿ‘๏ธActions in View mode
      • Interacting with the charts
    • ๐Ÿ“Actions in Edit mode
      • ๐Ÿ—จ๏ธViz-level actions
    • ๐Ÿ”งAnomaly management for line charts
      • Instance level
      • Vizpad level
      • Chart level
    • โณTime taken to load a chart
      • Instance level
      • Vizpad level
      • Chart level
    • โ™Ÿ๏ธWorking with sample datasets
    • ๐Ÿ”Swapping Business View of charts
      • Swapping only the current Vizpad
      • Swapping multiple objects
      • Configuring the time of swap
    • ๐Ÿค–Explainable AI charts
  • ๐Ÿ’กInsights (Discover)
    • ๐Ÿ‘‹Get familiar with our Insights
    • โ“Understanding the types of Insights
    • ๐Ÿ•ต๏ธโ€โ™‚๏ธDiscovery Insights
    • โž•How to create new Insights
      • ๐Ÿ”›Creating Discovery Insight
      • ๐Ÿ”‘Creating Key Driver Insights
      • ใ€ฐ๏ธCreating Trend Insights
      • ๐Ÿ‘ฏCreating Comparison Insights
    • ๐ŸงฎThe art of selecting columns for Insights
      • โžก๏ธHow to include/exclude columns?
  • ๐Ÿ”ขData
    • ๐Ÿ‘‹Get familiar with our Data module
    • ๐Ÿฅ‚Connect
    • ๐ŸชนCreate new datasource
      • Connecting to Oracle database
      • Connecting to MySQL database
      • Connecting to MS SQL database
      • Connecting to Postgres SQL database
      • Connecting to Teradata
      • Connecting to Redshift
      • Connecting to Hive
      • Connecting to Azure Blob Storage
      • Connecting to Spark SQL
      • Connecting to generic JDBC
      • Connecting to Salesforce
      • Connecting to Google cloud SQL
        • Connecting to a PostgreSQL cloud SQL instance
        • Connecting to an MSSQL cloud SQL instance
        • Connecting to a MySQL Cloud SQL Instance
      • Connecting to Amazon S3
      • Connecting to Google BigQuery
        • Steps to connect to a Google BigQuery database
      • Connecting to Snowflake
        • OAuth support for Snowflake
        • Integrating Snowflake with Azure AD via OAuth
        • Integrating Snowflake with Okta via OAuth
        • Azure PrivateLink
        • AWS PrivateLink
        • Best practices
      • Connecting to Databricks
      • Connecting to Databricks Delta Lake
      • Connecting to an AlloyDB Cluster
      • Connecting to HDFS
      • Connecting to Looker SQL Interface
      • Loading Excel sheets
      • ๐ŸšงUnderstanding partitioning your data
    • โณTime-to-Live (TTL) and Caching
    • ๐ŸŒทRefreshing a datasource
    • ๐ŸชบManaging your datasets
      • Swapping datasources
    • ๐ŸฃPreparing your datasets
      • ๐ŸคพActions that can be done on a dataset
      • Data Pipeline
      • SQL code snippets
      • โœ๏ธWriteback window
      • ๐ŸงฉEditing Prepare โ†’ Data
      • Handling null or mismatched values
      • Metadata view
      • List of icons and their actions
        • Functions
        • SQL Transform
        • Python Transform
        • Standard Aggregation
        • Creating Hierarchies
      • Dataset Scripting
      • Fusioning your datasets
      • Scheduling refresh for datasets
    • ๐ŸฅPreparing your Business Views
      • ๐ŸŒŸCreate a new Business View
      • Creating calculated columns
      • Creating dynamic parameters
      • Scheduling refresh for Business Views
      • Setting up custom calendars
    • Tellius Engine: Comparison of In-Memory vs. Live Mode
  • Feed
    • ๐Ÿ“ฉWhat is a Feed in Tellius?
    • โ—Alerts on the detection of anomalies
    • ๐Ÿ“ฅViewing and deleting metrics
    • ๐Ÿ–ฒ๏ธTrack a new metric
  • Assistant
    • ๐Ÿ’Introducing Tellius Assistant
    • ๐ŸŽคVoice-based Assistant
    • ๐Ÿ’ฌInteracting with Assistant
    • โ†–๏ธSelecting Business View
  • Embedding Tellius
    • What you should know before embedding
    • Embedding URL
      • ๐Ÿ“ŠEmbedding Vizpads
        • Apply and delete filters
        • Vizpad-related actionTypes
        • Edit, save, and share a Vizpad
        • Keep, remove, drill sections
        • Adding a Viz to a Vizpad
        • Row-level policy filters
      • ๐Ÿ’กEmbedding Insights
        • Creating and Viewing Insights
      • ๐Ÿ”ŽEmbedding Search
        • Search query execution
      • Embedding Assistant
      • ๐Ÿช„Embedding Kaiya
      • Embedding Feed
  • API
    • Insights APIs
    • Search APIs
    • Authentication API (Login API)
  • โœจWhat's New
    • Release 5.4
      • Patch 5.4.0.x
    • Release 5.3
      • Patch 5.3.1
      • Patch 5.3.2
      • Patch 5.3.3
    • Release 5.2
      • Patch 5.2.1
      • Patch 5.2.2
    • Release 5.1
      • Patch 5.1.1
      • Patch 5.1.2
      • Patch 5.1.3
    • Release 5.0
      • Patch 5.0.1
      • Patch 5.0.2
      • Patch 5.0.3
      • Patch 5.0.4
      • Patch 5.0.5
    • Release 4.3 (Fall 2023)
      • Patch 4.3.1
      • Patch 4.3.2
      • Patch 4.3.3
      • Patch 4.3.4
    • Release 4.2
      • Patch 4.2.1
      • Patch 4.2.2
      • Patch 4.2.3
      • Patch 4.2.4
      • Patch 4.2.5
      • Patch 4.2.6
      • Patch 4.2.7
    • Release 4.1
      • Patch 4.1.1
      • Patch 4.1.2
      • Patch 4.1.3
      • Patch 4.1.4
      • Patch 4.1.5
    • Release 4.0
Powered by GitBook

ยฉ 2025 Tellius

On this page
  • Statistics
  • Filter (Edit mode)
  • Sorting
  • Transforming a column

Was this helpful?

Export as PDF
  1. Data
  2. Preparing your datasets

Editing Prepare โ†’ Data

Performing preliminary transformations to your datasets

PreviousWriteback windowNextHandling null or mismatched values

Last updated 4 months ago

Was this helpful?

Under Prepare โ†’ Data, you can validate data accuracy, review columns, see row distribution, perform preliminary transformations (in Edit mode).

Statistics
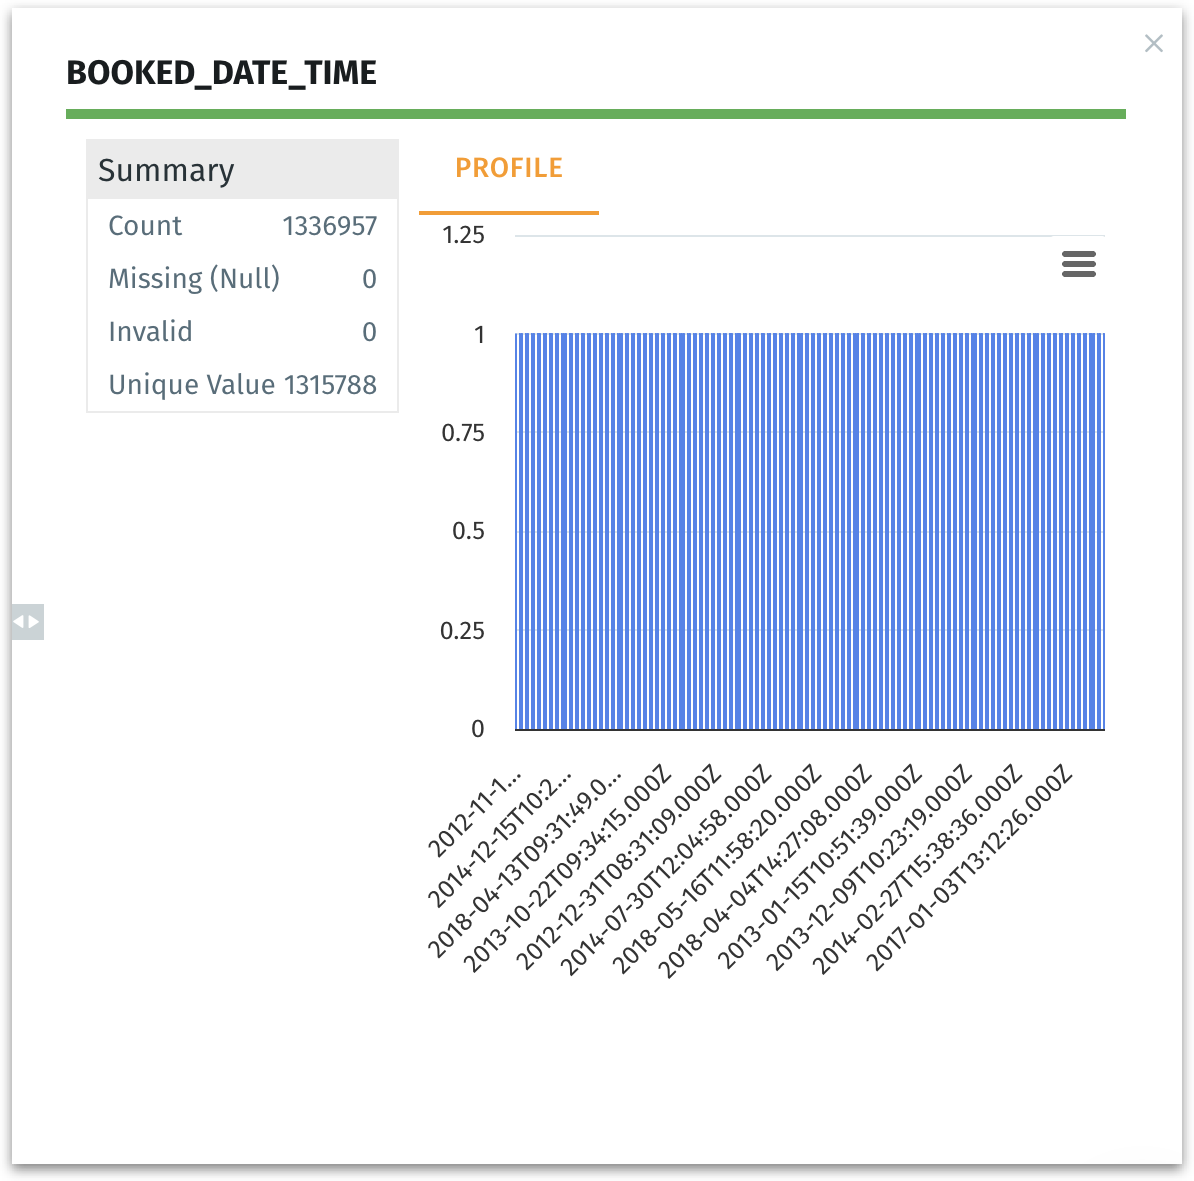
  1. Lets you access column-level statistics displaying summary metrics and a quick visualization of the columnโ€™s distribution.

  2. Below the column name, you can find a green colored bar indicating the columnโ€™s recognized data type (e.g., date/time, numeric, or string). Hovering over the bar displays "Main type: string 100.00%โ€ which tells you that every single row (100% of values) fits that text/string patternโ€”there are no exceptions detected that might suggest a numeric or date/time type.

  • Count: Total number of rows inspected

  • Missing (NULL): Number of records with no value in this column

  • Invalid: Number of entries that do not conform to the columnโ€™s data type

  • Unique Value: How many distinct values appear in the column

If the โ€œMissingโ€ or โ€œInvalidโ€ counts are unexpectedly high, you may need to transform or cleanse your data (e.g., converting strings to dates, filling nulls).

A high uniqueness count relative to total rows suggests this column might be a candidate for a primary key or near-unique identifier.

  1. A quick visualization on the right shows how the data is distributed.

    1. Helps you to instantly gauge whether data is uniformly distributed or if certain ranges cluster heavily.

    2. Spot potential anomaliesโ€”e.g., if you see a spike in certain months or a total gap in a given time range.

  2. In the above example, each vertical blue bar represents a set of date/time values plotted on an X-axis. The X-axis labels can appear bunched if the dataset is large or if date values are extremely granular. Hovering over may clarify the distribution.

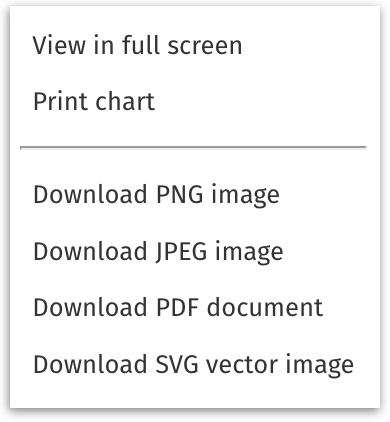
  3. Click on the burger menu icon above the chart to view the following menu. Here, you can,

  • View the chart in full screen

  • Print the chart

  • Download the image (as PNG, JPEG, PDF, or SVG)
Filter (Edit mode)
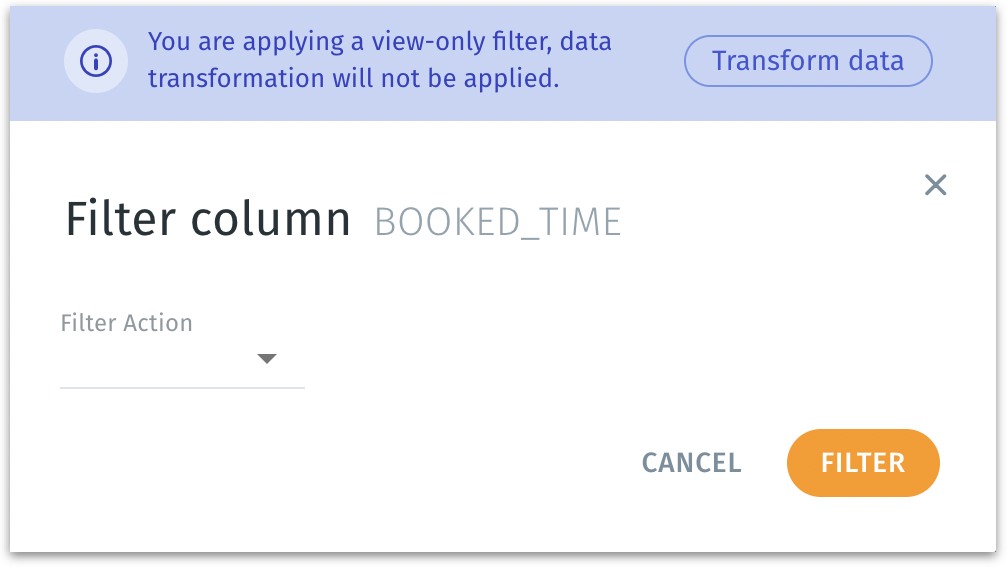
  1. Click on the Filter icon and the above image will be displayed. This filter does not modify the dataset pipeline or permanently remove rows. Instead, itโ€™s a quick filter for on-screen data inspectionโ€”youโ€™re basically hiding certain rows in the immediate view without altering the underlying dataset.

  2. If you do want to permanently remove or transform rows in the actual pipeline, you can click โ€œTransform dataโ€ to switch modes and the following window will be displayed.

  1. Unlike the view-only filter, applying a filter here alters the dataset in your pipeline or script. Rows that do not meet the condition are permanently removed from the dataset version thatโ€™s being prepared.

  2. The โ€œ+โ€ icon lets you add further filter clauses (e.g., โ€œColumn A > 10โ€ AND โ€œColumn B = โ€˜XYZโ€™โ€).

  3. The transformation is saved in the pipeline. If you publish these changes, the dataset reloads with rows excluded per your filter logic.

If you do โ€œTransform dataโ€, youโ€™ll see an updated step in your pipeline, and you may need to re-publish or validate.

If you do a โ€œView-Onlyโ€ filter, no pipeline changes occur, and you wonโ€™t see new steps added. The dataset reverts to normal after you exit or clear the filter.

Sorting

  1. Click on the โ†“ icon to sort the column data in ascending order.

  2. Click on the โฌ† icon to sort the column data in descending order.

Transforming a column

Click on any required column name, and you can view the following menu. These transform tools allow you to refine and reshape columns in various waysโ€”whether adjusting data types, altering text, or performing merges and splits.
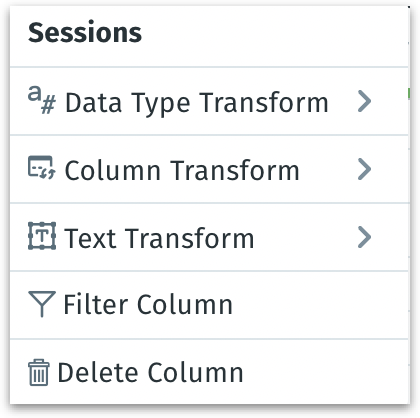
Data Type Transform

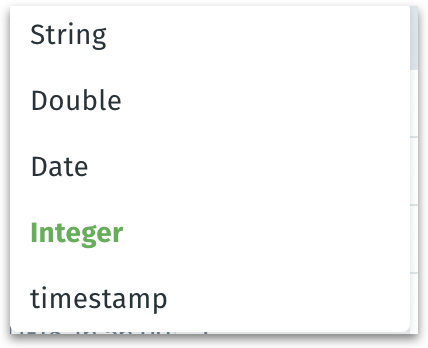
This submenu lets you convert a columnโ€™s data type. Here are the options:

  • String: Interprets the column as textual data (e.g., โ€œABC123โ€).

  • Double: Interprets the column as floating-point numeric type (e.g., 3.14159). Use if you need decimal precision or have fractional values.

  • Date: Interprets the column as a date (YYYY-MM-DD) without a time component.

  • Integer: Interprets the column as whole numbers only (e.g., 42).

  • Timestamp: Includes both date and time details. Use if you have data like 2023-01-15 10:25:00 or an ISO-8601 string (2023-01-15T10:25:00Z).

Column Transform

This submenu is for general transformations (not strictly text-based). Options include:
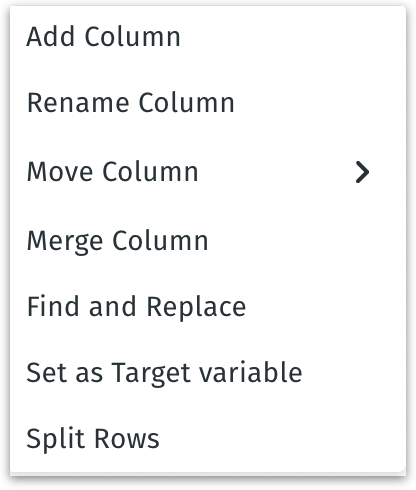
  • Add Column: Creates a new empty column.

  • Rename Column: Changes the actual column name.

You can change the name of a column in your dataset but doing so might cause issues, such as breaking existing connections or processes that depend on the current column name. To avoid these risks, use "Display Name" as an alternative, which lets you show a different name without actually renaming the column itself.

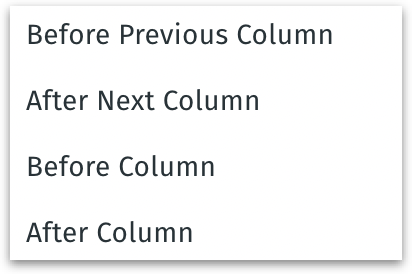
  • Move Column: Reorder columns in the dataset (e.g., bring an important column to the front). This has sub-options like Before previous column, After next column, Before column, and After column.
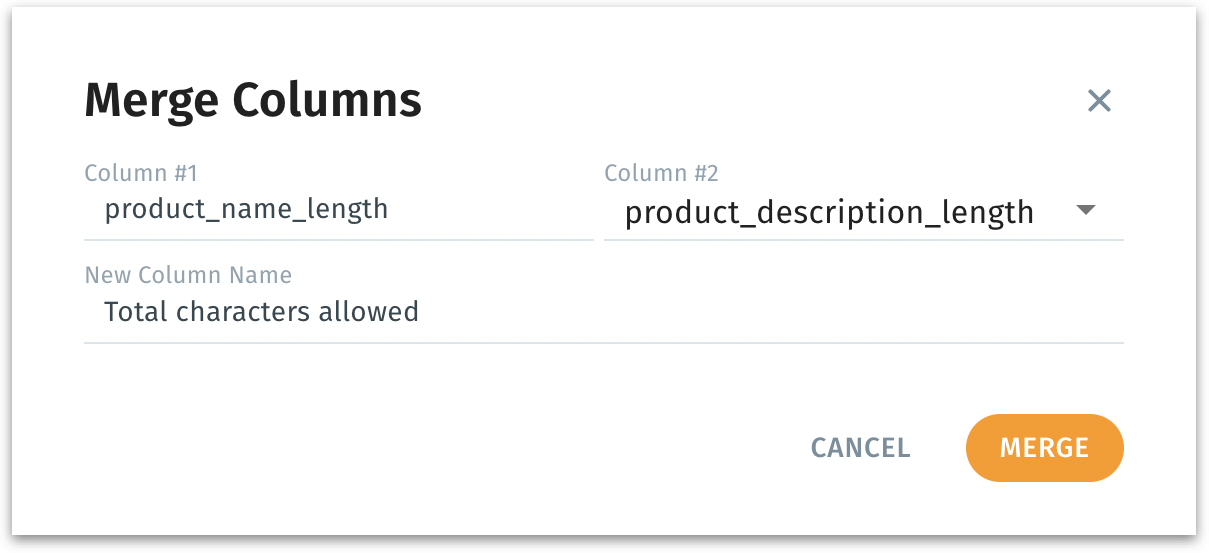
  • Merge column: Combine two columns into oneโ€”often used to concatenate strings (e.g., FirstName + LastName) or unify numeric fields. Here, you specify another column to merge and provide a name to the newly merged column.
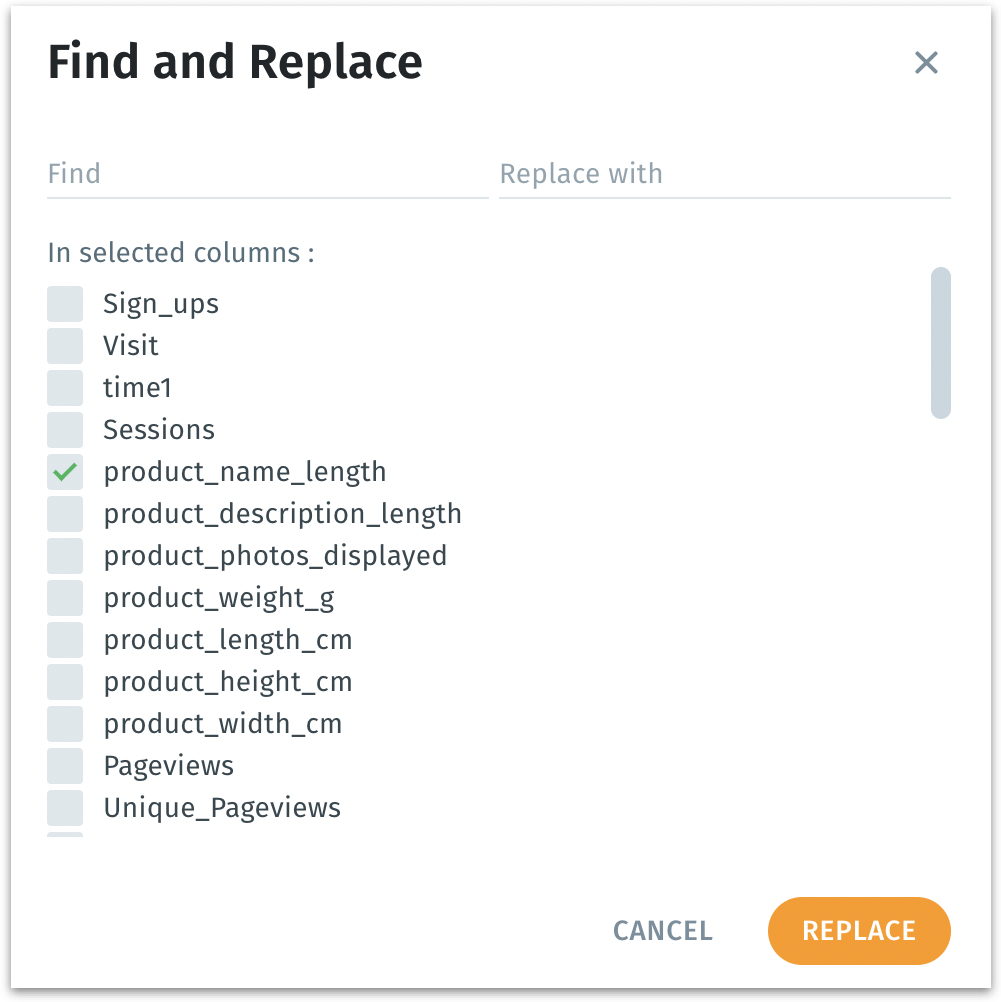
  • Find and Replace: Search for specific text or patterns in the selected column and replace them with something else.
  • Set as Target variable: Usually relevant for ML or predictive analytics tasks. Incdicates that this column is the outcome variable (label) for training a model.

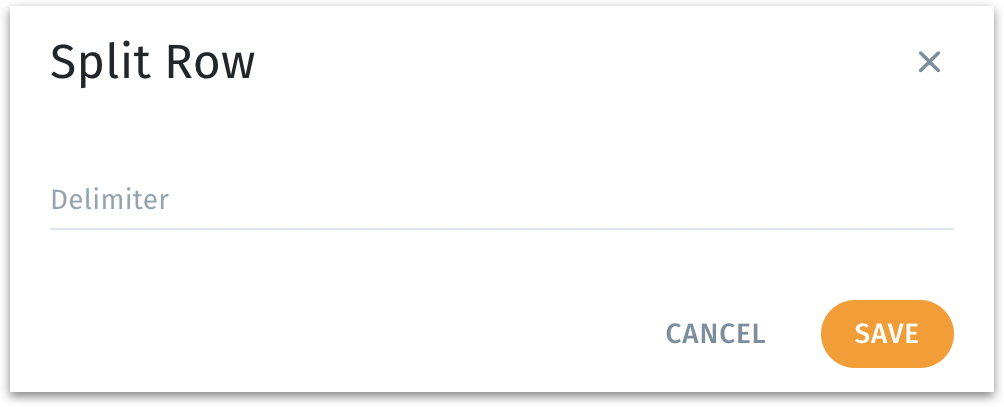
  • Split Rows: Splits each row of data if it contains multiple, line-delimited items. If a single cell has multiple lines or values separated by line breaks, this transforms them into multiple rows. The Delimiter field specifies the exact character or substring used to identify where to break a single row into multiple rows.
Text Transform

If your dataset contains textual columns you want to analyze, these transformations help standardize or clean the text for better search, NLP, or machine learning outcomes.

  • Upper case: Converts the entire columnโ€™s text to upper case (e.g., abc โ†’ ABC).

  • Lower case: Converts all text to lower case (e.g., ABC โ†’ abc).

  • Remove stop words: Removes common filler words from text (e.g., โ€œthe,โ€ โ€œand,โ€ โ€œofโ€), often used in NLP or text analytics.

  • Stem: Applies a stemming algorithm (e.g., Porter stemmer) to reduce words to their base form (e.g., โ€œrunning,โ€ โ€œruns,โ€ โ€œranโ€ โ†’ โ€œrunโ€). Often used to group word variants.

Filter Column

Delete Column

Permanently removes the selected column from the dataset pipeline.

Same as the filter explained .

๐Ÿ”ข
๐Ÿฃ
๐Ÿงฉ
above
Statistics window
Statistics chart menu
Filtering column (View-only)
Advanced filters (Transforms actual data)
Transforming a column
Data type transform
Column transform option
Move column
Merge columns
Find and replace
Split row window
Filter column