Handling null or mismatched values
Handle missing or inconsistent data in Tellius by dropping rows, replacing nulls with mean or fixed values, and reconciling mismatched column types.
A colored bar (usually, green or red) below the column name indicates the percentage of data found in the column’s recognized data type (e.g., date/time, numeric, or string).

For example, when you hover over the colored bar in the column stats pop-up and it reads “Main type (type:string) 100.00%,” it indicates that all the values in that column conform to the “string” classification—there are no exceptions detected. If some values were recognized as non-numeric, you might see a different percentage.
Handling null values
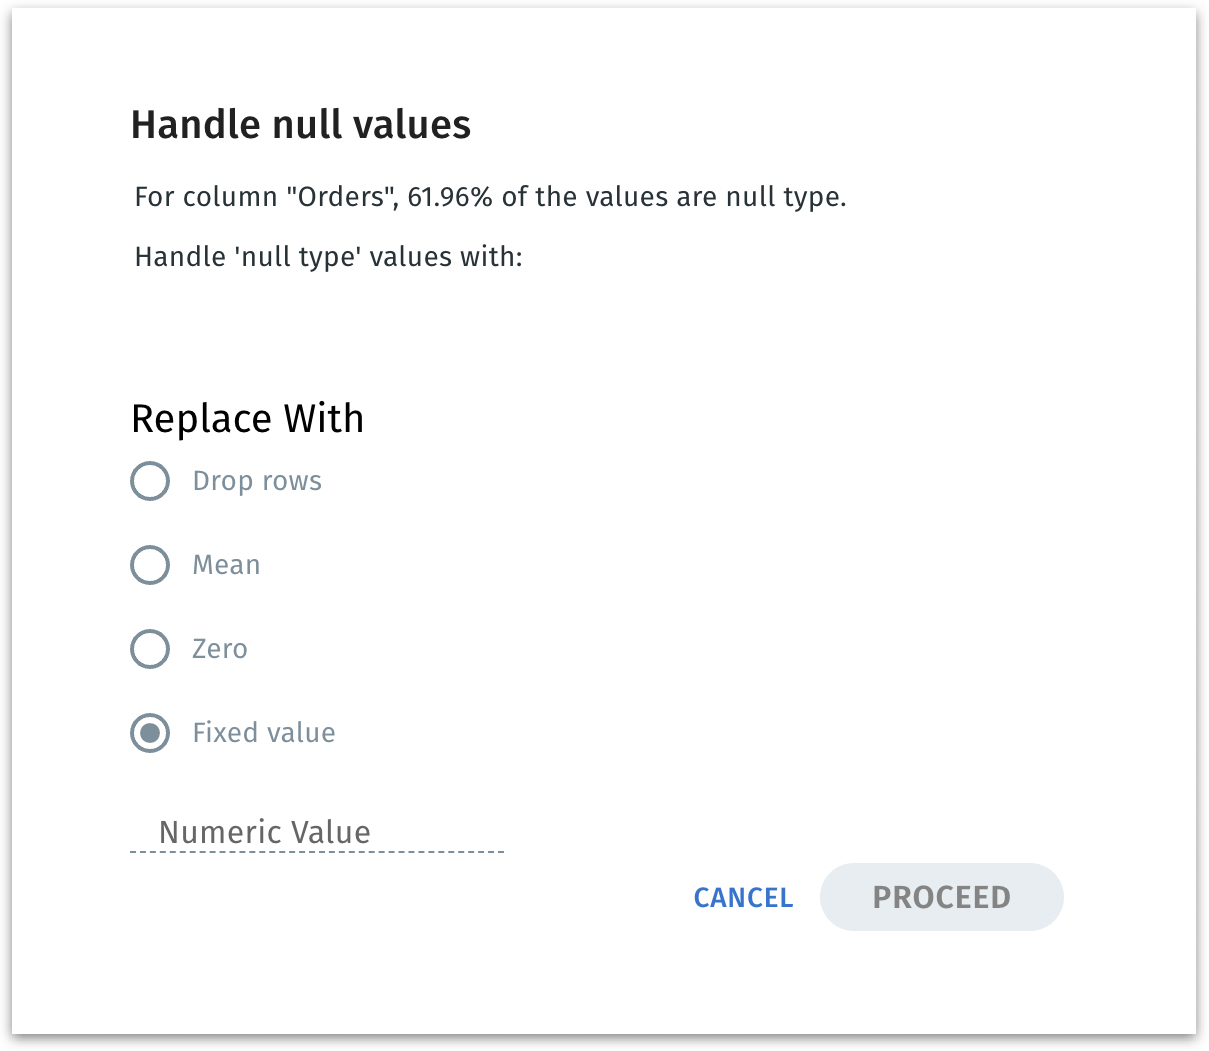
This “Handle null values” window helps you decide how to treat missing numeric data. Handling nulls prevents analytics or machine learning models from crashing or producing skewed results. You can choose the strategy (drop, mean, zero, or custom) that best suits your data’s context.
Upon clicking the info icon near the column name, you can see the following window:

For non-numeric column types (such as string and timestamp), only "Drop rows" and "Fixed value" options will be displayed.
This window shows you how to deal with missing (null) numeric values in that column, offering several methods of replacement or removal:
Drop Rows
Removes any rows in the dataset where this column is null.
If nulls are sparse (like 0.12% of data) and these records aren’t critical to your analysis.
However, too many drops can shrink your dataset significantly if nulls are more common.
Mean
Replaces each null value with the average of the non-null entries in that column.
However, the mean might not be meaningful if the distribution is highly skewed or if outliers heavily affect the average.
Zero: Replaces nulls with the numeric value 0 (zero).
Fixed Value: Replaces null values with a custom numeric you specify (e.g., 9999, 100, etc.).
Handling mismatched values
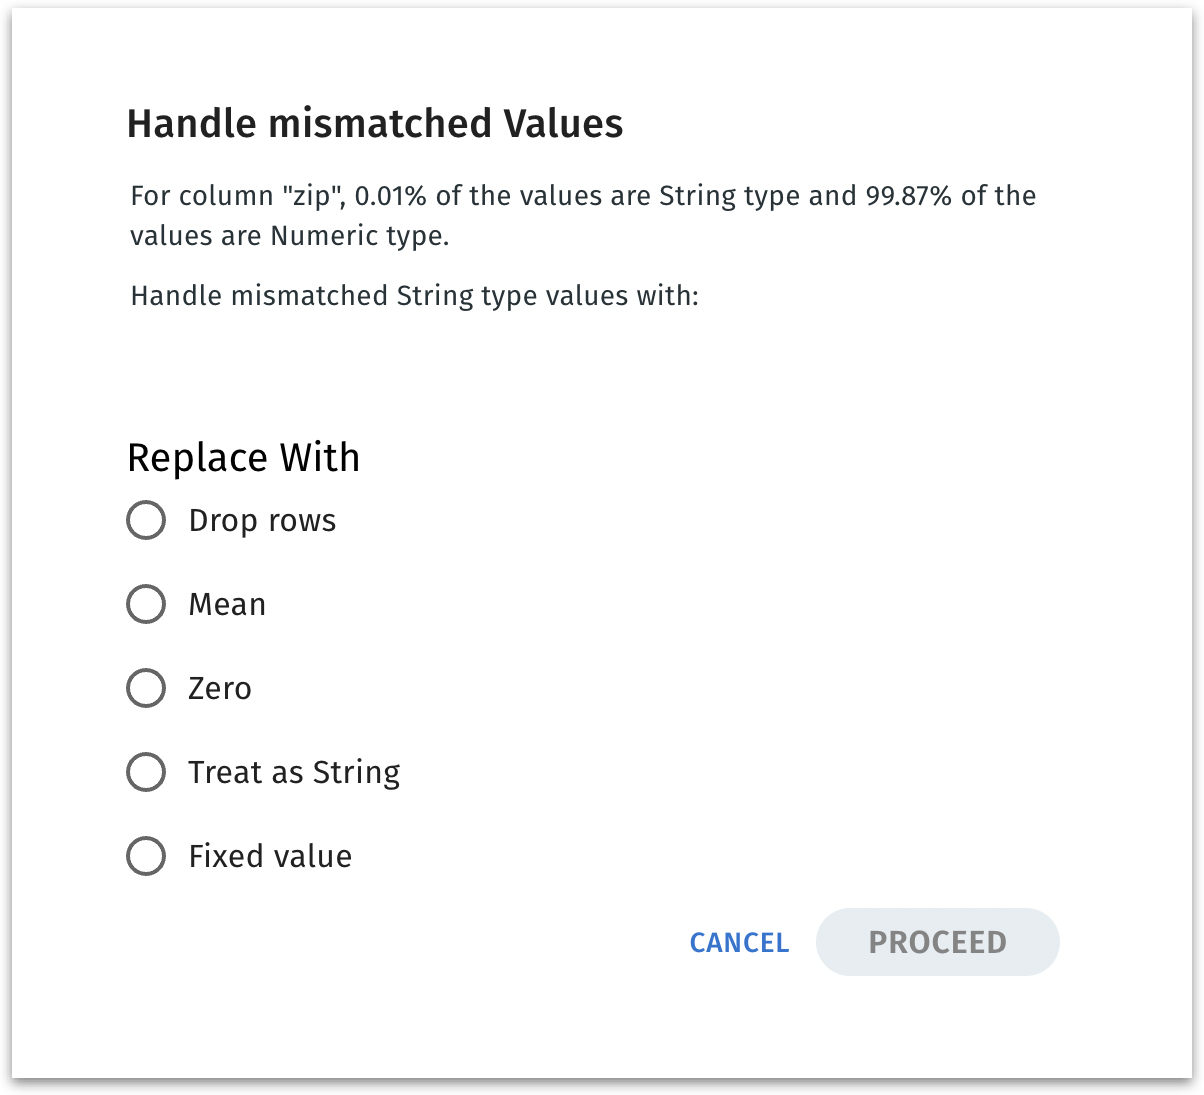
Mismatched values happen when a column has a handful of entries that do not conform to the assigned column type. Addressing them ensures the column is consistent—critical for aggregations, data quality, and subsequent analytics or modeling.
Columns with mismatched values can be idenitifed with the red info icon near the column name and the bar below the column name will be red in color. Click on the red icon to reconcile those outliers with the column’s primary data type. The following window appears:

Drop rows:
Removes any rows where the column value is the wrong type.
Helpful if mismatches are extremely rare (like 0.01%) and you prefer a strictly numeric dataset with no placeholders.
Mean
Computes the column’s average from non-mismatched rows, then replaces each outlier with that mean.
When you want to preserve row count and approximate the missing value with the column’s average.
Zero: Replaces mismatched string entries with
0.0.Treat as String: Changes the entire column’s type to string, ignoring numeric logic. The numeric values become text.
Fixed value: Replaces mismatched string entries with a custom numeric constant you specify.
Was this helpful?