Tellius
  • 🚩Getting Started
    • 👋Say Hello to Tellius
      • Glossary
      • Tellius 101
      • Navigating around Tellius
      • Guided tours for quick onboarding
    • ⚡Quick Start Guides
      • Search
      • Vizpads (Explore)
      • Insights (Discover)
    • ✅Best Practices
      • Search
      • Vizpads (Explore)
      • Insights (Discover)
      • Predict
      • Data
    • ⬇️Initial Setup
      • Tellius architecture
      • System requirements
      • Installation steps for Tellius
      • Customizing Tellius
    • Universal Search
    • 🏠Tellius Home Page
  • Kaiya
    • ♟️Understanding AI Agents & Agentic Flows
      • Glossary
      • Composer
      • 🗝️Triggering an agentic workflow
      • The art of possible
      • Setting up LLM for Kaiya
    • 🤹Kaiya conversational AI
      • ❓FAQs on Kaiya Conversations
      • Triggering Insights with "Why" questions
      • Mastering Kaiya conversational AI
  • 🔍Search
    • 👋Get familiar with our Search interface
    • 🤔Understanding Tellius Search
    • 📍Search Guide
    • 🚀Executing a search query
      • Selecting a Business View
      • Typing a search query
      • Constructing effective search queries
      • Marketshare queries
    • 🔑Analyzing search results
      • Understanding search results
      • Search Inspector
      • Time taken to execute a query
      • Interacting with the resulting chart
    • 📊Know your charts in Tellius
      • Understanding Tellius charts
      • Variations of a chart type
      • Building charts from Configuration pane
      • List of chart-specific fields
      • Adding columns to fields in Configuration pane
      • Absolute and percentage change aggregations
      • Requirements of charts
      • Switching to another chart
      • Formatting charts
      • Advanced Analytics
      • Cumulative line chart
    • 🧑‍🏫Help Tellius learn
    • 🕵️‍♂️Search history
    • 🎙️Voice-driven search
    • 🔴Live Query mode
  • 📈Vizpads (Explore)
    • 🙋Meet Vizpads!
    • 👋Get familiar with our Vizpads
    • #️⃣Measures, dimensions, date columns
    • ✨Creating Vizpads
    • 🌐Applying global filters
      • Filters in multi-BV Vizpads
      • Filters using common columns
    • 📌Applying local filters
    • 📅Date picker in filters
      • Customizing the calendar view
    • ✅Control filters
      • Multi-select list
      • Single-select list
      • Range slider
      • Dropdown list
    • 👁️Actions in View mode
      • Interacting with the charts
    • 📝Actions in Edit mode
      • 🗨️Viz-level actions
    • 🔧Anomaly management for line charts
      • Instance level
      • Vizpad level
      • Chart level
    • ⏳Time taken to load a chart
      • Instance level
      • Vizpad level
      • Chart level
    • ♟️Working with sample datasets
    • 🔁Swapping Business View of charts
      • Swapping only the current Vizpad
      • Swapping multiple objects
      • Configuring the time of swap
    • 🤖Explainable AI charts
  • 💡Insights (Discover)
    • 👋Get familiar with our Insights
    • ❓Understanding the types of Insights
    • 🕵️‍♂️Discovery Insights
    • ➕How to create new Insights
      • 🔛Creating Discovery Insight
      • 🔑Creating Key Driver Insights
      • 〰️Creating Trend Insights
      • 👯Creating Comparison Insights
    • 🧮The art of selecting columns for Insights
      • ➡️How to include/exclude columns?
  • 🔢Data
    • 👋Get familiar with our Data module
    • 🥂Connect
    • 🪹Create new datasource
      • Connecting to Oracle database
      • Connecting to MySQL database
      • Connecting to MS SQL database
      • Connecting to Postgres SQL database
      • Connecting to Teradata
      • Connecting to Redshift
      • Connecting to Hive
      • Connecting to Azure Blob Storage
      • Connecting to Spark SQL
      • Connecting to generic JDBC
      • Connecting to Salesforce
      • Connecting to Google cloud SQL
        • Connecting to a PostgreSQL cloud SQL instance
        • Connecting to an MSSQL cloud SQL instance
        • Connecting to a MySQL Cloud SQL Instance
      • Connecting to Amazon S3
      • Connecting to Google BigQuery
        • Steps to connect to a Google BigQuery database
      • Connecting to Snowflake
        • OAuth support for Snowflake
        • Integrating Snowflake with Azure AD via OAuth
        • Integrating Snowflake with Okta via OAuth
        • Azure PrivateLink
        • AWS PrivateLink
        • Best practices
      • Connecting to Databricks
      • Connecting to Databricks Delta Lake
      • Connecting to an AlloyDB Cluster
      • Connecting to HDFS
      • Connecting to Looker SQL Interface
      • Loading Excel sheets
      • 🚧Understanding partitioning your data
    • ⏳Time-to-Live (TTL) and Caching
    • 🌷Refreshing a datasource
    • 🪺Managing your datasets
      • Swapping datasources
    • 🐣Preparing your datasets
      • 🤾Actions that can be done on a dataset
      • Data Pipeline
      • SQL code snippets
      • ✍️Writeback window
      • 🧩Editing Prepare → Data
      • Handling null or mismatched values
      • Metadata view
      • List of icons and their actions
        • Functions
        • SQL Transform
        • Python Transform
        • Standard Aggregation
        • Creating Hierarchies
      • Dataset Scripting
      • Fusioning your datasets
      • Scheduling refresh for datasets
    • 🐥Preparing your Business Views
      • 🌟Create a new Business View
      • Creating calculated columns
      • Creating dynamic parameters
      • Scheduling refresh for Business Views
      • Setting up custom calendars
    • Tellius Engine: Comparison of In-Memory vs. Live Mode
  • Feed
    • 📩What is a Feed in Tellius?
    • ❗Alerts on the detection of anomalies
    • 📥Viewing and deleting metrics
    • 🖲️Track a new metric
  • Assistant
    • 💁Introducing Tellius Assistant
    • 🎤Voice-based Assistant
    • 💬Interacting with Assistant
    • ↖️Selecting Business View
  • Embedding Tellius
    • What you should know before embedding
    • Embedding URL
      • 📊Embedding Vizpads
        • Apply and delete filters
        • Vizpad-related actionTypes
        • Edit, save, and share a Vizpad
        • Keep, remove, drill sections
        • Adding a Viz to a Vizpad
        • Row-level policy filters
      • 💡Embedding Insights
        • Creating and Viewing Insights
      • 🔎Embedding Search
        • Search query execution
      • Embedding Assistant
      • 🪄Embedding Kaiya
      • Embedding Feed
  • API
    • Insights APIs
    • Search APIs
    • Authentication API (Login API)
  • ✨What's New
    • Release 5.4
      • Patch 5.4.0.x
    • Release 5.3
      • Patch 5.3.1
      • Patch 5.3.2
      • Patch 5.3.3
    • Release 5.2
      • Patch 5.2.1
      • Patch 5.2.2
    • Release 5.1
      • Patch 5.1.1
      • Patch 5.1.2
      • Patch 5.1.3
    • Release 5.0
      • Patch 5.0.1
      • Patch 5.0.2
      • Patch 5.0.3
      • Patch 5.0.4
      • Patch 5.0.5
    • Release 4.3 (Fall 2023)
      • Patch 4.3.1
      • Patch 4.3.2
      • Patch 4.3.3
      • Patch 4.3.4
    • Release 4.2
      • Patch 4.2.1
      • Patch 4.2.2
      • Patch 4.2.3
      • Patch 4.2.4
      • Patch 4.2.5
      • Patch 4.2.6
      • Patch 4.2.7
    • Release 4.1
      • Patch 4.1.1
      • Patch 4.1.2
      • Patch 4.1.3
      • Patch 4.1.4
      • Patch 4.1.5
    • Release 4.0
Powered by GitBook

© 2025 Tellius

On this page
  • Why fusion your datasets?
  • How to fusion datasets

Was this helpful?

Export as PDF
  1. Data
  2. Preparing your datasets

Fusioning your datasets

Quick, simple merge of two datasets

PreviousDataset ScriptingNextScheduling refresh for datasets

Last updated 4 months ago

Was this helpful?

Data Fusion is a point-and-click method to merge two datasets without writing SQL. It’s suited for:

  • Non-technical users who want a quick way to join two tables.

  • Simple merges where you pick matching columns and choose a join type (e.g., Left/Right/Inner) or a Union.

If you need more than two datasets, advanced transformations, or custom SQL (subqueries, aggregations, etc.), you’ll need to use Scripting instead.

Why fusion your datasets?

  1. Non-technical or first-time users can merge two datasets by simply choosing columns and join type—no SQL required.

  2. Quick reference table merges (e.g., attaching a lookup table).

  3. One-step union of two tables with identical schemas.

  4. Limitations:

    • You can’t fuse more than two datasets in a single operation.

    • No subqueries, advanced aggregations, or multi-step transformations.

    • Especially for Union, both datasets must align in column structure.

How to fusion datasets

  1. Under Data → Prepare → Data Fusion, you can find the following window.
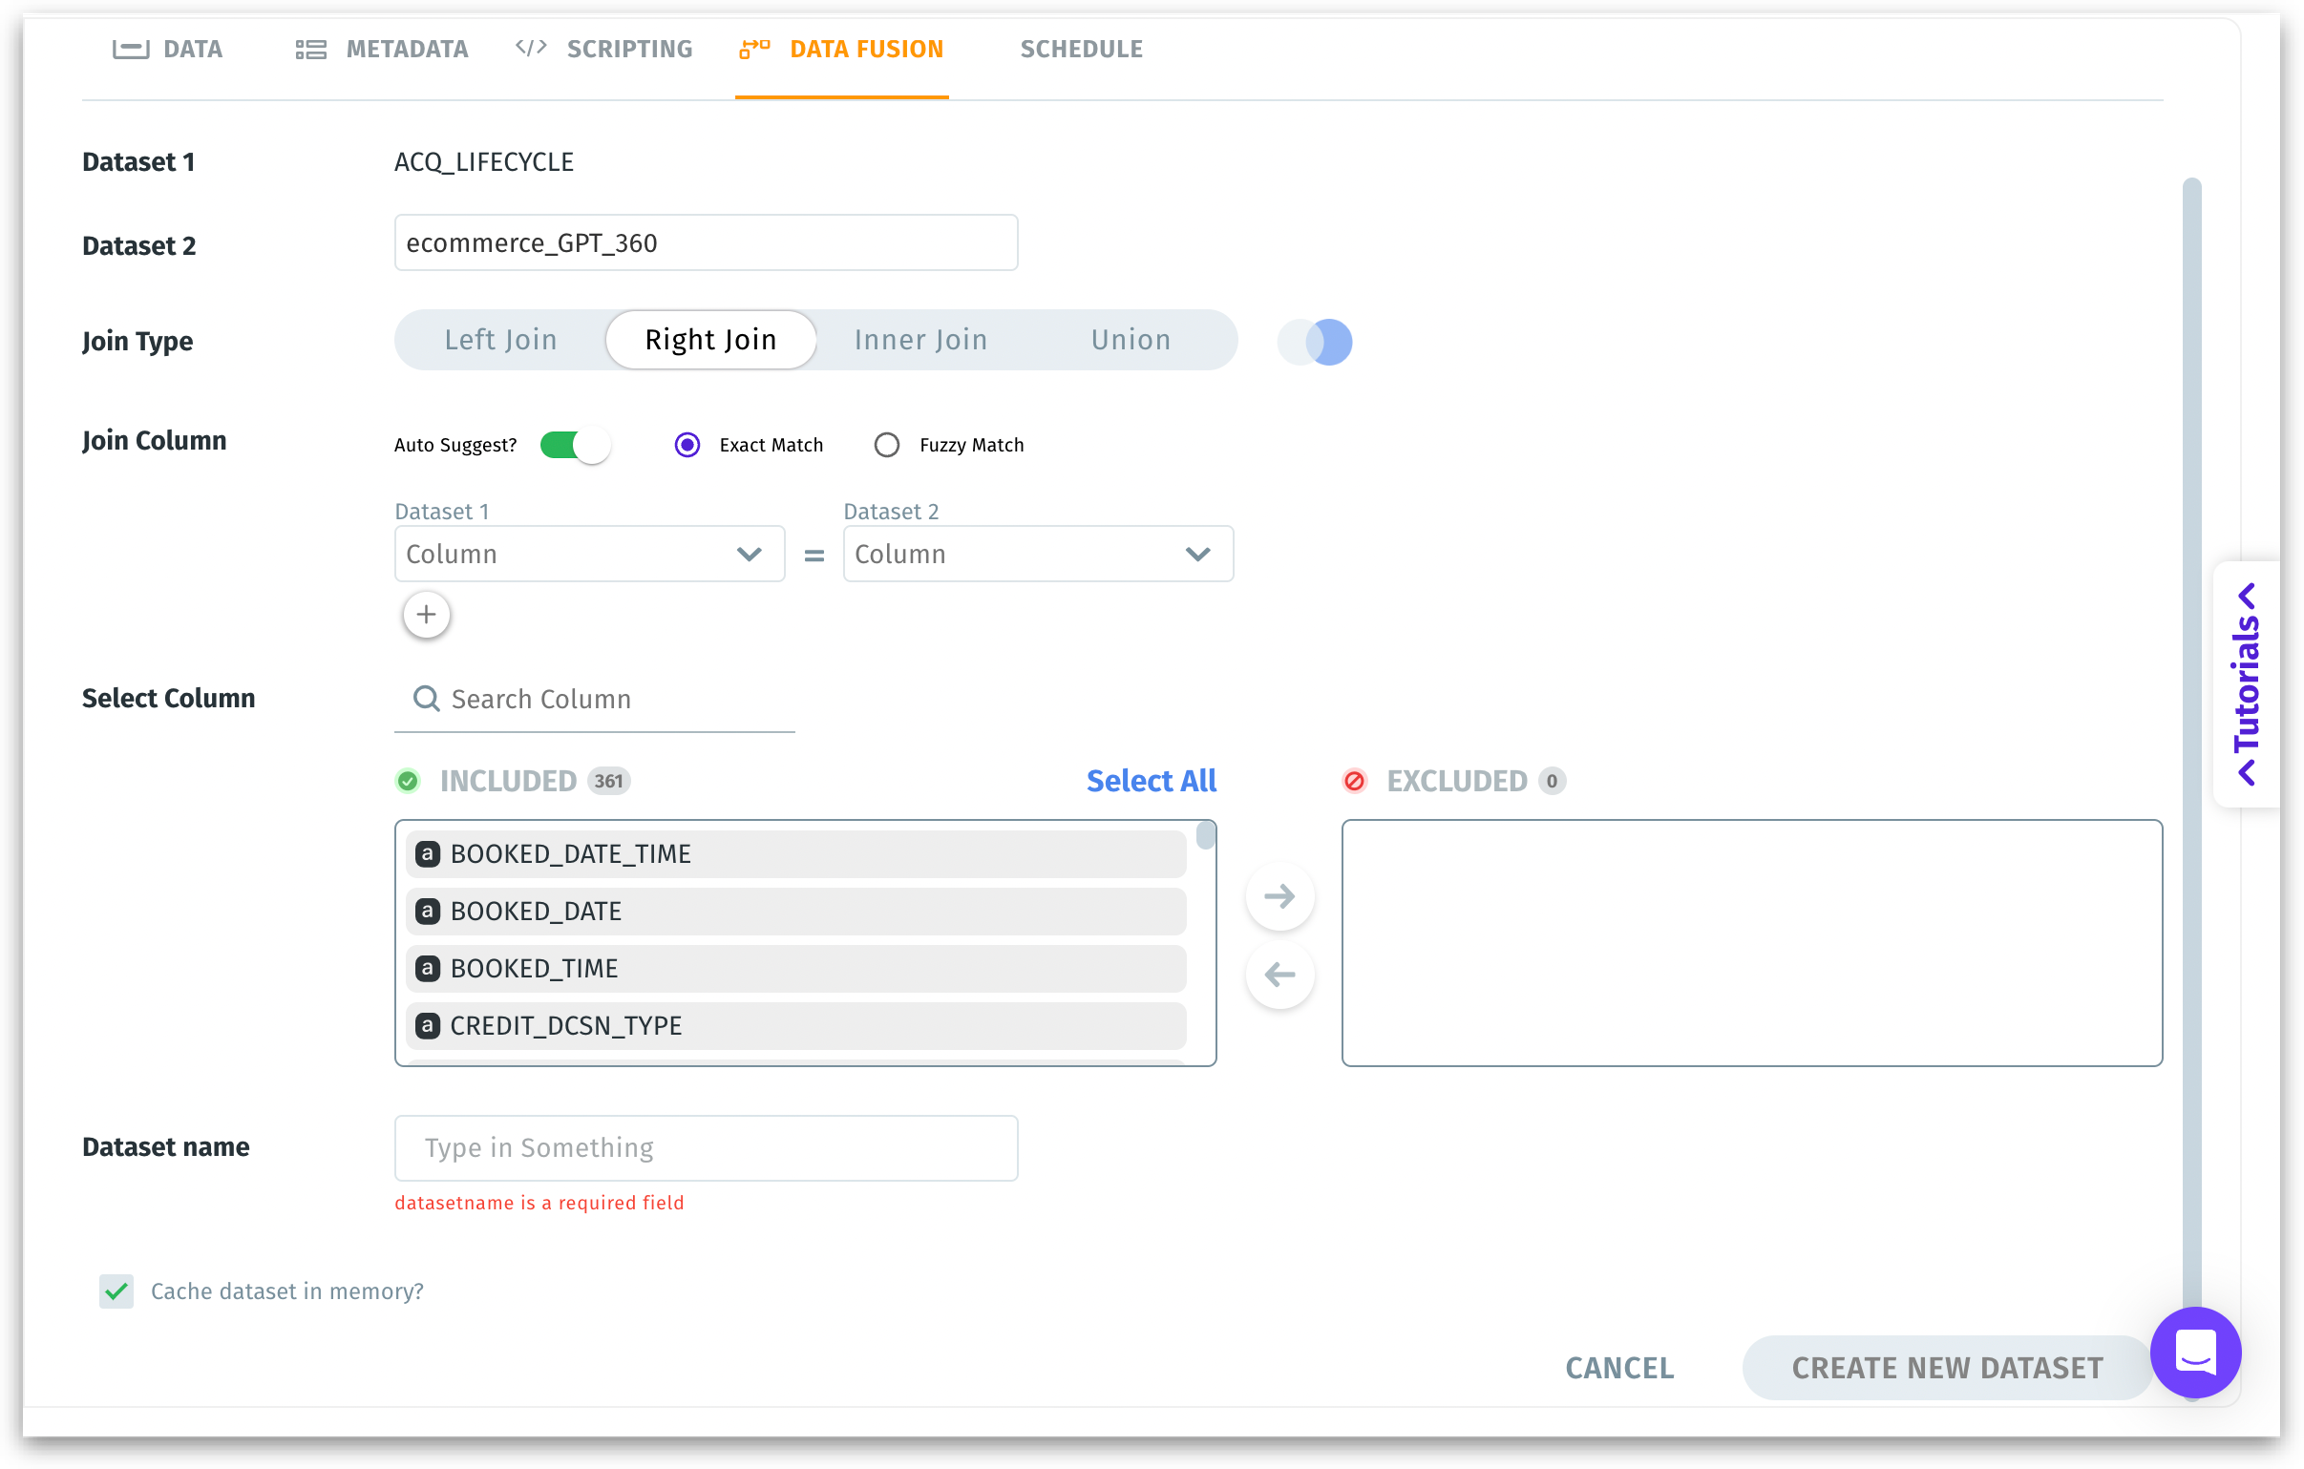
  1. Dataset 1: Auto-selects the dataset you've already selected.

  2. Dataset 2: Select the other dataset you want to merge from the dropdown.

  3. Join Type (Left, Right, Inner, Union)

    • Left Join: Returns all rows from Dataset 1 plus matching rows from Dataset 2.

    • Right Join: Returns all rows from Dataset 2 plus matching rows from Dataset 1.

    • Inner Join: Returns rows only where matches exist in both datasets.

    • Union: Stacks the rows from both datasets on top of each other—requires matching column names and data types.

If column names or data types don’t align for Union, you’ll see an error like “Unable to perform data union because of dataset mismatch.”

  1. Join Column: The columns for matching records between the two datasets. You specify join columns so the system knows how to line up rows from Dataset 1 with rows from Dataset 2. Including or excluding columns (check #6) just decides which fields appear in the final result—it doesn’t dictate how the two datasets match up in the first place.

Auto Suggest analyzes the two datasets for column similarities—often by name or type—and then automatically proposes which columns might be a good match for joining. This saves time, especially when there are many columns, because you don’t have to manually identify and select the corresponding columns each time.

  • Auto Suggest: Automatically guesses matching columns if they share names or certain patterns.

  • Exact Match: Columns must match exactly (case-sensitive name match).

  • Fuzzy Match: Looser matching; tries to align columns that are spelled similarly.

  1. Select Column (Included | Excluded): Choose which columns from both datasets should appear in the final fused dataset. Use the arrows to move columns from Included to Excluded, or vice versa. Search for the required column or choose "Select All" to select all the columns listed.

Join Column vs Select Column

Join Columns define the “key” or shared attribute that both datasets use to match their rows. For example, if one table has a column customer_id and the other has a column cust_id, you map these together so the system knows which customer in the first dataset corresponds to the same customer in the second dataset.

Select Columns decide which columns end up visible in the final merged dataset. Maybe you only need a few columns from each dataset for your analysis. This step doesn’t affect how the data is joined; it’s purely about presentation and relevance of columns in your resulting dataset.

  1. Dataset Name: Provide a unique name for the new fused dataset you’re creating.

  2. Cache Dataset in Memory?: If enabled, improves performance by loading the fused dataset into in-memory storage for frequently accessed or smaller datasets.

  3. Click on Create New Dataset to finalize your Fusion setup and generate the new dataset. This new dataset appears in your dataset list, ready for use in dashboards, queries, or further transformations.

🔢
🐣
Data → Prepare → Fusion