Metadata view
Master the Metadata view in Tellius to edit display names, data types, aggregations, special types, synonyms, and indexing for accurate analytics and Insights.
The Metadata view gives you granular control and visibility over each column in your dataset—its purpose, data type, special handling, and how it is used in downstream analyses. Easily select multiple columns and perform bulk operations in just a few clicks. During data preparation, you can also sort the values in each column as required.
Properly configuring your metadata ensures that Tellius can accurately interpret and process your data, whether you’re performing self-service analytics, creating AI-driven insights, or building predictive models.
During data preparation, you can inspect and edit the properties of each column, such as:
Display Names for user-friendly labeling
Data Types (integer, string, timestamp, etc.)
Column Types (dimension vs. measure)
Feature Types (categorical vs. continuous)
Aggregations (sum, average, etc.)
Special Types (map coordinates or geographic boundaries)
Synonyms for advanced natural language search
Rank to prioritize columns in Live Insights
Indexing to determine columns included/excluded in search
Descriptions for contextual tooltips
In addition, Tellius Kaiya can auto-generate metadata such as synonyms, descriptions, or display names for you to review, accept, or refine. This significantly reduces manual effort and promotes standardized terminology across your organization.
Navigate Data → Prepare → Metadata and select the required business view from the Datasets pane.
The column names will be displayed along with the following metadata:
Display name
Data format
Special type
Data aggregation
Synonyms
Rank
Indexing
Column type
Feature type
Column description
In each column header, click on the ↓ to sort the values in ascending order or ↑ to sort the values in descending order.
Hover over any info icon next to the column header to view the contextual tooltips and get a quick idea of each metadata.
Click on the Edit button to edit the metadata of any column(s).
After performing the required changes, click on Publish to save the changes or Cancel to discard changes.
Here are the steps to be followed to edit each type of metadata:
Display name
Display names are user-friendly names given to the columns in a dataset. Throughout Tellius, only display names would be used to refer to any column (not column names). To rename a column, you can change the display names (instead of changing column names), as it ensures no disruptions when data is refreshed.
From the metadata view,
For a required column, click on Click to edit under Display Name.
Provide the desired display name.

Data type
A fundamental property indicating how your data is stored (integer, string, double, date, timestamp, etc.). The data type determines which operations and transformations are applicable to a column. For example, only numeric columns can be used in mathematical aggregations, while date/timestamp columns unlock time-series analytics.
The data type of the values can be changed only under Data subtab.
To change the data type,
Navigate Data → Prepare → Data.
Click on the Edit button.
Click on the dropdown arrow next to any column name and choose Data Type.
Choose the required data type:
String: For characters and text
Double: For floating point numbers
Date: For values containing dates
Integer: For numerical values
Timestamp: For values with both date and time
Click on Submit to save the changes, or Cancel to discard.

Column type
A column type could be either one of the following:
Measure - quantitative values (e.g., sales, profit, cost) which can be aggregated (e.g., sum, average, min, max)
Dimension - qualitative values (e.g., city, region, date) which cannot be aggregated and do not support mathematical operations like summing or averaging.
Choose the column type as “dimension” if the values can be used to categorize or segment the data (e.g., show sales by city, show profit by year).
The feature type, data format, and default aggregation of measures can be modified.
The aggregation and data format of dimensions will be “N/A”.
The feature type of dimensions can only be “Categorical”.
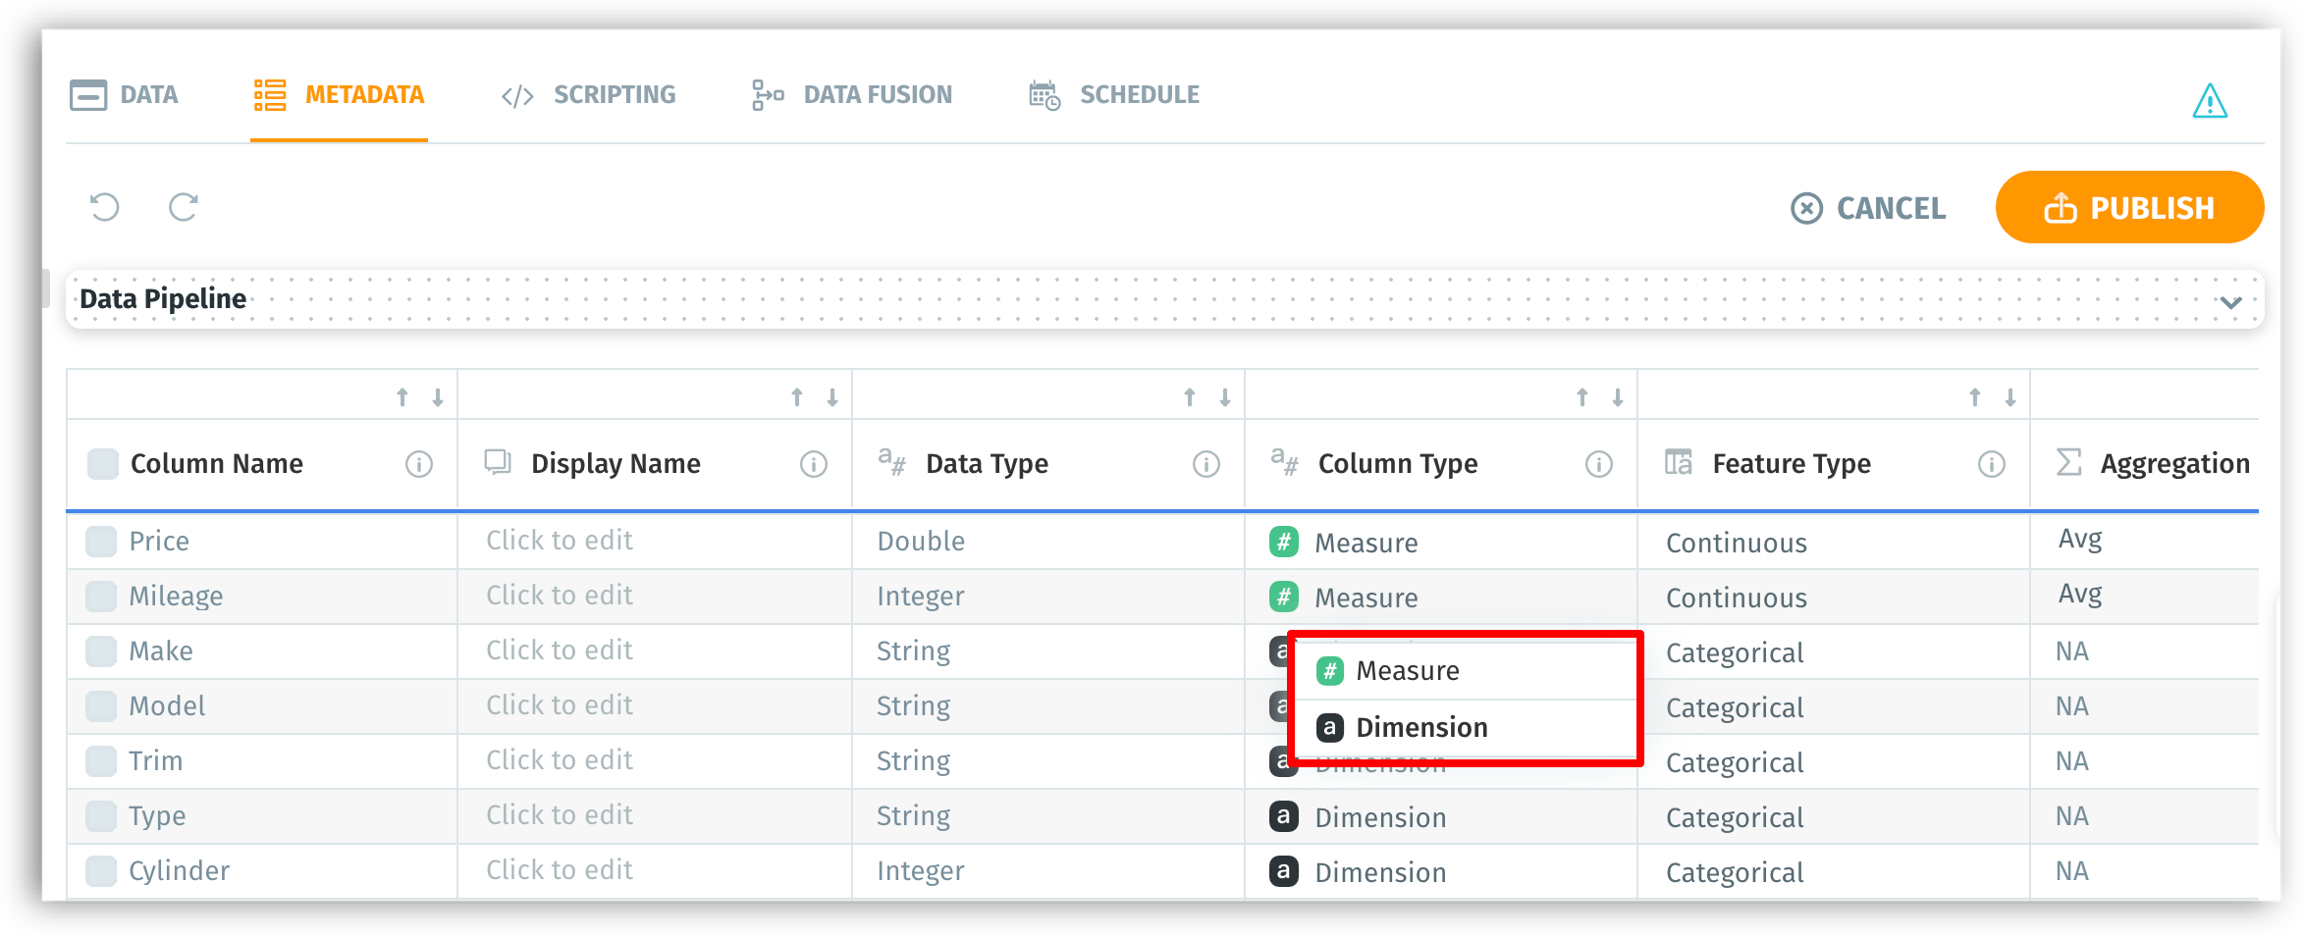
From the metadata view,
For any required column name, click on the dropdown under Column type.
Choose Dimension or Measure as required.
Feature type
The feature type of a value can be either one of the following:
Categorical - discrete variables; a fixed number of possible values (e.g., the values for the column ‘Continent’ can be one of the 7 values)
Continuous - variables from a range of values between a theoretical minimum and maximum (e.g., columns that represent measurements, such as "height", "temperature", "weight".)
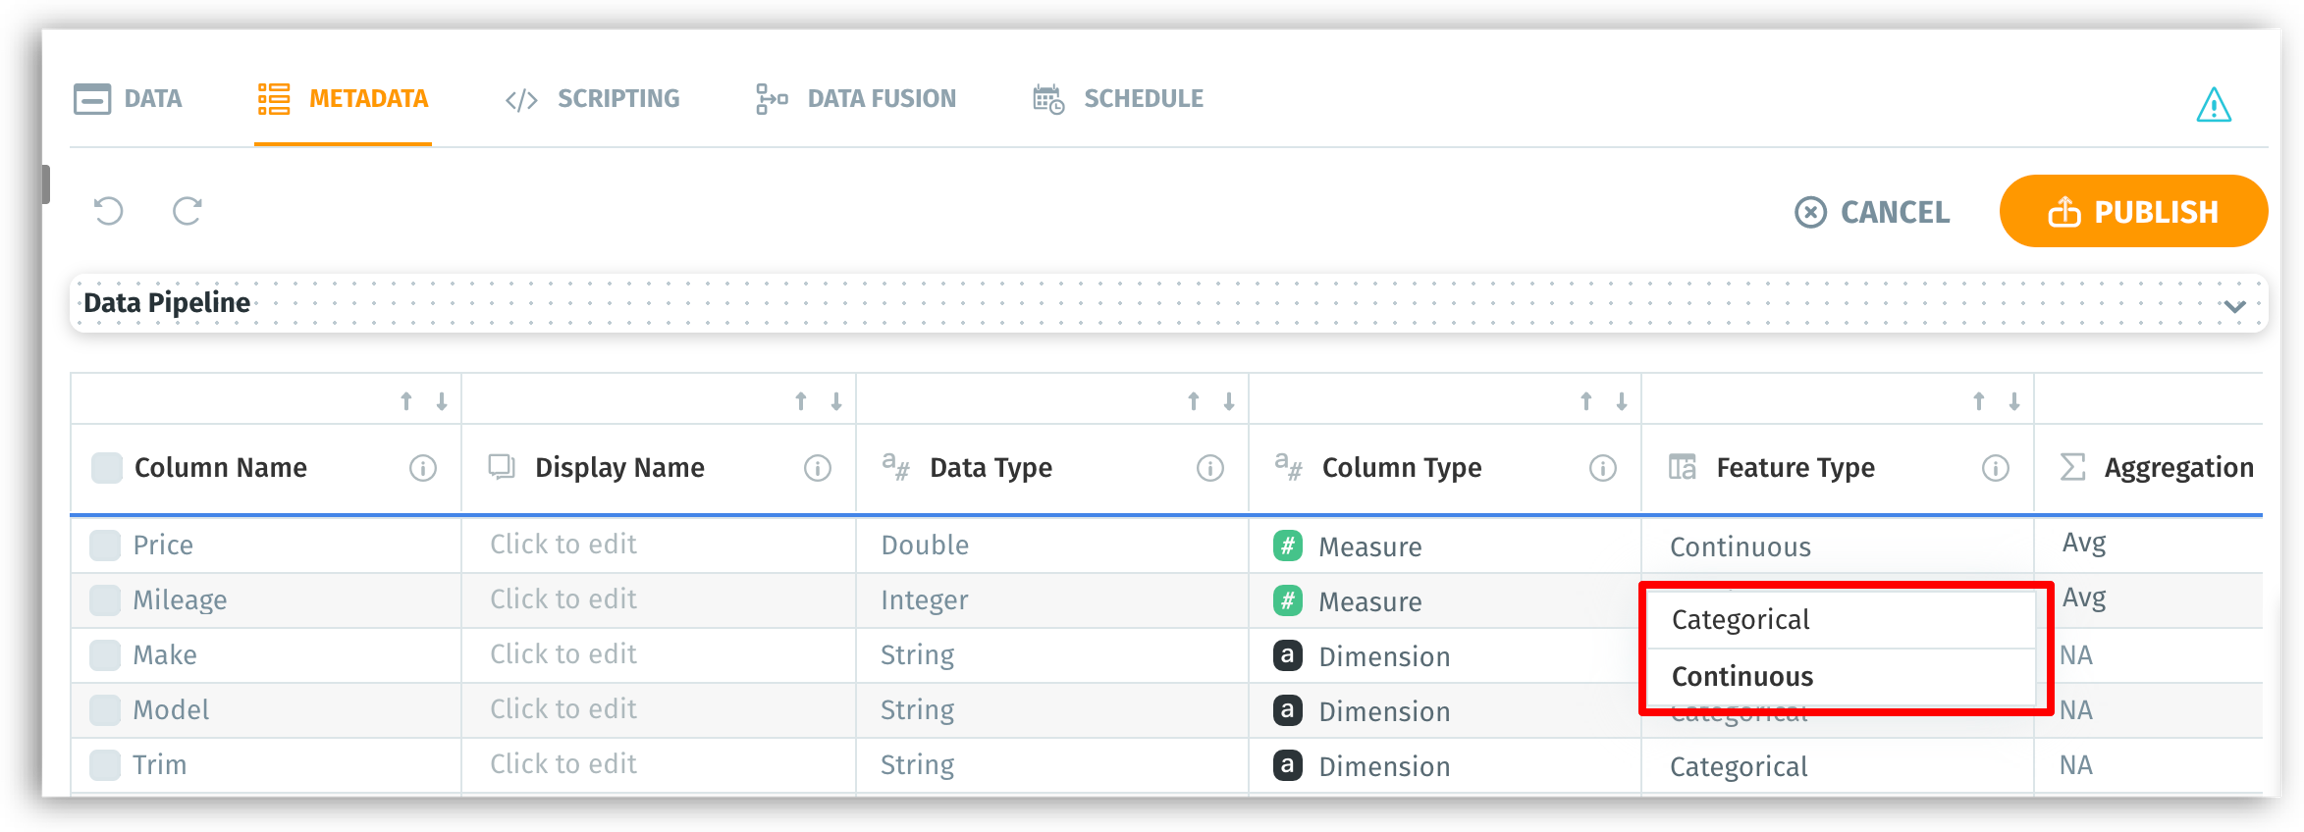
From the metadata view,
For any required column name, click on the dropdown under Feature type.
Choose Categorical or Continuous as required.
Dimensions always have the feature type Categorical, while measures can be either continuous or discrete (though in most common use cases, numeric measures will be continuous).
Aggregation
A collection of values can be aggregated to form a single value. The value set up will be used as the default aggregation for the associated measure across Tellius, and it can be changed when required. The default aggregation can be set in the following ways:
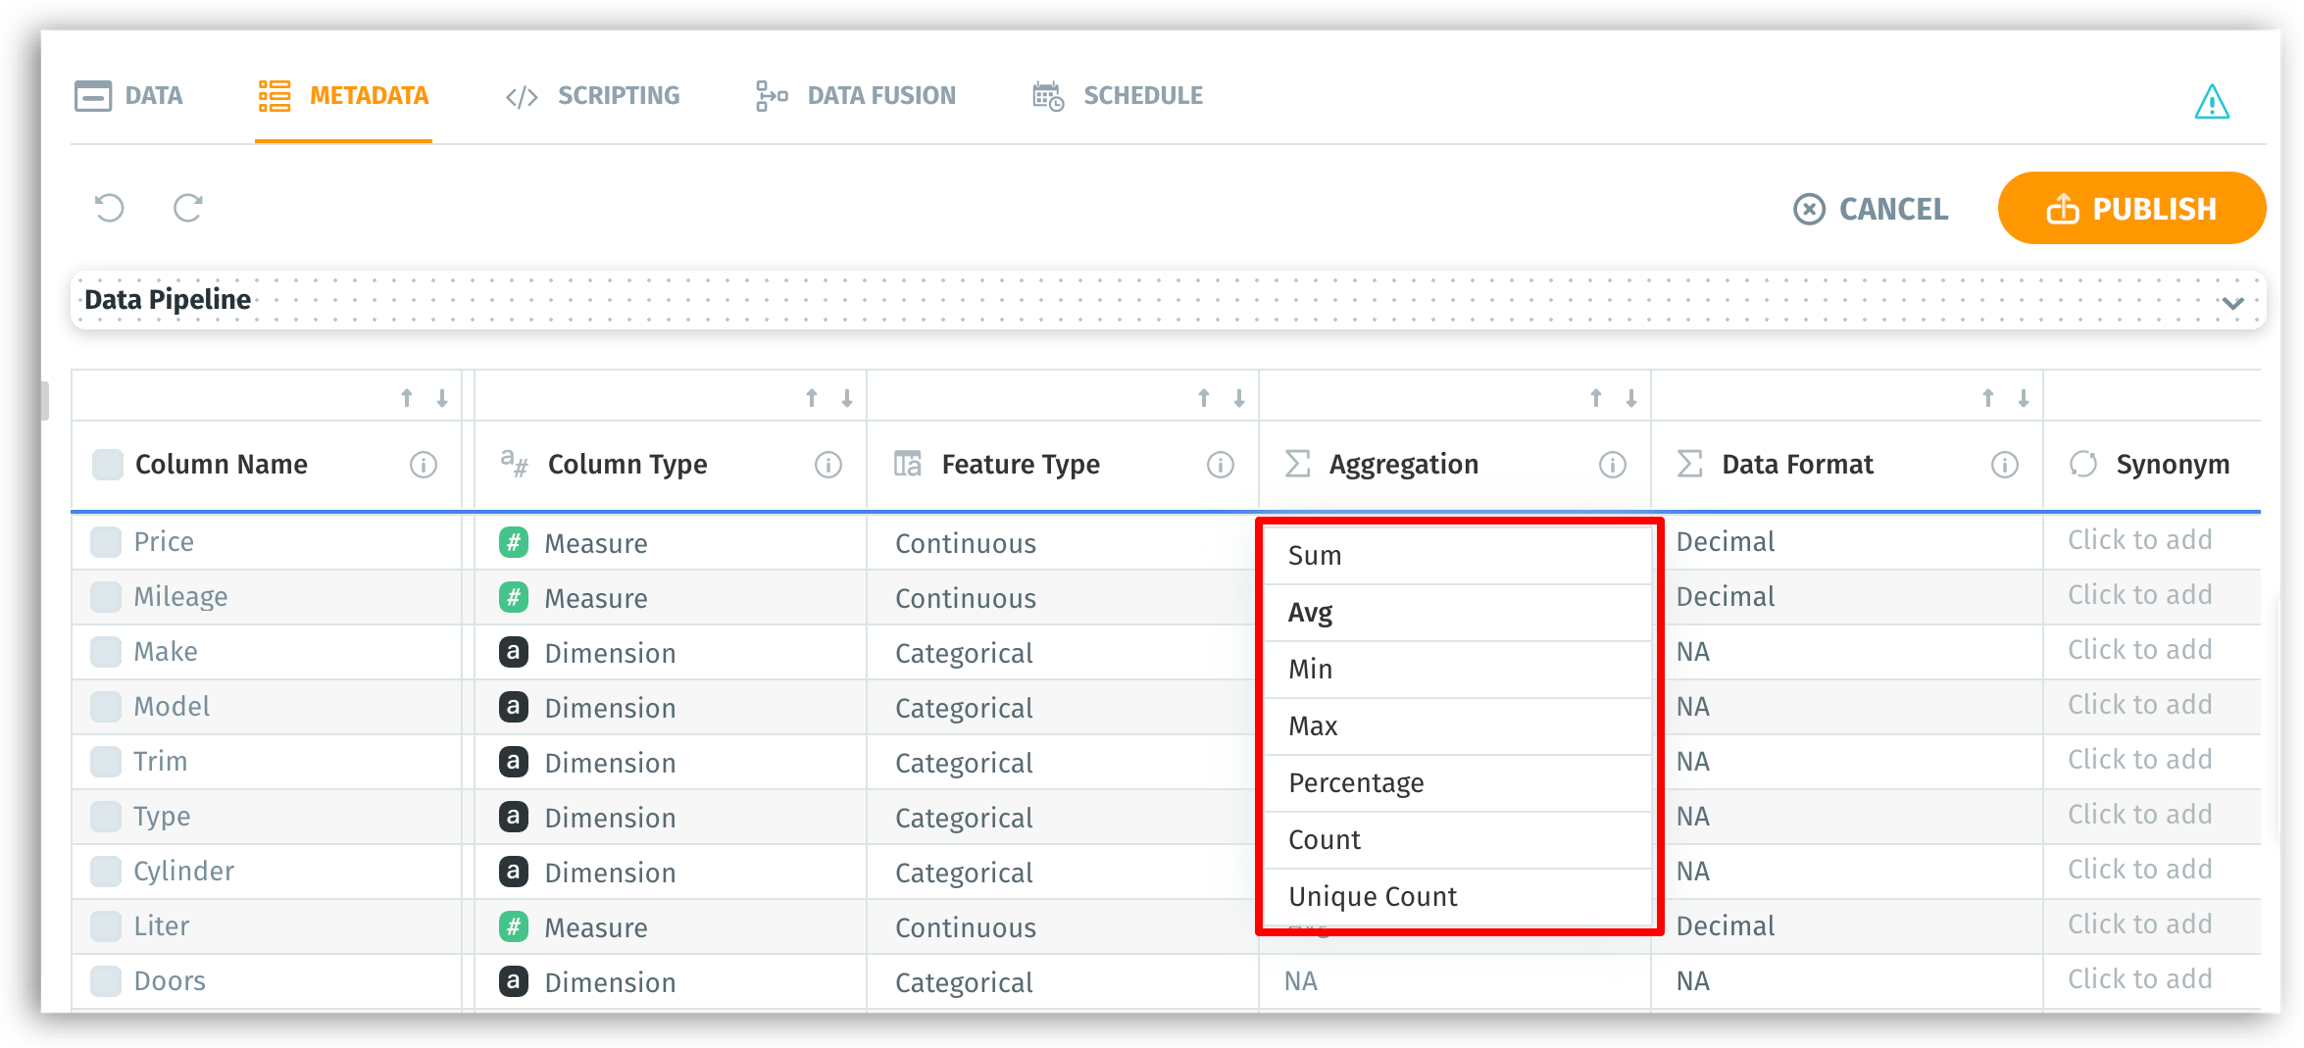
From the metadata view,
For the required column name, click on the dropdown under Aggregation.
Choose one from the following options:
Sum - the total sum of the values
Avg - average of the values
Min - minimum of all the values
Max - maximum of all the values
Count - number of values in the column
Unique count - number of distinct values in the column
Percentage - the percentage of all the values in the column
Aggregation affects how data is summarized in charts, insights, or pivot-style tables. For instance, sales data is commonly summed, while rating data may be averaged.
Use Sum for additive measures like revenue or page views.
Use Average for continuous measures where you need the mean (e.g., average session duration).
Use Count or Unique Count for ID columns that are still treated as measures, but require counting rather than summation.
Default aggregation can be set only for measures.
Data format
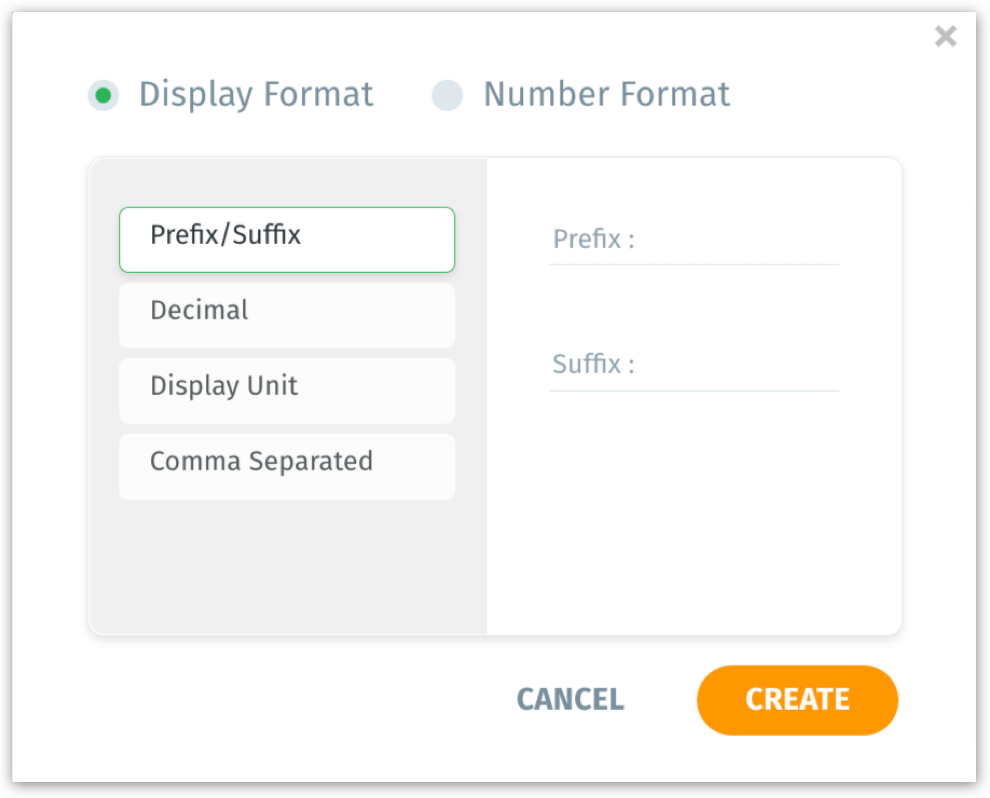
Data format indicates the format (e.g., prefix/suffix, comma separation, decimal units) in which the data is represented in a dataset.
From the metadata view,
For any required column name, click on the dropdown under Data format.
Choose the required data format from the list.
The data format can be set only for measures.
Special type
This helps you to flag columns used in geographical or time-based analyses. Based on the data type (integer, string, timestamp) of the column, a list of Special types will be displayed. If the column is used in a search query, the results will be displayed according to the selected Special type.
If a Special type is assigned for integer, double, and string data types, search results will be displayed in Map charts instead of regular bar/line charts.
If a Special type is assigned for timestamp data types, the column will be selected as the primary date column for time/date-related search queries.
The Special type assigned for columns will be reflected on search result queries (Search tab) and while creating location maps and boundary maps in Vizpads (Explore tab).
Integer and double data type
For any required column name, click on the dropdown under Special type.
Select the required Special type from the list of options displayed:
Map Longitude
Map Latitude
Zip
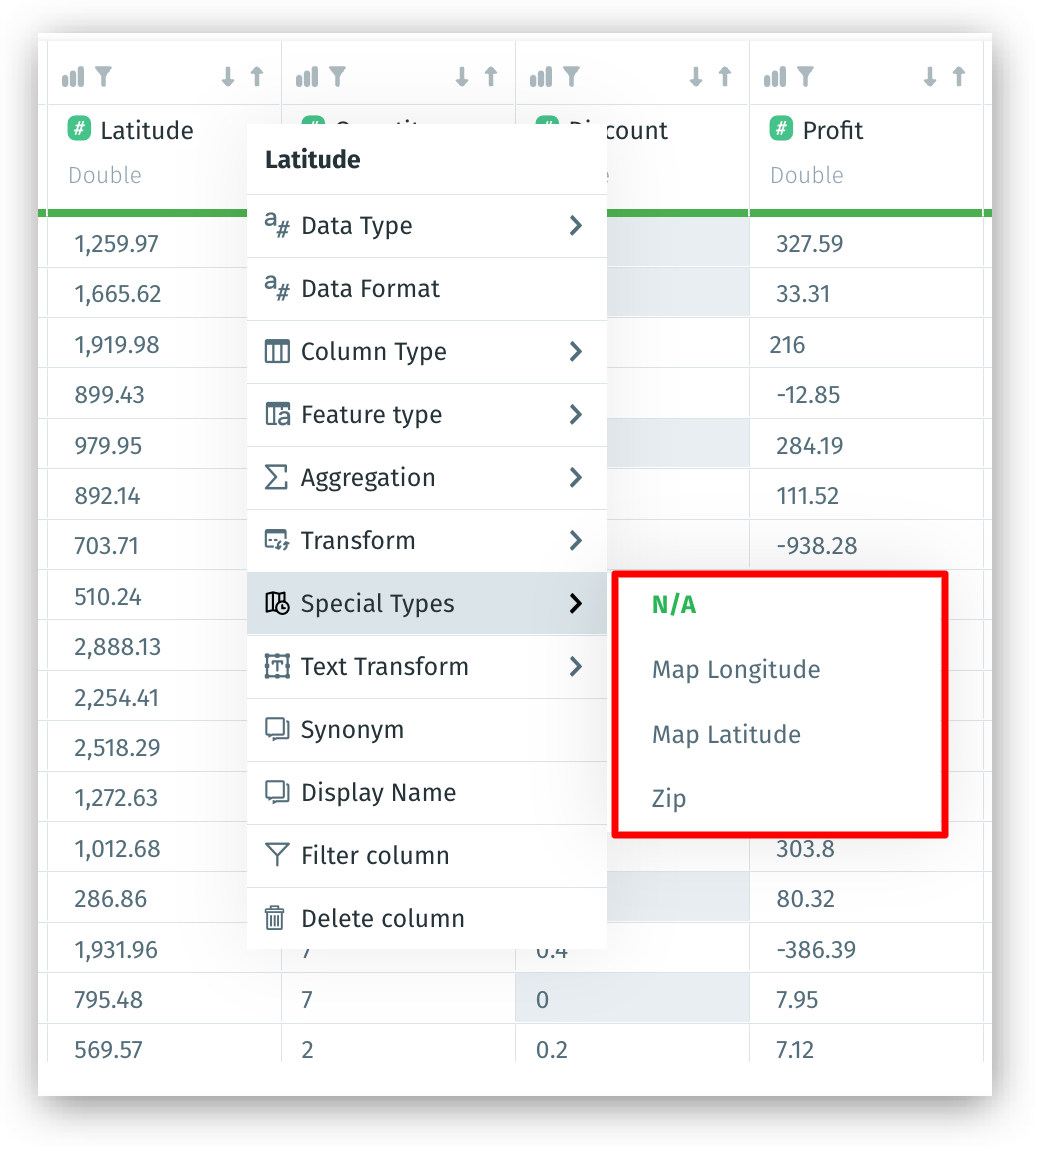
If Map Latitude is selected, the following window will appear for you to choose the column for Map Longitude (and vice versa).
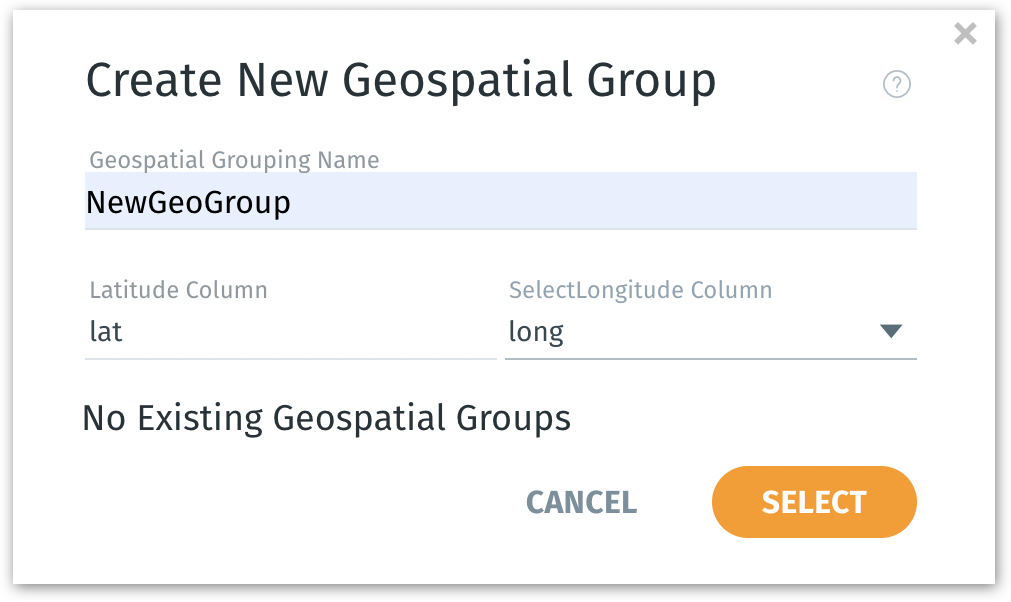
Provide a name in the Geospatial Grouping Name field.
Since the latitude column is already selected, choose the complementary longitude column from the dropdown under Select Longitude Column.
Click on Select to continue or click on Cancel to dismiss.
Without assigning these Special Types, your location-based or date/time-based queries may not auto-generate appropriate map or time-series visualizations.
Now, if the column is used in a search query (under Search), the results will be displayed in the Map chart. According to the Special type selected, the values will be plotted on the chart.
While creating Location Maps chart type in a Vizpad (Explore)
Columns can be added to Latitude and Longitude fields only if their Special type is set to Map Latitude/Map Longitude.
Instead of drag-and-drop, when you double click the columns whose Special type is set to Map Latitude/Map Longitude from the Business View pane, they will be automatically added to the corresponding Latitude/Longitude fields.
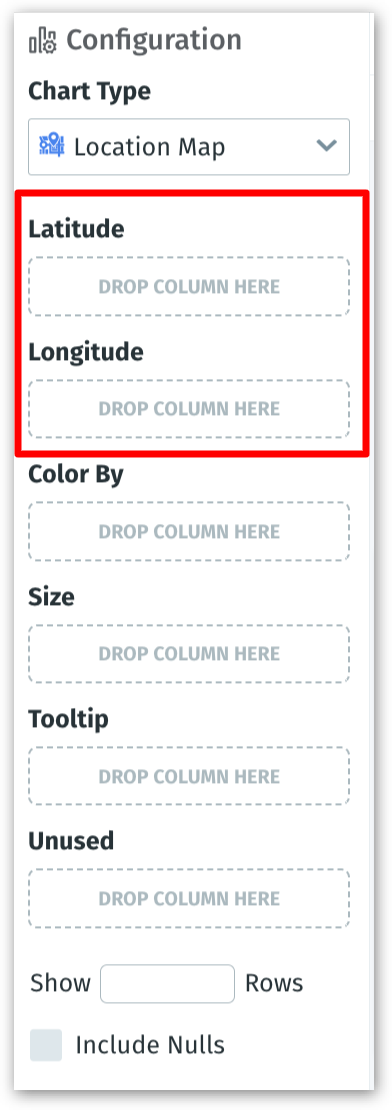
To change the Special type of a column from Map Latitude to Map Longitude (or vice versa), first set the Special type as N/A and then change to latitude/longitude as desired.
String data type
For any required column name, click on the dropdown under Special type.
Select the required Special type from the list of options displayed:
Country
State
City
County
Zip
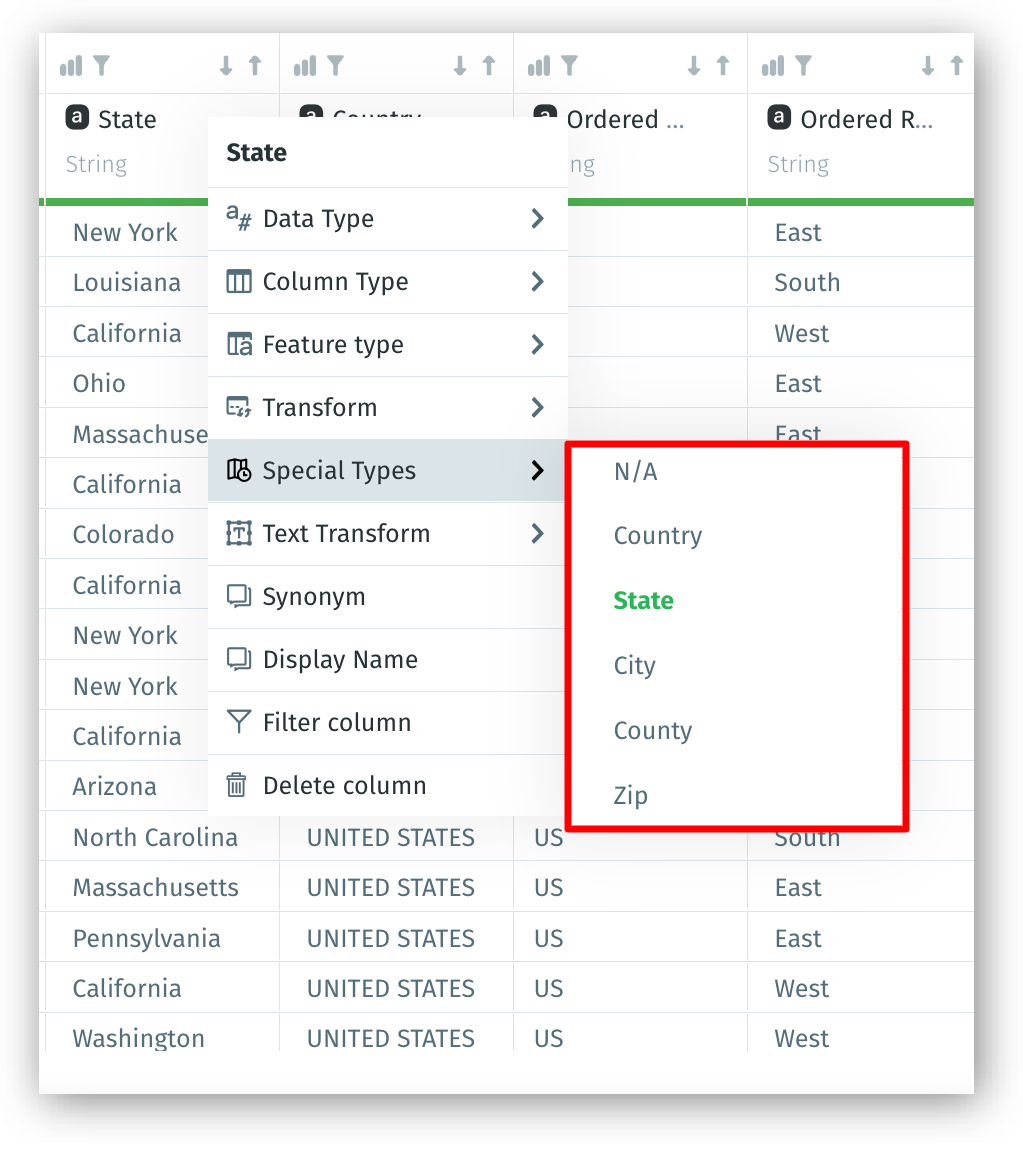
Now, if the column is used in a search query (under Search), then the results will be displayed in the Map chart. According to the Special type selected, the values will be plotted on the chart. For example, when you search
Show profit by country, instead of a regular bar/line chart, the results will be displayed in a Boundary Map chart.
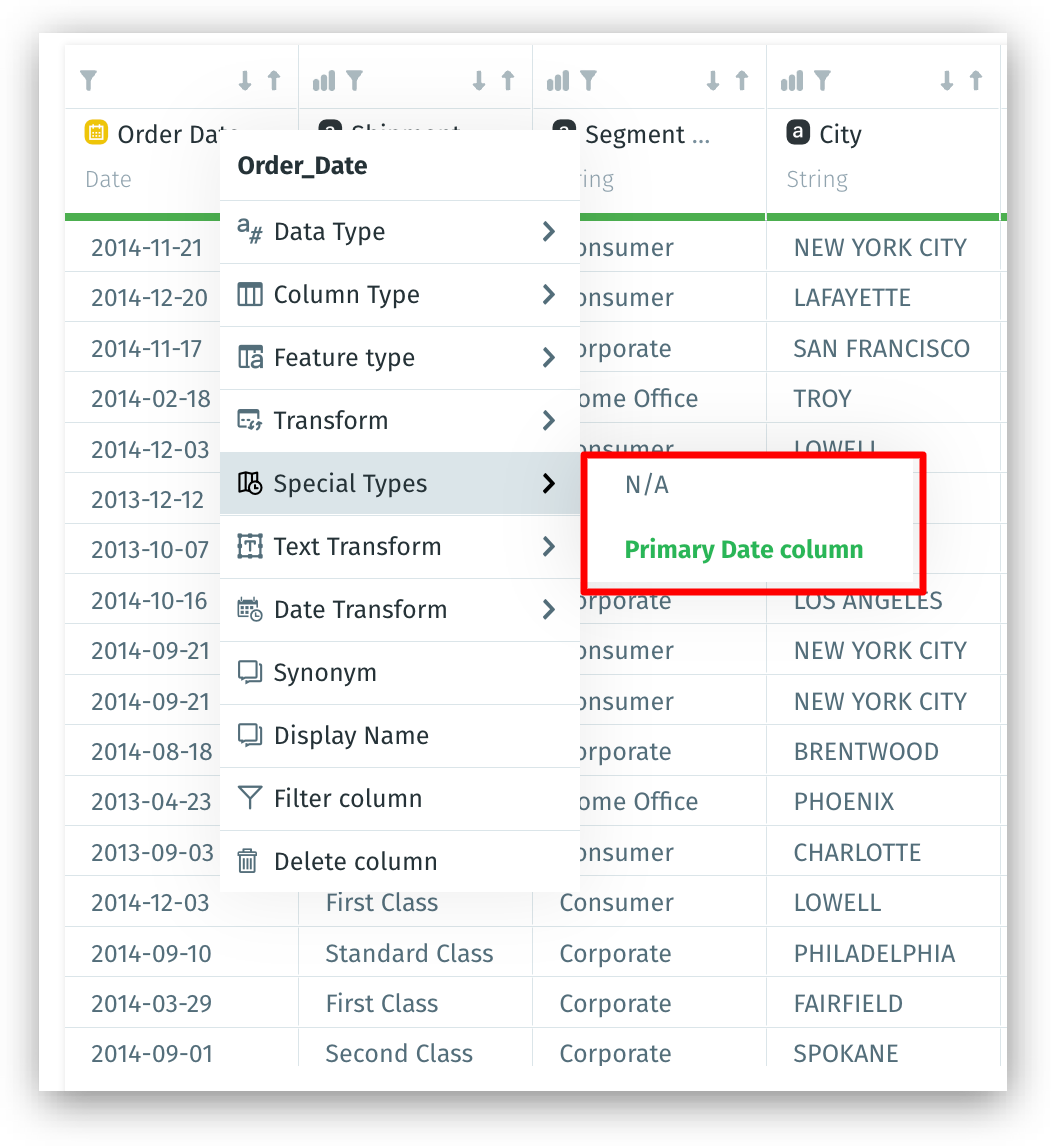
Timestamp data type
For any required column name, click on the dropdown under Special type.
The chosen column will be picked as the primary date column for any time/date-related search queries entered in Search.
Synonyms
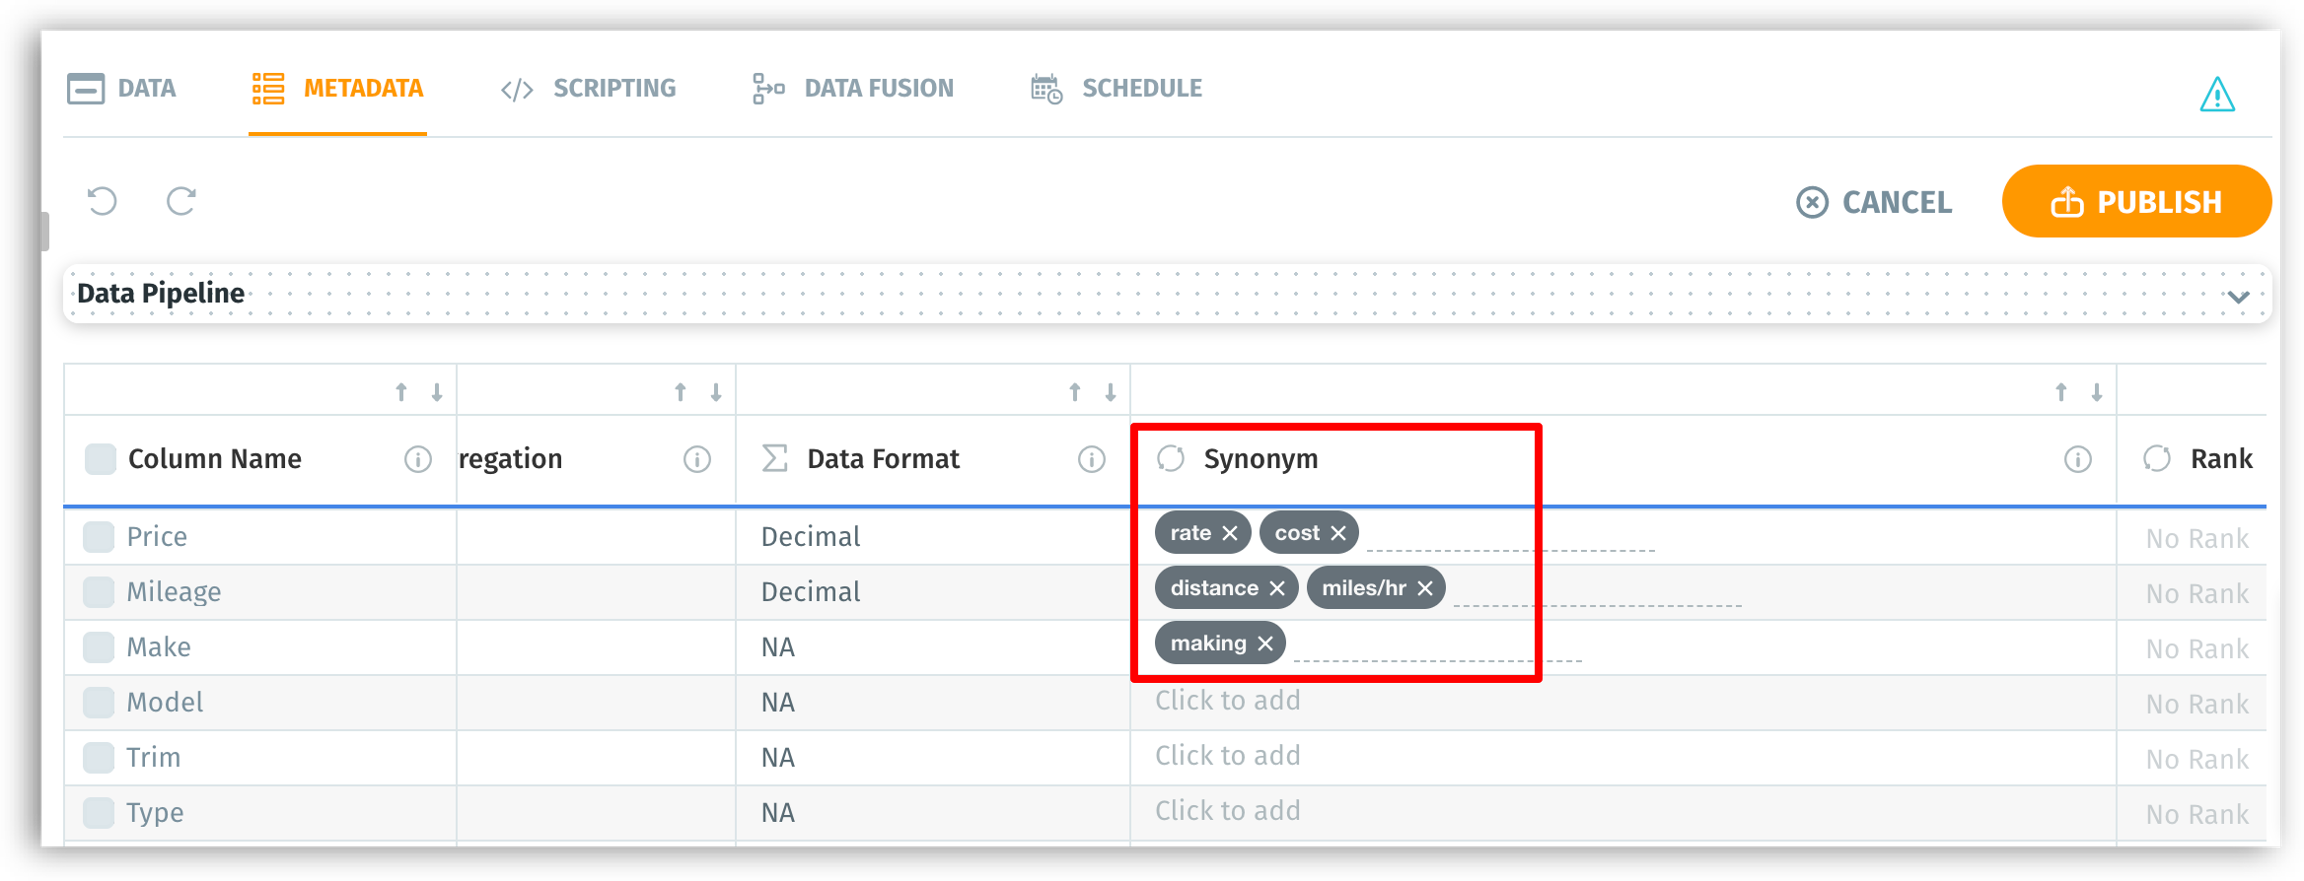
Sometimes, a category could be called using multiple names by different team members. Such additional names could be added under Synonyms. They are alternative names that you could provide for a column. Synonyms can be used instead of the actual column name or display name in search queries.
From the metadata view,
For any required column name, click on the Synonyms cell.
Provide a synonym and press "Enter"/"Return". Include as many synonyms as required.
Rank
Tellius allows you to rank the columns (from 1 to 20) so that the prioritized columns would be used in Live Insights over the non-ranked columns. By default, there will be no ranking associated with any column in a live dataset. Each rank assigned to a column is unique, i.e., no two columns can have the same ranking.
If required, a ranked column can still be excluded while creating Insights or Models.
The ability to rank is unavailable for non-live datasets.
From the metadata view,
For any required column name, click on the dropdown No Rank under Rank.
Choose the required ranking from 1 to 20.
While creating Live Insights, the rank of every column will be displayed under Column Selection.
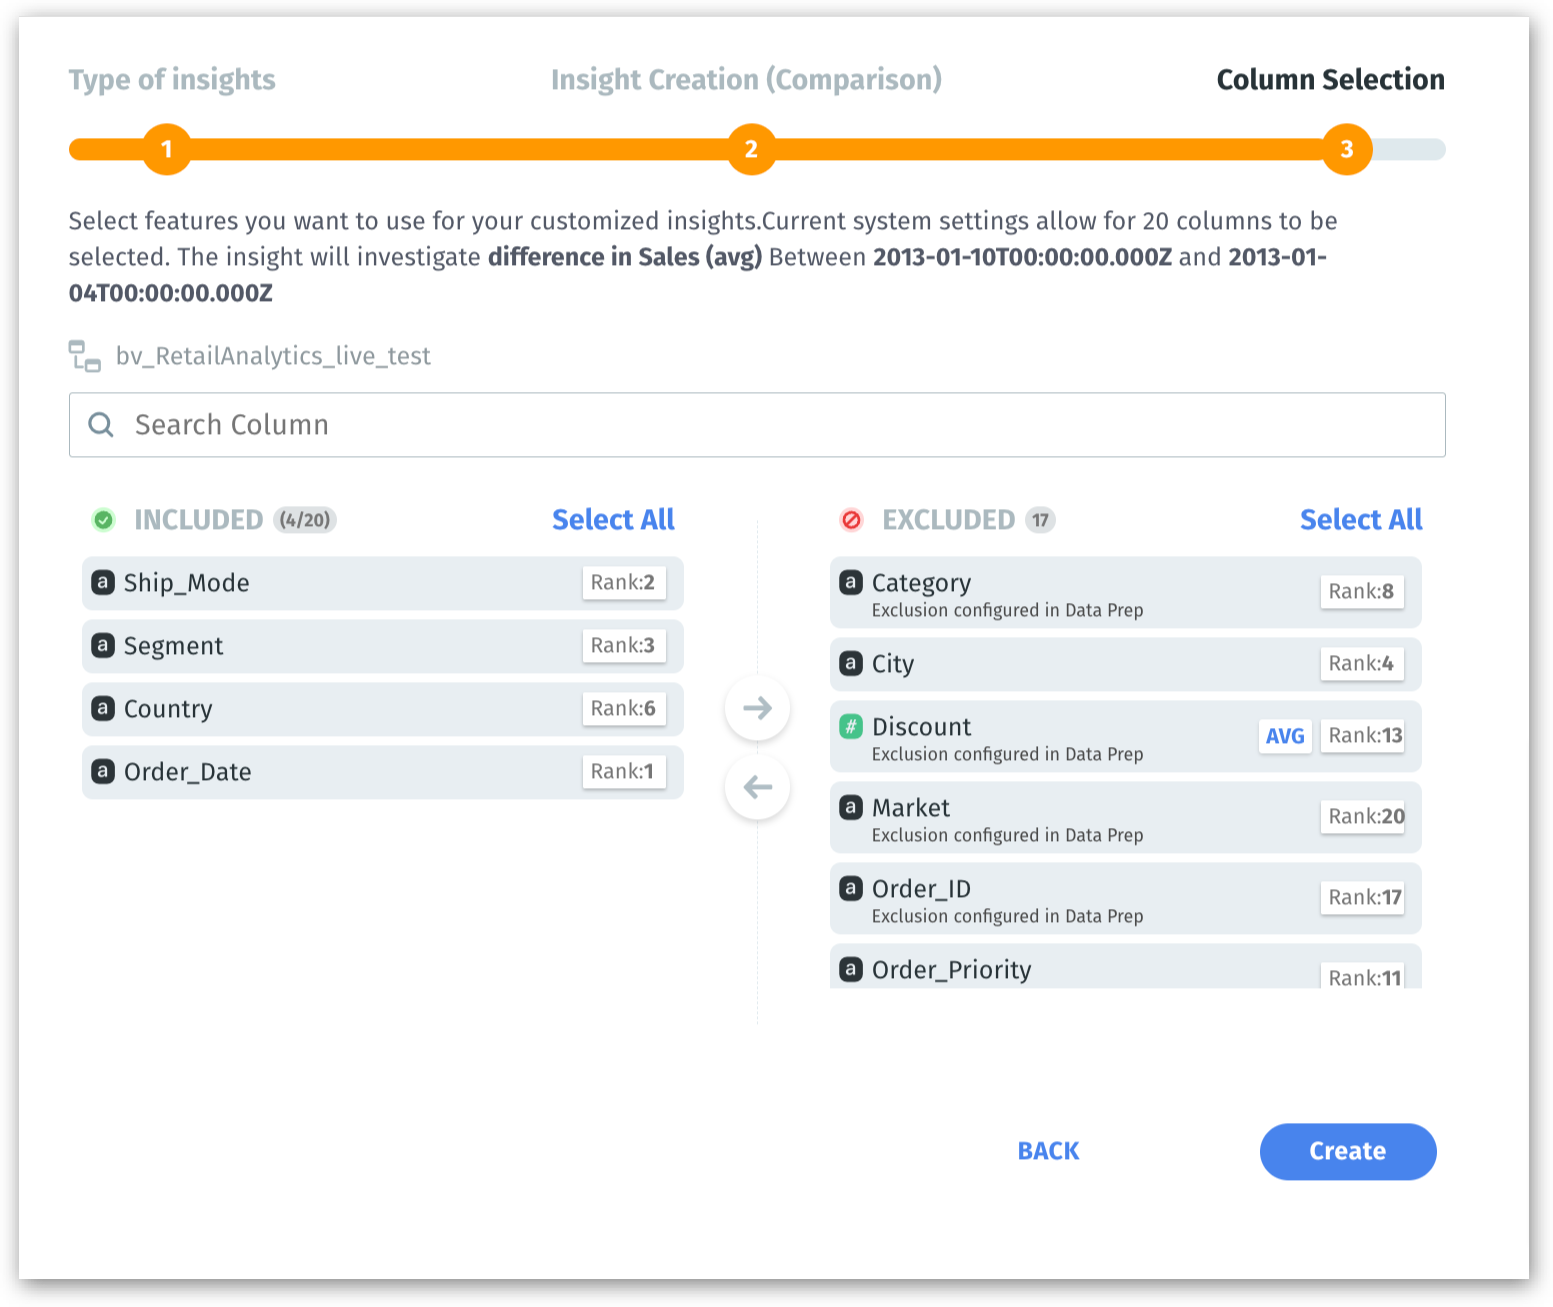
Only 20 columns will be considered for Live Insights, and the remaining columns will be excluded with the reason Excluded since Live Insights require 20 columns. If ranks (from 1 to 20) are provided, then the ranked columns will be considered. If the columns are not ranked, then Tellius will auto-select 20 columns.
Include in Insights
Select the columns that need to be considered for the creation of Insights under the Discover tab. The columns can also be included/excluded while creating Insights.
Excluding high-cardinality columns (like email addresses) or irrelevant fields (like logs or freeform text that doesn’t help your analysis) improves the performance of Insight generation and model training.
From the metadata view,
If you want to include a column for the creation of Insights, click on the toggle button under Include in Insights.
To exclude a column, switch the toggle to “No”.
The excluded columns will be displayed in the Insights summary with the reason “Excluded configured in Data Prep”.
The columns included/excluded in this metadata view will be reflected when an Insight is created (Insight Configuration).
Under Included, the columns selected in the metadata view will be displayed.
The unselected columns will be displayed under Excluded columns, along with the reason for exclusion.
Users have the flexibility to drag and drop the required columns from Included to Excluded and vice versa.
The number of columns under Included and Excluded will also be displayed, along with the option to Select/Deselect all the columns.
For Live Insights, the rank assigned to each column will be displayed.
By default, Tellius automatically excludes all date-related and high-cardinality columns (e.g., email ID, contact number) from Insights creation. While moving columns, date columns cannot be moved from Excluded to Included.

A column can be excluded for multiple reasons. Tellius follows the below order of priority to exclude a column:
Target column (excluded since the column is used as a target for insights)
Cohort column (excluded since the column is used to form a cohort for comparison)
Date column (excluded since the data type of a column is date or timestamp)
Cardinality (excluded since the column consists of unique values - e.g., email ID)
Data preparation (excluded since the user unselected it in the metadata view during data preparation)
User excluded (since it was excluded during the creation of Insights)
Personalization (Excluded by the user after the insight has been generated; from Is the Insight helpful → Help Tellius learn → Exclude columns)
Correlated (since the column is correlated with some other column)
Excluded in top features (only the top 6 key drivers are considered based on feature importance)
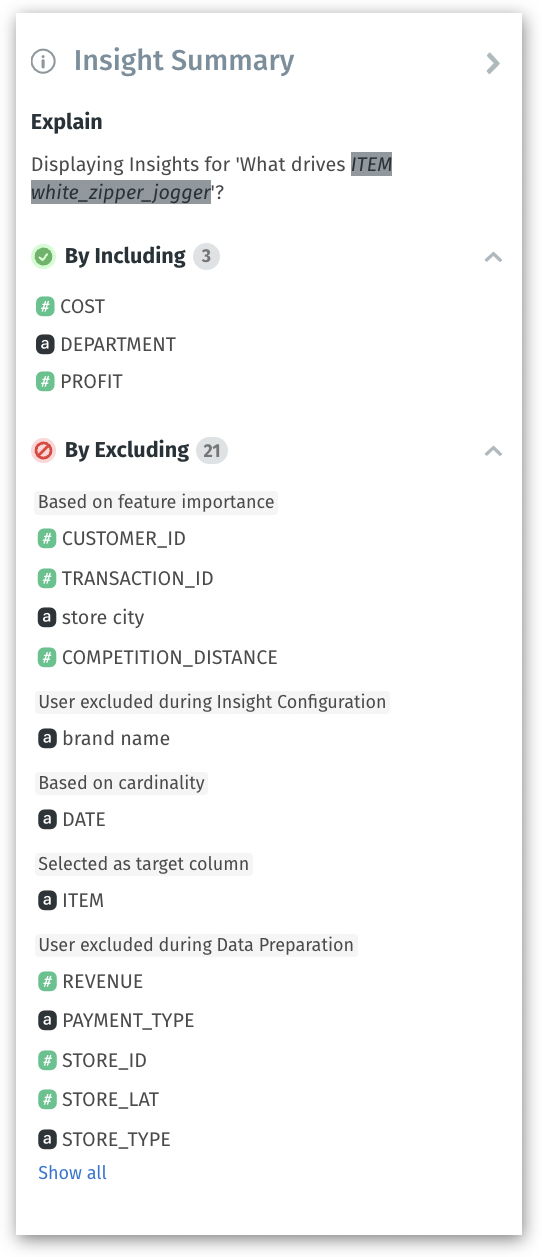
Once an Insight has been created, its corresponding details will be displayed in Insight Summary. It displays the included and excluded columns with the reason for exclusion.
Include in Predict
Select the columns that need to be considered for the creation of Models under Predict tab.
From the metadata view,
If you want to include a column for Models, click on the toggle button under Include in Predict.
To exclude a column, switch the toggle to “No”.
By default, the high cardinality columns (e.g., email ID, contact number) will be excluded when creating Models.
Index column
When a search query is executed, only the values of indexed columns are considered for processing the results of a query.
The columns set to Default will be considered for the search results.
The values of the column set to Don’t Index will be excluded from the search results.
From the metadata view,
For the required column, click on the dropdown under Index Column.
Choose the value as Default to include the column, and Don’t index to exclude the column.

Description
Column description helps you understand the context of each column. When you hover over any column across Tellius, the corresponding data description will be displayed in the tooltip along with the column type (measure/dimension). By default, there will be no description associated with a column.
The following are the places where the description will be displayed when hovered:
Search:
When hovered over any column in Search guide, Search Inspector, search history, and the right panel where the list of columns in a Business View is displayed.
When hovered over any axis label/ legend label on a chart.
Explore:
When hovered over a column in the right panel where the list of columns in a Business View is displayed.
When hovered over a column in the filter list on a chart.
To add description:
From the metadata view,
For the required column, click on Click to edit under Description.
Provide the required description within 2000 characters.

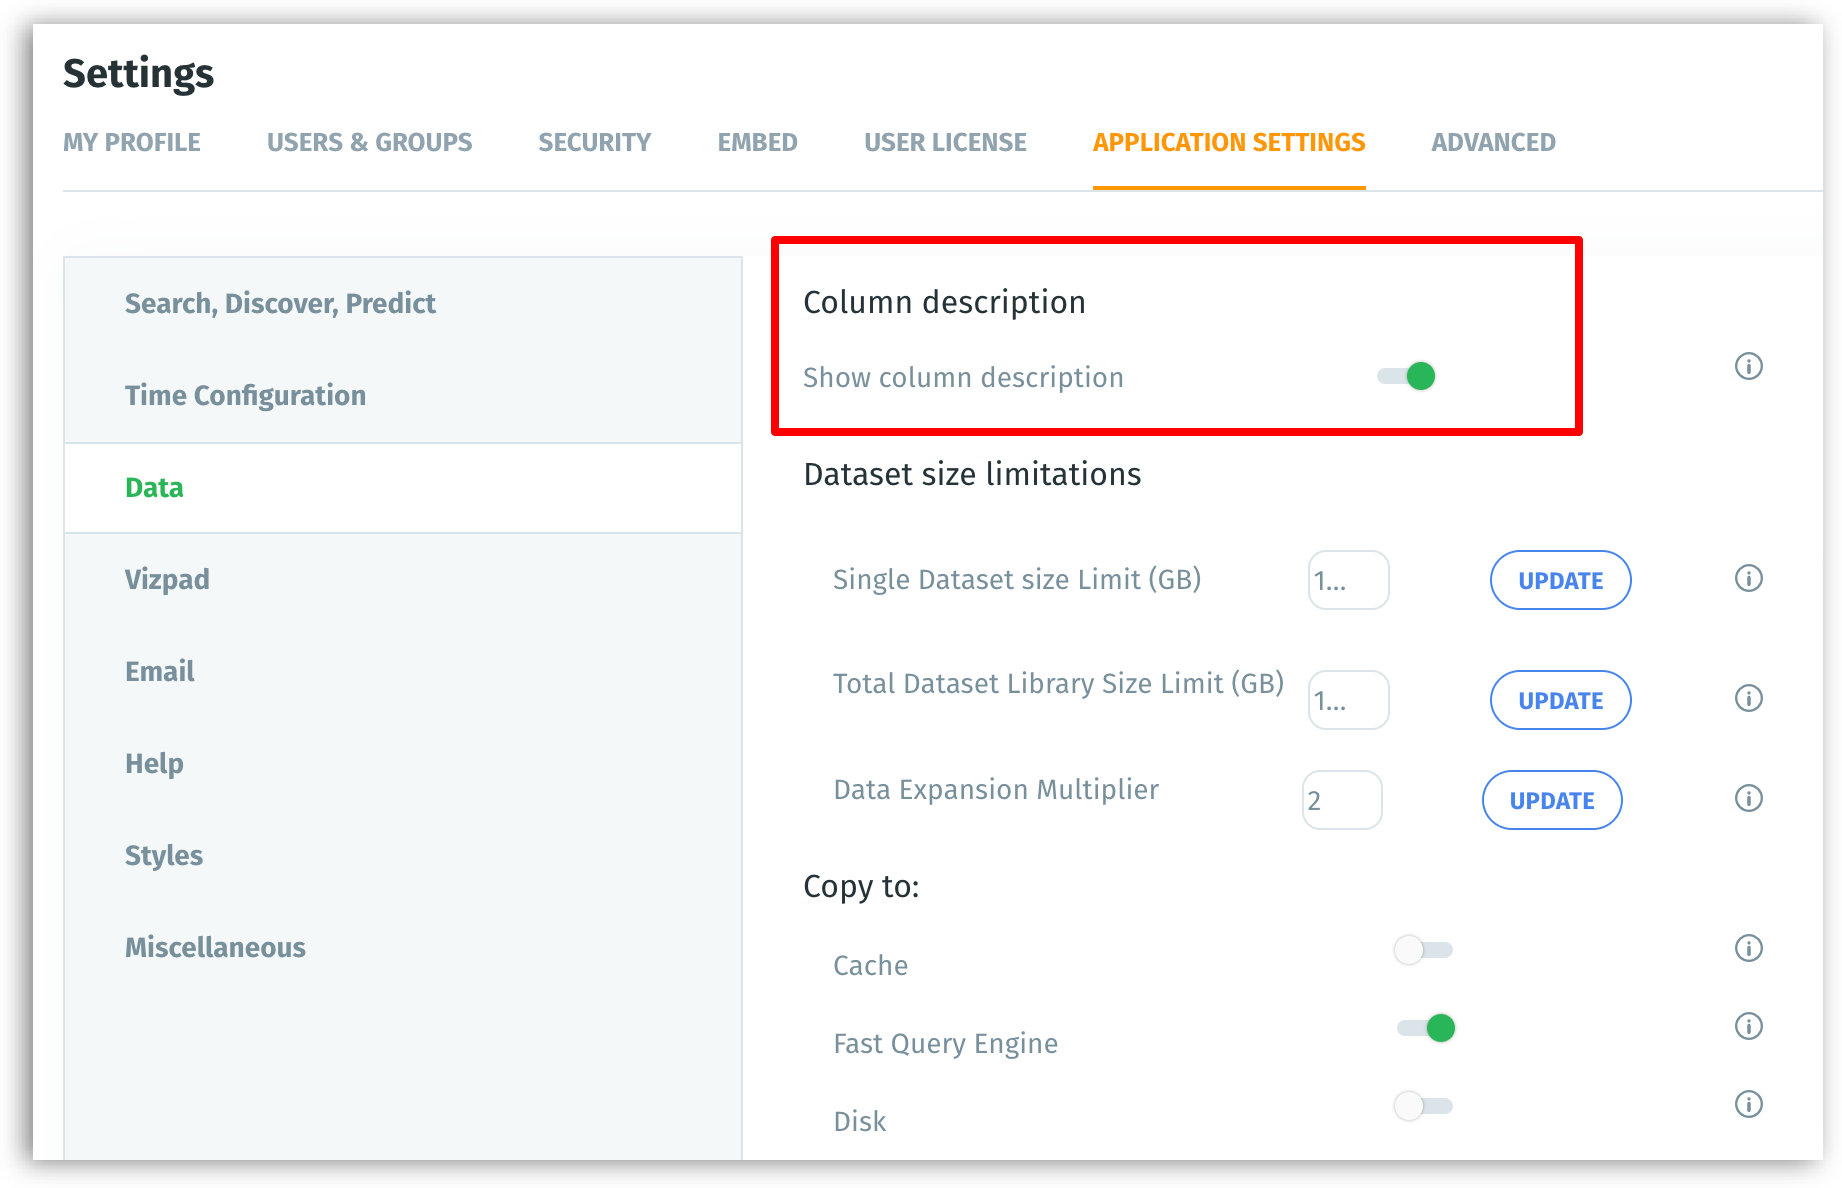
To hide the description tooltips, navigate Settings → Application Settings → Data and disable the Show Column Description toggle under Column description.
The Show Column Description option will be enabled by default.
Bulk operation
From the metadata view, Tellius offers the flexibility to select multiple columns and apply changes to them as required. Bulk editing is a time-saver, especially when you have a large dataset with multiple columns needing the same property changes (e.g., converting a batch of numeric fields from Dimensions to Measures). To perform bulk operations,
Select the required columns by clicking on the checkbox near the Column name.
The following metadata can be modified in bulk:
Column type
Feature type
Aggregation
Data format
Include in Discovery
Include in Insight
Include in Predict

Was this helpful?