Advanced Analytics
Unlock deeper insights with advanced analytics featuring benchmarks, target lines, and customizable visual metrics to enhance clarity and data-driven decisions.
The "Advanced Analytics" (or "Viz Analytics") section provides additional data points and benchmarks that can provide deeper insights and context. Incorporating Y-axis target lines and Benchmarks in a chart makes it easier for users to measure performance, identify trends, and make data-driven decisions.
The Advanced Analytics section can be found only in bar, line, combo, scatter, bubble, histogram, waterfal, growth, bar conversion, confidence range, and YoY charts.
Here's an explanation of each component within this section:

Y-Axis Target Lines
This feature enables users to set and display vertical lines across the chart that represent specific points along the X-axis, such as dates, times, or categories. It's useful for marking significant events or thresholds and for comparing segments of data against these specific points.
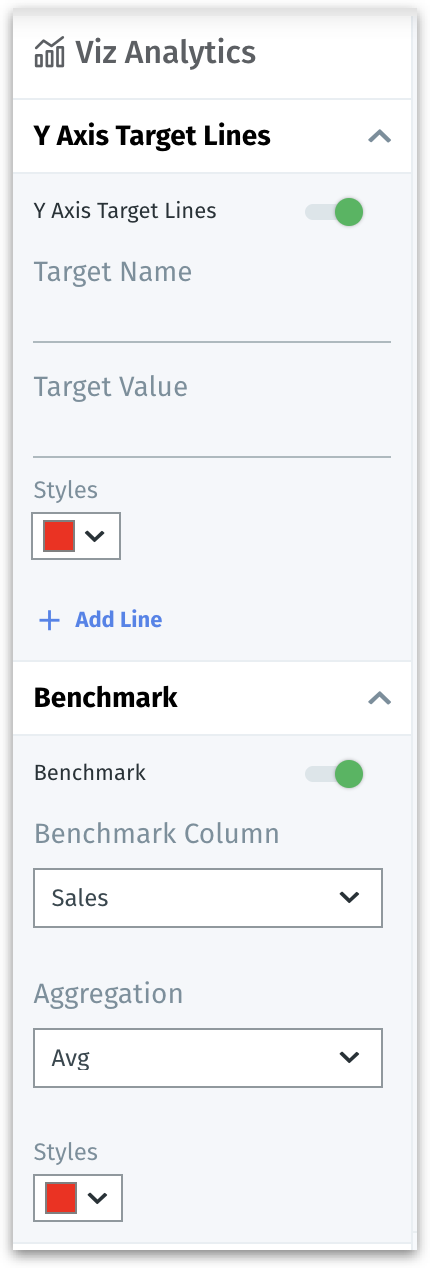
Y-Axis target lines toggle: This switch activates or deactivates the display of target lines on the Y-axis.
Target name: Users can enter a name for each target line.
Target value: In this field, you enter the specific numeric value for the target line, establishing where on the X-axis the line will appear, which serves as a reference point against which the Y-axis data points can be compared
Styles: This dropdown allows users to choose the color and style of the target line.
Add line: To insert additional target lines as required.
Benchmark
The benchmarking section is used to compare data points against a standard or average, providing a reference point for analysis.
Benchmark toggle: This switch activates or deactivates the display of benchmark data on the chart.
Benchmark column: Users can select the column from the Business View that will be used to calculate the benchmark.
Aggregation: This option determines how the benchmark data is aggregated (average, sum, min, max, stddev, variance, median).
Styles: Similar to target lines, this dropdown allows the customization of the benchmark line's appearance.
X-Axis Target Lines
The "X-Axis Target Lines" allows users to add horizontal lines across the chart, which serve as benchmarks or goals for the data being visualized. X-axis target lines can be used for comparing actual data points against targets to assess performance and establish clear visual goals for future performance.

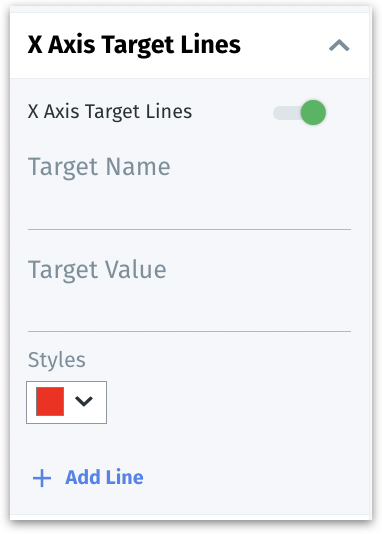
X-Axis target lines toggle: This switch activates or deactivates the display of target lines on the X-axis.
Target name: This field is where you input the name of the target line.
Target value: Here, you specify the numerical value where the target line should be placed on the Y axis. This value represents a particular goal or threshold you want to compare your data against.
Styles: This dropdown allows users to choose the color and style of the target line.
Add line: To insert additional target lines as required.
X-axis target lines vs Y-axis target lines vs Benchmark X-axis target lines extend horizontally across a chart, serving as benchmarks by representing specific values on the Y-axis. These lines are instrumental in gauging data against set targets or goals.
Y-axis target lines, on the other hand, display vertically to mark significant values on the X-axis, such as specific times or categories, facilitating segment-wise comparison.
A benchmark line is a distinct reference line that sets a standard or average for comparison across a dataset. Depending on the chart's context, it can run horizontally to benchmark values or vertically to mark time or categorical milestones.
The core distinction between these lines lies in their orientation and purpose: X-axis target lines provide a horizontal reference for Y-axis values, while Y-axis target lines offer a vertical reference for X-axis points
Was this helpful?