List of chart-specific fields
Explore chart-specific fields in Tellius—advanced options like anomalies, stacking, bin sizes, totals, maps, and cohort settings to build richer visualizations.
In addition to the above-mentioned fields, the following charts contain extra fields for building charts.
Each of these additional fields enhances the chart and allows users to tailor visualizations specific to their analytical needs. Charts with multiple measures or dimensions offer a more complex view of the data, revealing relationships and patterns.
Line Chart
Show Anomalies (enable/disable toggle): Highlights unusual data points or trends in your line chart, helping to quickly identify outliers or exceptions. Enable this option to view the anomalies in the chart.
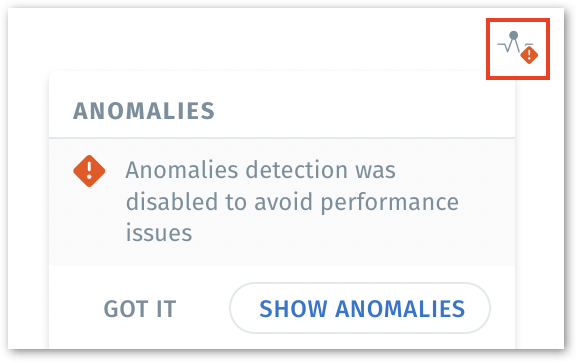
If the chart has one too many anomalies that might hinder performance, then Tellius automatically hides them and shows an icon in the chart result window.
Click on the icon and the following will be displayed.
Click on Show anomalies to view the anomalies nevertheless, and the anomalies will be highlighted across the line chart.
For more details on anomaly management in Search, check out this section.

Area Chart: Fills the space under a line chart with color, emphasizing the cumulative total over time or between categories.
Bar Chart
Horizontal bar: By default, Tellius displays a vertical bar chart. Users can switch to a horizontal bar chart if required.
Stacked: This option allows you to layer different data series on top of each other within the same bar, making it easy to compare the segment composition of each category.
Tellius facilitates the inclusion of more than two measures for both bar and line in a combo chart. Under Bar Measures and Line Measures fields, you can drag and drop as many measures as you want from the required Business View.
Bubble Chart
Size: Adjusts bubble size, representing a third data dimension such as quantity or importance, adding depth to your analysis.
Treemaps
Color (Range): Colors the blocks based on value, helping you spot trends and outliers at a glance.
Group (Sub Category): Organizes data into subgroups, allowing for detailed hierarchical structure within the treemap.
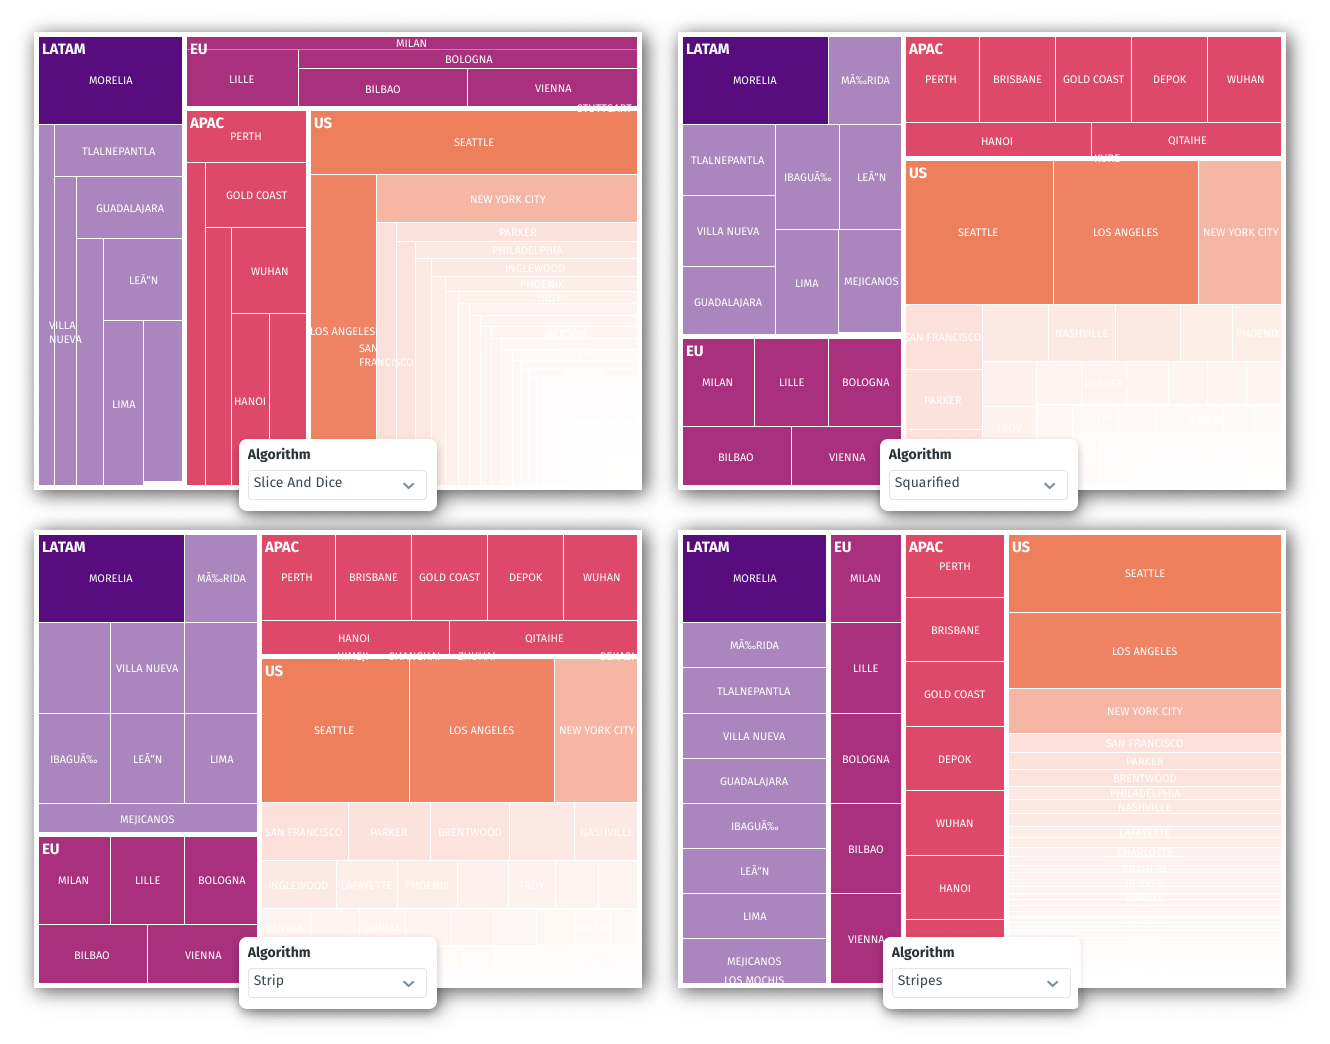
Algorithm: Tellius supports all four algorithms by Highcharts. Layout options such as stripes, slice and dice, squarified, and strip are provided to give users more control over the visual organization of data.

Scatter Chart
2 Measure fields: Utilizes two measures to plot data points based on two quantitative variables, one on the X-axis and one on the Y-axis, ideal for revealing relationships.
Points: Represents individual data points on the chart.
Size for Points: Adjusts the size of the data points, which can represent an additional variable or dimension.
Sankey Charts
Requires 2 Dimensions and 1 Measure to show the flow from one dimension to the other, with the measure typically representing the size of the flow.
Heat Maps
2 Dimensions with no Measure: The dimensions represent the axes of the heatmap, with color intensity showing the frequency of occurrences.
Include zero values: Fills in empty spaces with zeroes, ensuring a complete matrix.
Totals Section: Adds sum totals to rows and columns, with customizable colors for quick identification.
"Totals" refer to the sum of numerical values within a row or column. Row totals add up all the values in a horizontal row, while column totals sum all the data in a vertical column, providing a quick overview of the aggregated data in each respective direction.
Histogram
Count of Bins: Allows you to choose the number of groups (bins) to divide the data, which affects the granularity of the distribution.
Size of Bins: Lets you set the size of each bin, giving you the ability to adjust the range each bin covers.
There are no aggregations because histograms display the frequency of data points. This means they count how often each value occurs in your data set, rather than summing up or averaging values.
To effectively use a histogram for a particular dimension (like age), you need to ensure that the data is in a numerical format. If the age data is not initially set as numeric, you'll need to change the column type in your dataset to measure. This is because histograms rely on numeric values to create frequency counts.
Table
Totals and Subtotals: Offers the option to display sum totals for columns, with the ability to customize the color of totals.
The width of the columns in tables can be resized.
Detailed Table
Columns Field: Allows for the selection and ordering of data columns, providing a granular view of your information.
Pivot Table
1 Measure and 2 Dimensions: Combines one measure and two dimensions to create a cross-tabular view, with dimensions defining the rows and columns.
Sort by Rows and Sort by Columns: Sorts the rows and columns within the pivot table
Show rows and Column headers: Provide the number of rows and number of columns to be displayed
Totals and Subtotals: Provides options to display the subtotals and totals for both rows and columns, with color customization.
Boundary Map
Boundary Column: Specifies the geographic data to be used for creating boundaries.
Boundary Type: Dropdown to select the geographic level of detail (Country or city or state or zip or county).
Count of Bins: Numeric input that influences the granularity of data points across the map.
Location Map
Latitude and Longitude: Define the precise points for data plotting.
Size: Typically represents the magnitude of a variable at those points, such as sales or population.
KPI Target
Target
Column - Select the required column which needs to be considered as the target value.
Number - Provide the number that needs to be considered as the target value.
Display Label as - Choose if you want the label (text at the centre of the chart) to be displayed as Values (actual values) or Percentage to represent progress towards the target.
Tooltip - A maximum of five columns can be added to be displayed in the tooltip on hover (in addition to the measure and target columns).
Show rows - By default, 50 rows will be considered for a KPI target chart.
Trend Chart
Growth Chart: Presents an alternative view to the trend chart that highlights growth over time, focusing on incremental change.
Confidence Range
Measure (Upper Band) and Measure (Lower Band): Defines the high and low estimates around a projection, visualizing potential future scenarios.
Cohort Chart
Initial Event: Represents the starting point or the first action of the group you're analyzing. It defines the cohort, and determines the behavior you'll track over time.
Second Event: Defines the subsequent action or behavior you want to track within the cohort. It’s the key event that follows the Initial Event.
By comparing the Initial and Second Events, you can gain insights into user retention, repeat behavior, or other engagement metrics.
Cohort Size: Specifies the size of the cohort you are analyzing.
YoY Chart
Date Dimension: Compares the same periods across different years to highlight trends and annual changes.
Was this helpful?